-
 New Jersey is the most densely populated state.
 -
 New York is home to the most populous city in the country, and ranks 8th among the states in density.
 -
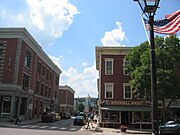 Despite a small population, Vermont has fairly average population density because of its small area.
 -
 Idaho's population has increased rapidly in recent decades, but its population density is lower than other states.
 -
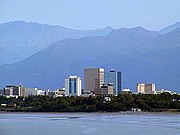 About half of the population of Alaska lives in the Anchorage metropolitan area.
 -
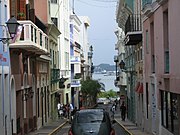 Puerto Rico is the fourth most densely populated of states and possessions of the U.S.

This is a list of the 50 states, the 5 territories, and the District of Columbia by population density, population size, and land area. It also includes a sortable table of density by states, territories, divisions, and regions by population rank and land area, and a sortable table for density by states, divisions, regions, and territories in square miles and square kilometers.
The population density of the United States is lower than that of many other countries because of the United States' large land area. There are large, sparsely populated areas in parts of the US, like the east-to-west stretch extending from the outskirts of Seattle all the way to Minneapolis, or the north-to-south portion from northern Montana to southern New Mexico, excluding Denver and Albuquerque. For comparison, the population density of the U.S. is 1/15 that of South Korea and 1/12 that of India and the Netherlands. On the other hand, it is over 8 times higher than that of Canada and over 9 times higher than that of Australia. [1]
States and territories by population density
Population density is defined as the population divided by land area. Data are from the US Census unless otherwise specified. Population data are for the year 2023 [2] and area data are for the year 2010. [3] Some population estimates for territories are from the United Nations Commission on Population and Development. [4]
| Location | Density | Population | Land area | |||
|---|---|---|---|---|---|---|
| mi2 | km2 | mi2 | km2 | |||
| 11,131 | 4,297 | 678,972 | 61 | 158 | ||
| 1,263 | 488 | 9,290,841 | 7,354 | 19,047 | ||
| 1,060 | 409 | 1,095,962 | 1,034 | 2,678 | ||
| 936 | 361 | 3,205,691 | 3,424 | 8,868 | ||
| 898 | 347 | 7,001,399 | 7,800 | 20,202 | ||
| 824 | 319 | 172,952 | 210 | 543 | [4] | |
| 747 | 288 | 3,617,176 | 4,842 | 12,542 | ||
| 737 | 284 | 98,750 | 134 | 348 | [4] | |
| 637 | 246 | 6,180,253 | 9,707 | 25,142 | ||
| 578 | 222 | 43,915 | 76 | 198 | [4] | |
| 529 | 204 | 1,031,890 | 1,949 | 5,047 | ||
| 422 | 163 | 22,610,726 | 53,625 | 138,887 | ||
| 415 | 160 | 19,571,216 | 47,126 | 122,057 | ||
| 290 | 112 | 12,961,683 | 44,743 | 115,883 | ||
| 288 | 111 | 11,785,935 | 40,861 | 105,829 | ||
| 274 | 106 | 49,796 | 182 | 472 | [4] | |
| 250 | 97 | 38,965,193 | 155,779 | 403,466 | ||
| 226 | 87 | 12,549,689 | 55,519 | 143,793 | ||
| 223 | 86 | 1,435,138 | 6,423 | 16,635 | ||
| 223 | 86 | 10,835,491 | 48,618 | 125,920 | ||
| 221 | 85 | 8,715,698 | 39,490 | 102,279 | ||
| 192 | 74 | 11,029,227 | 57,513 | 148,959 | ||
| 192 | 74 | 6,862,199 | 35,826 | 92,789 | ||
| 179 | 69 | 5,373,555 | 30,061 | 77,857 | ||
| 178 | 69 | 10,037,261 | 56,539 | 146,435 | ||
| 173 | 67 | 7,126,489 | 41,235 | 106,798 | ||
| 157 | 60 | 1,402,054 | 8,953 | 23,187 | ||
| 118 | 45 | 7,812,880 | 66,456 | 172,119 | ||
| 117 | 45 | 30,503,301 | 261,232 | 676,587 | ||
| 115 | 44 | 4,526,154 | 39,486 | 102,269 | ||
| 109 | 42 | 5,910,955 | 54,158 | 140,268 | ||
| 106 | 41 | 4,573,749 | 43,204 | 111,898 | ||
| 101 | 39 | 5,108,468 | 50,645 | 131,171 | ||
| 90 | 35 | 6,196,156 | 68,742 | 178,040 | ||
| 74 | 28 | 1,770,071 | 24,038 | 62,259 | ||
| 72 | 28 | 5,737,915 | 79,627 | 206,232 | ||
| 70 | 27 | 647,464 | 9,217 | 23,871 | ||
| 65 | 25 | 7,431,344 | 113,594 | 294,207 | ||
| 63 | 24 | 2,939,690 | 46,923 | 121,531 | ||
| 59 | 23 | 4,053,824 | 68,595 | 177,660 | ||
| 59 | 23 | 3,067,732 | 52,035 | 134,771 | ||
| 57 | 22 | 3,207,004 | 55,857 | 144,669 | ||
| 57 | 22 | 5,877,610 | 103,642 | 268,431 | ||
| 45 | 17 | 1,395,722 | 30,843 | 79,883 | ||
| 44 | 17 | 4,233,358 | 95,988 | 248,608 | ||
| 42 | 16 | 3,417,734 | 82,170 | 212,818 | ||
| 36 | 14 | 2,940,546 | 81,759 | 211,754 | ||
| 29 | 11 | 3,194,176 | 109,781 | 284,332 | ||
| 26 | 10 | 1,978,379 | 76,824 | 198,974 | ||
| 24 | 9.2 | 1,964,726 | 82,643 | 214,045 | ||
| 17 | 6.7 | 2,114,371 | 121,298 | 314,161 | ||
| 12 | 4.7 | 919,318 | 75,811 | 196,350 | ||
| 11 | 4.4 | 783,926 | 69,001 | 178,711 | ||
| 7.8 | 3.0 | 1,132,812 | 145,546 | 376,962 | ||
| 6.0 | 2.3 | 584,057 | 97,093 | 251,470 | ||
| 1.3 | 0.50 | 733,406 | 570,641 | 1,477,953 | ||
| Contiguous US | 113 | 43 | 332,746,351 | 2,954,843 | 7,653,006 | |
| 50 States | 95 | 37 | 334,235,923 | 3,531,846 | 9,147,436 | |
| 50 States and DC | 95 | 37 | 334,914,895 | 3,531,907 | 9,147,594 | |
| United States | 96 | 37 | 338,485,999 | 3,531,905 | 9,147,593 | |
Gallery
Gallery of U.S. States

.jpg)


See also
References
- ^ United Nations World Population Prospects Archived December 29, 2010, at the Wayback Machine
- ^ "Annual Estimates of the Resident Population for the United States". census.gov. December 12, 2023. Retrieved February 21, 2024.
- ^ "State Area Measurements and Internal Point Coordinates". census.gov. December 16, 2021. Retrieved February 21, 2024.
- ^ a b c d e Population data: "Total population by sex". un.org. Retrieved February 21, 2024.
External links
population density at Wikipedia's
sister projects
 Definitions from Wiktionary
 Media from Commons
 News from Wikinews
 Quotations from Wikiquote
 Texts from Wikisource
 Textbooks from Wikibooks
 Resources from Wikiversity