Requests Information
- Article(s)
- Depth Map for Mediterranean
- Request
- I noticed that you do not have a depth map for the Mediterranean sea. The only one I found was at http://www.divinglore.com/Genesis/Mediterranean%20Depth%20Chart.html. I think Wikipedia should have one. I am not tech savy so hope this gets to you. You could have made it easier for less accomplished users. Tom T. Moore
Looks good. 78.148.76.61 ( talk) 17:18, 20 April 2016 (UTC)
- Graphist opinion(s)
![]() Request taken by
Ikonact (
talk) 00:25, 8 January 2015 (UTC).
Request taken by
Ikonact (
talk) 00:25, 8 January 2015 (UTC).
Hi, here is a first attempt. Please let me know if this is OK. -- Ikonact ( talk) 00:25, 8 January 2015 (UTC)
-
 Bathymetry map of the Mediterranean Sea

- Article(s)
- 2015 Mamasapano clash
- Request
- Please create a comprehensive map of the incident. Using maps from this Source. Maybe someone who has an experience creating battle maps can help me with this request-- Hariboneagle927 ( talk) 09:47, 10 February 2015 (UTC)
- Graphist opinion(s)
@ Hariboneagle927: I think you have to be a bit more specific as your link contains a lot of information. You have to understand that we (graphic workers) have zero knowledge of this subject. You have to tell us exactly what you want and provide us with the information we need, and just the information we need. Then we can create something for you. -- Goran tek-en ( talk) 20:07, 2 March 2015 (UTC)
-
 Shaded relief map of Los Santos Province done with an old map.

- Article(s)
- Los Santos Province
- Request
- Hi, I need a shaded relif map for Los Santos province, to use in both English and Spanish wikipedia. There is an old one that can be improved. I this link you can find some political maps of the province. here is map of the country, a shaded relief with name of cities. I'd be very grateful if someone can do a good map for this province. I tried but I am not good at it. … -- 62.254.75.81 ( talk) 20:34, 22 February 2015 (UTC)
- Graphist opinion(s)
I don't sure that satisfies your needs, but here is relief map I created: File:Panama Los Santos relief map.png. -- NZeemin ( talk) 19:30, 24 April 2016 (UTC)

Philg88 ♦ talk 09:18, 10 November 2015 (UTC)
- Article(s)
- Interstate 895 (Rhode Island–Massachusetts)
- Request
- I think it would enrich the article about that proposed highway if we had a map. The path is described in the article and I tried to render it using Openstreetmap, but it was more complicated than what I anticipated. Would somebody like to make the map for me? Thanks! -- bcartolo ( talk) 19:54, 27 February 2015 (UTC)
- Graphist opinion(s)
Still wanted...
95.146.115.122 (
talk) 13:00, 15 December 2015 (UTC)
-
 The only blank map of Jamaica available currently.
 -
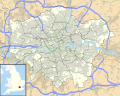 Detail map of London, England metro area.


- Request
- The current football season in Jamaica has 7 teams in the Kingston area alone. There needs to be a larger detail map of the Kingston metropolitan area to help place the locations of the different teams in a clear way. This map could also be used in the Jamaica page, as well as the Kingston parish and city pages, respectively. Please see the map of London in the gallery for an example what I'm looking to accomplish. -- IKwasowski ( talk) 08:53, 5 March 2015 (UTC)
- Seconded. There are over fifty buildings, etc in Category:Kingston, Jamaica that this could be used on. -Arb. ( talk) 19:19, 6 March 2015 (UTC)
- Sources
From https://www.lib.utexas.edu/maps/jamaica.html City Maps
- Kingston - Central Sheet 1:10,000 Directorate of Overseas Surveys, D.O.S. 201, 1962 (16.4MB)
- Kingston - Sheet 1 1:10,000 Directorate of Overseas Surveys, D.O.S. 201, 1965 (11.0MB)
- Kingston - Sheet 2 1:10,000 Directorate of Overseas Surveys, D.O.S. 201, 1965 (9.2MB)
- Kingston - Sheet 3 1:10,000 Directorate of Overseas Surveys, D.O.S. 201, 1963 (16.1MB)
- Kingston - Sheet 4 1:10,000 Directorate of Overseas Surveys, D.O.S. 201, 1963 (11.6MB)
- Kingston - Sheet 5 1:10,000 Directorate of Overseas Surveys, D.O.S. 201, 1963 (14.7MB)
- Kingston - Sheet 6 1:10,000 Directorate of Overseas Surveys, D.O.S. 201, 1963 (16.8MB)
These are all UK Governement publications with a fifty year copyright which has expired. In Wikimedia Commons terms they'd have an {{ OldOS}} licence.
More modern source: http://www.openstreetmap.org/#map=13/18.0125/-76.7924
- Graphist opinion(s)
- Request
A location map for Dhaka within Bangladesh.
To be used primarily on building and street articles eg Curzon Hall of which there are over 100 in Category:Buildings and structures in Dhaka.
Possible source map: http://www.openstreetmap.org/#map=13/23.7387/90.4008
-Arb. ( talk) 19:08, 6 March 2015 (UTC)
- Graphist opinion(s)

I've photographed an out-of-copyright 1905 map of the River Thames wharves in central and east London. It needs to be stitched together - there are six segments divided between two horizontal strips, each with three segments at the top and three at the bottom. The colours also need to be equalised and the segments need to be correctly sized and positioned alongside each other. The segments are:
- File:Thames wharf map top left third.jpg
- File:Thames wharf map top middle third.jpg
- File:Thames wharf map top right third.jpg
- File:Thames wharf map bottom left third.jpg
- File:Thames wharf map bottom middle third.jpg
- File:Thames wharf map bottom right third.jpg
Could someone please help with this? Prioryman ( talk) 21:23, 2 April 2015 (UTC)
- I have some software designed to do that; but it requires at least some overlap between each pair of adjacent segments. My impression is that the 1st and 2nd have a gap between them (ok, maybe no gap, but no overlap as required: look at London Bridge station), and the 5th and 6th have no overlap.
Maproom (
talk) 21:33, 2 April 2015 (UTC)
- I think the gaps exist on the original map. It consists of a sheet of cloth onto which squares of map have been glued, so there are gaps between the individual squares. I presume they made it that way to be more resistant to folding than it would be if it was a single sheet of paper.
Prioryman (
talk) 21:48, 2 April 2015 (UTC)
- Ah, that's what the OS called the "dissected" edition. They stopped making these by the end of 1952, but they carried on making the non-dissected cloth-backed maps until circa 1967. -- Redrose64 ( talk) 23:15, 2 April 2015 (UTC)
- I think the gaps exist on the original map. It consists of a sheet of cloth onto which squares of map have been glued, so there are gaps between the individual squares. I presume they made it that way to be more resistant to folding than it would be if it was a single sheet of paper.
Prioryman (
talk) 21:48, 2 April 2015 (UTC)
@ Prioryman: After some resizing and cropping, this is what it looks like. Unfortunately, because the photos were taken from different angles/distances (even minute changes have a major effect), this is the best I can come up with. Philg88 ♦ talk 05:39, 9 April 2015 (UTC)
.svg)
- Article(s)
- East African Federation
- Request
- Maybe someone could colour Somalia and South Sudan in a lighter shade of green, as they have applied to join the East African Community and could potentially form part of the proposed East African Federation.
- Graphist opinion(s)
- @ Snow Lion Fenian:, I think it might be speculating too much to change the Federation map, since they are not part of the East African Community yet. I would propose changing File:East African Community (orthographic projection).svg to show that they have ongoing applications to join. Maybe even highlight Sudan light red/orange for a failed bid. What are your thoughts? Jolly Ω Janner 21:01, 5 November 2015 (UTC)

- Request
- South Sudan is no longer part of Sudan or OAPAC, hence it needs to be coloured grey on the above map to reflect that.
- Graphist opinion(s)
![]() Request taken by
Jolly
Ω
Janner 03:03, 1 November 2015 (UTC).: immediately. @
Snow Lion Fenian:, I cannot find any evidence in the article nor after a quick look at the OAPEC website, that Mauritania, Sudan, Yemen and Oman are possible future members. Unless you know where this evidence can be found, I'm inclined to omit this from the new map.
Jolly
Ω
Janner 03:03, 1 November 2015 (UTC)
Request taken by
Jolly
Ω
Janner 03:03, 1 November 2015 (UTC).: immediately. @
Snow Lion Fenian:, I cannot find any evidence in the article nor after a quick look at the OAPEC website, that Mauritania, Sudan, Yemen and Oman are possible future members. Unless you know where this evidence can be found, I'm inclined to omit this from the new map.
Jolly
Ω
Janner 03:03, 1 November 2015 (UTC)
;Article(s):
- Request
- Could anybody create a map of this -> flight route? -- S078 13:35, 9 May 2015 (UTC)
- Graphist opinion(s)
 Not done @
S078: Sorry, but the link is now dead and I couldn't find it on web archives of the URL either. There was only one image I can find of the flight path, but it was from an aviation magazine. I think this one may have to be left, unless the flight path can be found on a reliable source. As far as I recall, it crashed 3 miles from the airport, so there was not much of a flight path.
Jolly
Ω
Janner 03:39, 1 November 2015 (UTC)
Not done @
S078: Sorry, but the link is now dead and I couldn't find it on web archives of the URL either. There was only one image I can find of the flight path, but it was from an aviation magazine. I think this one may have to be left, unless the flight path can be found on a reliable source. As far as I recall, it crashed 3 miles from the airport, so there was not much of a flight path.
Jolly
Ω
Janner 03:39, 1 November 2015 (UTC)

- Article(s)
- Altai Mountains
- Request
- I noticed that the map in the infobox in Altai Mountains is not a very good map. It's a bit fuzzy and the labels are not in English. I don't know how to find a better map. Perhaps somebody here could find or make one. Thanks. CorinneSD ( talk) 22:27, 11 May 2015 (UTC)
- Graphist opinion(s)
@ CorinneSD: Same as for your other request. You have to think about that we are graphic workers with zero knowledge of all the different subjects. You as the requester has to provide translations, information, knowledge, help and feedback so we can do the graphic work. We don't do research or investigations, please understand that, thanks. -- Goran tek-en ( talk) 18:37, 25 July 2015 (UTC)
- Goran tek-en Oh. Thanks for the explanation. - CorinneSD ( talk) 23:25, 26 July 2015 (UTC)

- Article(s)
- Manchu people
- Request
- I just saw this map in the article on Manchu people in the section Manchu people#Origins and early history. I don't think it's a particularly good map, and the labels are not in English. Could somebody find or make a better map? CorinneSD ( talk) 22:58, 11 May 2015 (UTC)
- Graphist opinion(s)
@ CorinneSD: To be able to even start to do something we would need all of the translations and that someone could give us information on the meaning of the different colors. -- Goran tek-en ( talk) 18:32, 25 July 2015 (UTC)

- Article(s)
- Battle of Palmito Ranch
- Request
- please wikify… -- Kintetsubuffalo ( talk) 03:05, 12 May 2015 (UTC)
- Graphist opinion(s)
I think you mean to turn it into a svg without the background? Houdinipeter ( talk) 03:34, 23 April 2016 (UTC)
- Article(s)
The other regions have hundreds of article using their maps
- Request
These regions are missing location maps. They are the only ones in china that are missing. Would be very useful to have them! ShakyIsles ( talk) 00:04, 8 July 2015 (UTC)
- I second this request (which has been made several times before). These are provinces each with tens of millions of people and thousands of cities and towns. Zhejiang, Shaanxi, Beijing, Tianjin location maps are also missing. See Category:China location map templates. - Zanhe ( talk) 05:17, 24 November 2015 (UTC)
- Graphist opinion(s)


- Article(s)
- Elizabeth II of the United Kingdom, British Empire
- Request
- Could someone please create a PNG map of the British Empire as it was in 1952, at the start of Elizabeth II's reign, using the shaded countries from the first map (above left) and the borders of the world featured on the Map of the 1952 Olympics (above right). The colonies and protectorates should be shown in dark red, and the dominions - Canada, Australia (including Papua New Guinea), New Zealand, South Africa (including Namibia), Pakistan (including Bangladesh) and Ceylon/Sri Lanka - should be in pink.
User:Snow Lion Fenian — Preceding unsigned comment added by 5.134.90.140 ( talk) 18:10, 19 May 2015
- Graphist opinion(s)
Would someone be able to create a map for the China-Pakistan Economic Corridor using the model supplied here? The article is badly in need of a map. Currently, the ones that have been used have all been taken from somewhere in the internet and deleted for copyright. I can't find a free or public version. Hence, it would be great if someone here could do the cartography. The link I've given is reliable, as the map has been designed by the National Highways Authority (Pakistan) and has their logo on it. Mar4d ( talk) 14:07, 23 May 2015 (UTC)
- Also, that map uses the term Indian Occupied Kashmir for Indian-administered Kashmir, but for NPOV purposes, it may be better to have a map that uses Jammu and Kashmir, the official name of the disputed territory. Mar4d ( talk) 14:08, 23 May 2015 (UTC)
- I will suggest to creators that, using bare term Jammu and Kashmir in Pakistan map will suggest that Jammu and Kashmir is one of state of Pakistan while in reality it is one of democratic state of India. so better term should be used in map will be "Indian administered Kashmir" for Indian side and "Pakistan administered Kashmir" for Pakistan side of Kashmir. United Nations maps do have such terms. If Pakistan side of Kashmir is not mentioned as "Pakistan administered Kashmir" then that Map will be nominated for deletion on Wikimedia. -- Human3015 Say Hey!! • 16:03, 23 May 2015 (UTC)
- It's a map of Pakistan. Like all the other maps, all the provinces have their own names, including Pakistan-administered Kashmir. The only reason why Jammu and Kashmir is added is because it's a territorial claim.
Mar4d (
talk) 16:50, 23 May 2015 (UTC)
- Pakistan government itself consider "Paksitan administered Kashmir" as "disputed territory".
see map on Pakistan's government site. This map can be seen on all Pakistan's government websites. If both side of Kashmir is disputed then why only Indian side should be called as "Administered side". It is map of "only" Pakistan on government websites still they show "Pak administered Kashmir" as "disputed" one. So there should be no question regarding this issue that both sides should be called as "administered side".--
Human3015
Say Hey!! • 17:06, 23 May 2015 (UTC)
- You showed me one map, but there are thousands of maps and I can show you any with Jammu and Kashmir. Pakistan doesn't dispute Kashmir as its claimed territory, it only disputes its status. This article is on the
China-Pakistan Economic Corridor, not the
Kashmir conflict, so such maps are not relevant. As a major portion of the project is concentrated in Gilgit-Baltistan, an official map accurately showing the territory and all the other
Administrative units of Pakistan would be required. And by the way, you won't find any official map of Pakistan where Kashmir is excluded.
Mar4d (
talk) 18:48, 23 May 2015 (UTC)
- If you can show me "thousands of maps" then please show 10 maps from Pakistan's government websites. If this article is about China and Pakistan then no need to show Indian state in it. If Pakistan claims Jammu and Kashmir then India also claims Pakistan side of Kashmir. I can show "thousands of Maps" from Indian government websites. You will say this is article about Pakistan, then it doesn't mean that Government of Pakistan owns this article. We have to write article on the basis of international standards, not on local standards. Anyway, don't debate on it. I was just giving my opinion to creators, not to you. Hope creators got my point. This is sensitive issue and any wrong map will be nominated for deletion on Wikimedia commons. Thank you.-- Human3015 Say Hey!! • 19:05, 23 May 2015 (UTC)
- You showed me one map, but there are thousands of maps and I can show you any with Jammu and Kashmir. Pakistan doesn't dispute Kashmir as its claimed territory, it only disputes its status. This article is on the
China-Pakistan Economic Corridor, not the
Kashmir conflict, so such maps are not relevant. As a major portion of the project is concentrated in Gilgit-Baltistan, an official map accurately showing the territory and all the other
Administrative units of Pakistan would be required. And by the way, you won't find any official map of Pakistan where Kashmir is excluded.
Mar4d (
talk) 18:48, 23 May 2015 (UTC)
- Pakistan government itself consider "Paksitan administered Kashmir" as "disputed territory".
see map on Pakistan's government site. This map can be seen on all Pakistan's government websites. If both side of Kashmir is disputed then why only Indian side should be called as "Administered side". It is map of "only" Pakistan on government websites still they show "Pak administered Kashmir" as "disputed" one. So there should be no question regarding this issue that both sides should be called as "administered side".--
Human3015
Say Hey!! • 17:06, 23 May 2015 (UTC)
- It's a map of Pakistan. Like all the other maps, all the provinces have their own names, including Pakistan-administered Kashmir. The only reason why Jammu and Kashmir is added is because it's a territorial claim.
Mar4d (
talk) 16:50, 23 May 2015 (UTC)
University article of Vasantrao Naik Marathwada Agricultural University is under construction. As every university article has its logo in infobox, this article also needs logo. this is official website of the university. This is agriculture university of Government of India, so it very important article which very stub right now. This university is one of only 4 agri universities of Maharashtra state and has enormous campus which includes 40-50 villages.(as it is a agri university). So article needs to be good. You can see logo on upper left corner of the official website. Kindly help. Thank you. -- Human3015 Say Hey!! • 04:20, 24 May 2015 (UTC)
- If you want a logo, ask for it in the Illustration Workshop. This is the Map Workshop. Wereldburger758 ( talk) 06:38, 24 May 2015 (UTC)
Maps for Baluchi dialects
- Western Baluchi: Afghanistan, Southern Pakistan, Turkmenistan and Uzbekistan ( Turkmenistan), Iran
- Eastern Baluchi: Southern Pakistan, India, Map 1
- Southern Baluchi: Southern Pakistan, Oman, South part of Sistan and Baluchestan Province from Western Baluchi
Thank you.
Mjbmr (
talk) 11:32, 24 May 2015 (UTC)
@
Mjbmr: Please use the "New request" link at the top as it gives us all the code we need. I don't understand your request so you will have to explain it much more. Please remember that the graphic workers probably have zero knowledge of the subject, thanks. --
Goran tek-en (
talk) 19:33, 8 July 2015 (UTC)
- Article(s)
- Channels of the Hawaiian Islands
- Request
- Please create a map indicating all the channels of the Hawaiian Islands using maps of the island chain found on commons:Category:Maps of Hawaii. The result should look something like this. -- KAVEBEAR ( talk) 16:26, 3 June 2015 (UTC)
- Graphist opinion(s)
![]() Request taken by
Houdinipeter (
talk) 23:17, 23 April 2016 (UTC).
Request taken by
Houdinipeter (
talk) 23:17, 23 April 2016 (UTC).
Warning I'm beginner editor of Wikipedia, and I need the help of a high-ranking member who knows how to create a map and who has knowledge of historical China especially Ming Empire. As you can deduce from my words yes I'm intent on creating a Ming Empire, with provinces and prefectures(smaller districts). This map may take you some toll, I will provide with the resources and what the map looks like of course as part of resources exchange. Maybe even a team can work together.
Alexis Ivanov (
talk) 21:10, 13 June 2015 (UTC)
- Welcome and we all learn all the time from each other. First it would be good if you used the "—New request—" link at the top of the page as that gives us all the code within a request that we need during the work with it. So please se if you can correct that.
- I don't really understand what you mean by a "high-ranking member", maybe you mean experienced? It seems like you want to create a map which will be comprehensive in many aspects and will have to be planned thoroughly. I don't really know if you will be able to find a graphic worker who also has knowledge of "historical China especially Ming Empire", sounds like it will be hard.
- I have zero knowledge of the subject but if you can't find any graphic worker with that knowledge you can contact me as it sounds like an interesting project, thanks. -- Goran tek-en ( talk) 15:13, 14 June 2015 (UTC)

- Article(s)
- British Empire, British Empire in World War II
- Request
- Could someone please create a new map of the British Empire as it was in 1945, using the above map, which shows all colonial Empires after WWII, as a guide.
User:Snow Lion Fenian — Preceding unsigned comment added by 5.134.90.140 ( talk) 17:50, 15 June 2015
- Graphist opinion(s)

- Article(s)
- Irish League 1890-91
- Request
- Is it possible to have a map like this one, but treating Ireland pre-1921, i.e. showing the six NI counties and without showing the border? Mooretwin ( talk) 14:56, 16 June 2015 (UTC)
- Graphist opinion(s)


Will one of these, already on Commons, do? If you like I can make a version with the six counties recoloured to match the others. And I can make the sea and lakes blue. Maproom ( talk) 15:47, 17 June 2015 (UTC)
- Yes, I think the first one would work well with the six counties recoloured as you suggest. Many thanks. Mooretwin ( talk) 09:07, 18 June 2015 (UTC)

![]() Done
Done
We have found that this does not work. The requested map needs, I think, to be associated in some way with the "Location map" template. I have no idea how to do this, or even if it is possible. Can anyone advise? Maproom ( talk) 09:02, 19 June 2015 (UTC)
- @
Maproom: To use the Location map template you need to know the top left and bottom right coordinates of the area under the map. It's then a fairly simple process to create the necessary files. Cheers,
Philg88 ♦
talk 10:05, 19 June 2015 (UTC)
- How do we get those coordinates?
194.32.31.1 (
talk) 08:41, 23 June 2015 (UTC)
- That's the hard part. You could export a new map from
OpenStreetMap and use some other GIS tools to create the map.
Philg88 ♦
talk 11:27, 23 June 2015 (UTC)
- Jeez. That's well beyond my capability. Can anyone help? 194.32.31.1 ( talk) 08:11, 24 June 2015 (UTC)
- That's the hard part. You could export a new map from
OpenStreetMap and use some other GIS tools to create the map.
Philg88 ♦
talk 11:27, 23 June 2015 (UTC)
- How do we get those coordinates?
194.32.31.1 (
talk) 08:41, 23 June 2015 (UTC)
-
 US states by religiosity

- Article(s)
- Christianity in the United States, List of U.S. states by religiosity, Religion in the United States
- Request
- The color scheme, from red to yellow to green, is hard for me to understand due to colorblindness; Maine and Mississippi look rather similar to me, and Connecticut and Kentucky are identical. Could you switch the color scheme, perhaps something like red to yellow to dark blue? No point in retaining the "No data" option, since every state has data here. Nyttend ( talk) 23:34, 18 June 2015 (UTC)
- Graphist opinion(s)
- Near the start of the SVG source is the following element:
  <style
     type="text/css"
     id="style3">
    .gt54  { fill: #ff0000; } /* gt 54% */
    .gte50 { fill: #ff6600; } /* 50%-54% */
    .gte45 { fill: #ff9400; } /* 45%-49% */
    .gte40 { fill: #fec500; } /* 40%-44% */
    .gte35 { fill: #ffff00; } /* 35%-39% */
    .gte30 { fill: #8cc700; } /* 30%-34% */
    .gte25 { fill: #0fad00; } /* 25%-30% */
    .lt25  { fill: #00a3c7; } /* lt 25% */
    .na    { fill: #999999; } /* no data */
  </style>
These nine fill: values represent the nine colours respectively, so it's a simple matter of adjusting the ones that are less distinguishable. The first and last can probably stay the same, and the eighth probably can too, so six replacement colours need to be chosen. All other colours (both fill and stroke) in the drawing are blacks and greys, which need not be altered. --
Redrose64 (
talk) 10:43, 19 June 2015 (UTC)
- apparently there is a standard palette that is color-blind unambiguous. Search Color Universal Design (CUD) then jfly.iam.u-tokyo etc, about 4/5ths of the way down, and several other places. If I wre loading this I would resort the numbers from dark to light to indicate %-sequences. Benjamin Trovato ( talk) — Preceding undated comment added 15:03, 19 June 2015 (UTC)
![]() Request taken by
Goran tek-en (
talk) 18:41, 7 July 2015 (UTC).
Request taken by
Goran tek-en (
talk) 18:41, 7 July 2015 (UTC).
- @
Nyttend: Have a look
at this draft. According to color brewer this should be OK for color blind people. If not then we will have to use different patterns, give me feedback, thanks. --
Goran tek-en (
talk) 19:25, 8 July 2015 (UTC)
- That's easy. It's just a lighter-to-darker scheme; presumably even a
monochromat would be able to understand it.
Nyttend (
talk) 19:30, 8 July 2015 (UTC)
- I don't understand what you mean "That's easy" because then you maybe can do it by yourself.
- Normally one recommends not more than five steps to make a really true map for everyone to be able to view. This scheme is as close to a monochromatic as you can get but instead with blue color, no real difference. Also you didn't give me any feedback on my draft. Please just tell me if it works or not. --
Goran tek-en (
talk) 19:43, 8 July 2015 (UTC)
- That was the feedback. I meant that it's easy to understand your draft, so easy that monochromats (people who can't see any color at all, who see everything in various shades of grey) could still understand it.
Nyttend (
talk) 19:45, 8 July 2015 (UTC)
- @
Goran tek-en: I notice that you didn't adjust the colour values in the
<style>...</style>element (as I suggested at 10:43, 19 June 2015), instead you left those alone and added afill:property to every separate shape. This makes it much more difficult to change the colours in future. -- Redrose64 ( talk) 20:13, 8 July 2015 (UTC)- @
Nyttend: I'm sorry for misunderstanding you, my apologies. Do you want this to be uploaded as a new file or replacing the other one. If you want it uploaded as a new I will need the following;
- Name of the file
- Description
- Category/ies at commons
- to be able to upload it at commons. -- Goran tek-en ( talk) 08:15, 9 July 2015 (UTC)
- @
Nyttend: I'm sorry for misunderstanding you, my apologies. Do you want this to be uploaded as a new file or replacing the other one. If you want it uploaded as a new I will need the following;
- @
Goran tek-en: I notice that you didn't adjust the colour values in the
- That was the feedback. I meant that it's easy to understand your draft, so easy that monochromats (people who can't see any color at all, who see everything in various shades of grey) could still understand it.
Nyttend (
talk) 19:45, 8 July 2015 (UTC)
- I don't understand what you mean "That's easy" because then you maybe can do it by yourself.
- That's easy. It's just a lighter-to-darker scheme; presumably even a
monochromat would be able to understand it.
Nyttend (
talk) 19:30, 8 July 2015 (UTC)
- @
Nyttend: Have a look
at this draft. According to color brewer this should be OK for color blind people. If not then we will have to use different patterns, give me feedback, thanks. --
Goran tek-en (
talk) 19:25, 8 July 2015 (UTC)
@
Redrose64: I'm that type of graphic worker who prefer to work with what I see and in Inkscape, so to me my way is easier. I do understand your point that it could be easier to edited in a text editor your way, but I need to see things, and search-replace works also. I'm trying to do stuff in the code and I will of course learn more as time goes but so far it's harder for me. --
Goran tek-en (
talk) 08:23, 9 July 2015 (UTC)
![]() Done
Done
-
 Moskva River within the Volga watershed

- Article(s)
- Moskva River
- Request
Hi, I would like to request that a label "Moscow Canal", in blue text, be added to this map (the canal is mentioned in the caption at Moskva River, but not actually marked). The Moscow Canal is the short waterway running approximately north from Moscow to the Volga River. At the same time, I would like to request that the canal symbol (short blue 'ticks') is made more obvious. At normal viewing scale it is very faint and virtually indistinguishable from a river. Thanks! — Preceding unsigned comment added by 31.51.134.46 ( talk) 20:30, 22 June 2015
- Graphist opinion(s)
Who is requesting this, you didn't sign and therefore I guess you wont get much help. -- Goran tek-en ( talk) 19:22, 8 July 2015 (UTC)
- I wasn't aware that only people with accounts could make requests here.
109.153.245.25 (
talk) 19:39, 12 July 2015 (UTC)
- Anyone can make requests here, registered user or not. What Goran tek-en means is that the person who made the original request didn't sign their post. -- Redrose64 ( talk) 07:55, 13 July 2015 (UTC)
- I wasn't aware that only people with accounts could make requests here.
109.153.245.25 (
talk) 19:39, 12 July 2015 (UTC)
- I just did this in Windows Paint, but it's possible that someone else might want to do it in a prettier fashion.
Nyttend (
talk) 14:22, 9 July 2015 (UTC)
- Thanks for your efforts. The label should be blue, as I mentioned. I realise there is very little space, but the canal symbol does not look great, to be perfectly honest. Also the colour looks different from the other blues. 109.153.245.25 ( talk) 19:39, 12 July 2015 (UTC)
Map of the Migrations of the Alans
- Article(s)
- Alans
- Request
- I find the colors a little confusing in this map. The legend mentions yellow for areas where Alans settled, red [lines] for routes taken by civilians, and orange [lines] for military excursions. However, one of the red lines, the shorter one below the long one, looks a little orange, and the short, thin lines proceeding from the yellow settlement areas look too yellow to be called orange. Is there any way to make the military excursions look truly orange and the red lines to look really red? I presume the military excursions are the pale orange-yellow ones proceeding from the yellow settlement areas, but I'm not sure. Perhaps if one or both lines were another color, such as blue or purple, there would be no possibility of confusion. CorinneSD ( talk) 22:36, 29 June 2015 (UTC)
- Graphist opinion(s)
@
CorinneSD: It's very hard to do something very good on that bitmap image, a lot of work and we still have a low resolution jpg.
I suggest that we make a svg version of this map instead. I have found a base map that is also topographic if you want that but maybe it's OK to use a flat base map, it's up to you. If you want this, contact me and I will help you. You have to contact me directly as the watch and ping doesn't work all the time for me, thanks. --
Goran tek-en (
talk) 18:23, 25 July 2015 (UTC)
- Article(s)
- Irish League 1890-91
- Request
- This map was kindly created as a .jpg, but as I need to plot locations on it, apparently it needs to be .svg. Can the map be converted to .svg? Mooretwin ( talk) 15:56, 30 June 2015 (UTC)
- Graphist opinion(s)
- Converting JPEG to SVG is fraught with many problems, not least of which is the completely different philosophies (
raster graphics vs
vector graphics). It would be easier, I think, to use one of the existing SVG maps as a starting point, and recolour that. At
the original request, two SVGs were displayed:
File:Ireland trad counties named ga.svg and
File:Counties of the island of Ireland.svg and I think that the second of these would be most suitable. --
Redrose64 (
talk) 16:28, 30 June 2015 (UTC)
- Thank you very much. I agree that the second would be most suitable. However, I attempted to use that map as-is (i.e. with the same colouring), and this is what happened -
Lua error in Module:Location_map/multi at line 13: Unable to find the specified location map definition. Neither "Module:Location map/data/Counties of the island of Ireland" nor "Template:Location map Counties of the island of Ireland" exists. Mooretwin ( talk) 10:07, 2 July 2015 (UTC)
- That error message doesn't mean a fault with the map, it means that the country name "Counties of the island of Ireland" isn't registered with the
{{
location map+}}
suite. It shouldn't be: instead, the first unnamed parameter should stay as|Ireland, with other parameters being used to obtain the map data (name, corner coordinates, etc.) that should be set in{{ Location map Ireland}}. -- Redrose64 ( talk) 16:29, 2 July 2015 (UTC)

- Article(s)
- Cucuteni-Trypillian culture
- Request
- This map is supposed to show the maximum area of settlement of the Cucuteni-Trypillian culture at a certain point in the past. I suppose the thin lines under the colors are outlines of modern countries and either states or provinces within those countries. If one is familiar with those outlines, the countries will be easily recognized, but for readers unfamiliar with the outlines, the map is not very helpful. If the countries could be labeled, and perhaps the outlines of the countries made a little bolder, to distinguish them from the outlines of states/provinces, it would make this map much more informative. — Preceding unsigned comment added by CorinneSD ( talk • contribs) 01:29, 1 July 2015
- Graphist opinion(s)
Who is requesting this, you didn't sign and therefore I guess you wont get much help. -- Goran tek-en ( talk) 19:20, 8 July 2015 (UTC)
-
 Greek Offensive 1940 41 in Northern Epirus
 -
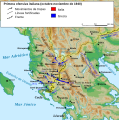 Italo-Grecian War 194101


- Article(s)
- es:Guerra greco-italiana, es:Operación Marita
- Request
- I wonder if it would be possible to replace the raster background in the first map with the vector one from the second map. The maps should match with a bit of rotating, moving and cropping I guess but I do not seem to get it right (and my computer does not have the power for all these manipulations). The goal would be to get a pure vector version of the first map (Greek Offensive 1940 41 in Northern Epirus.svg), getting rid of all raster information and replacing it by vector one. Thank you in advance!-- Rowanwindwhistler ( talk) 11:32, 4 July 2015 (UTC)
- Graphist opinion(s)
![]() Request taken by
Goran tek-en (
talk) 18:12, 8 July 2015 (UTC).
Request taken by
Goran tek-en (
talk) 18:12, 8 July 2015 (UTC).
@
Rowanwindwhistler: The two maps was really different and VERY hard to make them fit each other. Insteed I did a trace on the image in the first svg so have
a look at this draft. It's by no means perfect but otherwise I will have to redo the whole thing and that is something else. Have a look and give me feedback, thanks. --
Goran tek-en (
talk) 19:18, 8 July 2015 (UTC)
- @
Goran tek-en:. It looks good to me. If possible and if does not entail too much effort, it would be nice to turn the river lines into actual lines (now they seem to have changing thickness, probably by the way they were generated), provided that does not break the topographic data underneath. If it does or that would need too much effort, it can be left as it is. Thank you!--
Rowanwindwhistler (
talk) 05:15, 9 July 2015 (UTC)
- @
Rowanwindwhistler: I did think the same so now I have made a new version
with rivers as lines so you can compare it to the other one.
- I had to draw them by hand and remove the previous stuff but it at the same time took away some other parts, so look and see.
- When done how do you want it upload, over the other or as new version? If as new version I will need the following;
- Name of the file
- Description
- Category/ies at commons
- to be able to upload it at commons. --
Goran tek-en (
talk) 17:13, 13 July 2015 (UTC)
- @ Goran tek-en: it looks better to me. I would rather leave the old map in place just in case someone wants to use it for some reason and upload the new pure SVG version as a separate file. I think it can be called simply "Greek Offensive 1940 41 in Northern Epirus-2.svg" with the same description and categories as the older version. Thank you!-- Rowanwindwhistler ( talk) 20:00, 14 July 2015 (UTC)
- @
Rowanwindwhistler: I did think the same so now I have made a new version
with rivers as lines so you can compare it to the other one.
@
Rowanwindwhistler: Now you can find it here:
Greek Offensive 1940 41 in Northern Epirus-2. --
Goran tek-en (
talk) 19:04, 15 July 2015 (UTC)
![]() Done --
Goran tek-en (
talk) 19:04, 15 July 2015 (UTC)
Done --
Goran tek-en (
talk) 19:04, 15 July 2015 (UTC)
-
 This image shows the campaigns of Abu al-Dahab and depicts Daher el-Omar's sheikhdom limited to the Galilee. Prior to Abu al-Dahab's 1774 campaign (depicted by the brown arrows), Daher's actual control extended from Gaza to Beirut.
 -
Description of second image (if needed)
-
Description of third image (if needed; don't request too many at once, though)

- Article(s)
- Daher el-Omar
- Request
A map that shows the maximum extent of Daher el-Omar's autonomous sheikhdom in 1744. At its peak, Daher's sheikhdom included parts of modern-day Israel, Palestine, Lebanon, Jordan and to a lesser extent Syria. Specifically it included the coastal plain from Gaza to Beirut (length) and Jaffa to Ramla (width), the whole Galilee, Jezreel Valley and Jabal Amil ( South Governorate and Nabatieh Governorate minus Hasbaya District), Jabal Ajlun ( Ajlun Governorate and Irbid Governorate). It also included nominal, but not actual control of Jerusalem and Nablus and their respective districts i.e. central Israel/Palestine. The latter could be reflected in the map or excluded completely.
Major localities that were actually part of the sheikhdom that need to be denoted include the following: Gaza, Jaffa, Ramla, Acre, Haifa, al-Tantura, Shefa-'Amr, Deir Hanna, Arraba, Khirbat Jiddin, Tiberias, Nazareth, Safad, Irbid, Ajlun, Beirut, Sidon, Tyre and Tibnin. Other localities significant to the sheikhdom, but to a lesser degree are Bi'ina, Saffuriya, Deir al-Qassi, al-Bassah, Yaroun, Abu Snan, Tira, Qaqun, I'billin, Tarbikha and Suhmata. Places of significance but outside Daher's actual control in 1774 include Nablus, Jerusalem, Sanur and Damascus. The map should zoom, in so to speak, on the Levant, but also highlight the territory of the Ottoman Empire and perhaps its increasingly autonomous Egypt Eyalet province.
There are no maps out there showing the maximum extent of Daher's control or few if any that show his longtime control of the Galilee. In my opinion, the map would add incredible value to the subject's article (which I intend to nominate for GA soon) and for any readers interested in the subject who would be able to have a better idea of Daher's autonomous sheikhdom. The information I have listed above is derived by the reliable sources used in the subject article, in particular Thomas Phillipp's Acre: The Rise and Fall of a Palestinian City, 1730-1831 and Ahmad Hasan Joudah's Revolt in Palestine in the Eighteenth Century: The Era of Shaykh Zahir Al-ʻUmar. Other sources could be provided to further confirm this information. -- Al Ameer ( talk) 19:02, 5 July 2015 (UTC)
- Graphist opinion(s)
![]() Request taken by
Goran tek-en (
talk) 17:46, 14 July 2015 (UTC). @
Al Ameer son: But I will help from you through out this as there are many things I have no knowledge of. --
Goran tek-en (
talk) 17:46, 14 July 2015 (UTC)
Request taken by
Goran tek-en (
talk) 17:46, 14 July 2015 (UTC). @
Al Ameer son: But I will help from you through out this as there are many things I have no knowledge of. --
Goran tek-en (
talk) 17:46, 14 July 2015 (UTC)
- @
Goran tek-en: Absolutely. Let me know whatever information you may need that's not listed above. --
Al Ameer (
talk) 18:01, 14 July 2015 (UTC)
- @
Al Ameer son: First we have to determine the maximum area which the map should hold, is this
the maximum area? If not can you tell me where to add or remove, thanks. --
Goran tek-en (
talk) 18:08, 14 July 2015 (UTC)
- @
Goran tek-en: Could we zoom in more on the
Levant (Israel/Palestine, Syria, Lebanon and Jordan)? --
Al Ameer (
talk) 18:53, 14 July 2015 (UTC)
- @
Al Ameer son: The link for Levant shows different areas so it's hard to know exactly which you want.
Look at this draft and tell me if the red or blue area is what you want or something else, thanks. Maybe you have to reload the page to get the new image. --
Goran tek-en (
talk) 18:42, 15 July 2015 (UTC)
- @
Goran tek-en: The blue square is good, but could we move it a bit more to the west to include more of
Egypt? --
Al Ameer (
talk) 16:58, 16 July 2015 (UTC)
- @
Al Ameer son:
Look at this draft and give me feedback on the area, blue or read. If you can make a screenshot or something and draw the area you want it would go faster. --
Goran tek-en (
talk) 13:10, 19 July 2015 (UTC)
The red square is perfect. -- Al Ameer ( talk) 16:34, 19 July 2015 (UTC)@ Goran tek-en: Actually, considering the fact that there probably won't be enough room to label all of his principal headquarters in the Galilee, I've reduced the maximum area. See the yellow box here. -- Al Ameer ( talk) 00:37, 20 July 2015 (UTC)- @
Al Ameer son:I had to redraw the map because is was not accurate enough for this. I have now added all the different locations but all the names have not been worked with so they way they are shown will change,
it's a draft.
- In this draft I have both areas and if we go for the yellow you will loose one place.
- I have no idea of how to understand the extent/borders of Daher el-Omar empire. You will have to tell me or show me a map/drawing. Remember that I have zero knowledge of this, thanks. -- Goran tek-en ( talk) 19:09, 23 July 2015 (UTC)
- @ Goran tek-en: I've drawn up a rough estimation of Daher's domain (See Here) i.e. the areas under his actual (in green) or nominal (in red) control in 1774. The yellow square is fine (the excluded town is al-Bassa, located between Tyre and Acre, not al-Bassali). I could see that the towns are cluttered up, however. Therefore, I think it's best if we limit the towns to those that served as his headquarters ( Tiberias, Acre, Nazareth, Arraba and Deir Hanna), major towns ( Haifa, Jaffa, Ramla, Sanur, Tantura, Gaza, Jerusalem, Nablus, Irbid, Sidon, Beirut, Damascus and Tibnin). That would mean the removal of Shefa-'Amr, Saffuriya, Yaroun, al-Bassa, Tira, Ajlun, Khirbat Jiddin, Abu Snan, Bi'ina, Tarbikha, Deir al-Qassi, Suhmata, Tyre and Qaqun. -- Al Ameer ( talk) 21:14, 23 July 2015 (UTC)
- @
Al Ameer son:I had to redraw the map because is was not accurate enough for this. I have now added all the different locations but all the names have not been worked with so they way they are shown will change,
it's a draft.
- @
Al Ameer son:
Look at this draft and give me feedback on the area, blue or read. If you can make a screenshot or something and draw the area you want it would go faster. --
Goran tek-en (
talk) 13:10, 19 July 2015 (UTC)
- @
Goran tek-en: The blue square is good, but could we move it a bit more to the west to include more of
Egypt? --
Al Ameer (
talk) 16:58, 16 July 2015 (UTC)
- @
Al Ameer son: The link for Levant shows different areas so it's hard to know exactly which you want.
Look at this draft and tell me if the red or blue area is what you want or something else, thanks. Maybe you have to reload the page to get the new image. --
Goran tek-en (
talk) 18:42, 15 July 2015 (UTC)
- @
Goran tek-en: Could we zoom in more on the
Levant (Israel/Palestine, Syria, Lebanon and Jordan)? --
Al Ameer (
talk) 18:53, 14 July 2015 (UTC)
- @
Al Ameer son: First we have to determine the maximum area which the map should hold, is this
the maximum area? If not can you tell me where to add or remove, thanks. --
Goran tek-en (
talk) 18:08, 14 July 2015 (UTC)
@ Al Ameer son: Now there is a new draft for you to look at and give me feedback on. In this draft I haven't removed any localities but edited other stuff. Have a look at it and if you still want me to remove the localities above I will of course do so but it didn't feel so good to remove those places as I guess they are important to the map. -- Goran tek-en ( talk) 15:29, 25 July 2015 (UTC)
- @ Goran tek-en: The map is shaping up nicely. I've uploaded this draft with requested changes. The requested changes are the following:
- Elimination of the localities that have been erased (i.e. Shefa-'Amr, Saffuriya, Yaroun, al-Bassa, Tira, Ajlun, Khirbat Jiddin, Abu Snan, Bi'ina, Tarbikha, Deir al-Qassi, Suhmata, Tyre and Qaqun)
- The labeling of all other localities remaining on the map instead of the legend, including Damascus, Jerusalem, Nablus and Sanur. The change in color from white to black for the following localities: Irbid, Ajlun, Haifa, Tantura, Jaffa, Gaza, Ramla, Sidon, Tyre, Tibnin, Safad and Beirut. The following should be kept white and denoted in the legend as "Zahir's seats of power": Acre, Nazareth, Tiberias, Arraba and Deir Hanna.
- The modern-day (2015) borders should be replaced by the Ottoman provincial boundaries of the 18th century, which I drew in red. The three provinces that should be labeled are Sidon Eyalet, Damascus Eyalet and Egypt Eyalet.
- The Hauran, Jabal Amil, Mount Lebanon, Jabal Nablus and Galilee geographic regions should be mentioned in italics. I added them to the draft but you could adjust the style to however you see fit.
- Some form of stripe shading should be applied to the territory of Zahir's vassal, Sheikh Nasif al-Nassar. I highlighted the area in green. -- Al Ameer ( talk) 20:36, 25 July 2015 (UTC)
- It would had been great if you told me about the bordes from the beginning, it would have saved work for me. --
Goran tek-en (
talk) 18:00, 26 July 2015 (UTC)
- @
Goran tek-en: My apologies. To be honest I had not thought of that aspect until I saw your latest draft. --
Al Ameer (
talk) 18:40, 26 July 2015 (UTC)
- @
Al Ameer son: I'm sorry, It just felt like to much for a moment. I do understand that you couldn't see that coming.
-
New draft to look at. With those things;
- First you asked me to eliminate Aljun and then to change the color from white to black, but I just removed it?
- I removed the names Egypt, Israel, Jordan, Syria and Lebanon, was that correct?
- I didn't add the arrows yet, I need some kind of explanation to them. It helps me to shape/form then and for the legend. Give me feedback, thanks. -- Goran tek-en ( talk) 18:49, 27 July 2015 (UTC)
- @ Goran tek-en: Everything you just mentioned above is fine and thank you for your patience. I understand this is not a region you're very familiar with. The arrows were not meant to be included in the final map. I only added them to give you a better idea about the areas that those geographic regions covered. All the critical aspects are finished, all that remains are some style adjustments: The font and color of the geographic names and provinces should be more distinct from each other, but if this is too time-consuming then no big deal. Could the Mount Lebanon, Galilee and Jabal Amil geographic regions appear vertically/diagonally as depicted in my Revised Draft. And finally, "Daher el-Omar" should be replaced with "Zahir al-Umar" in the map's title due to the article's recent name change. The map should be all set after that. -- Al Ameer ( talk) 20:42, 27 July 2015 (UTC)
- @
Al Ameer son:
New draft to look at. I'm not to keen on putting names diagonally as it reduces the readability. Look at my draft and see if that's OK. As I don't really understand what areas is meant by the Geographic regions respectively Provinces names it's hard for me to place them more correct. If you want we can add some very thin shades to show them.
- Actually I have spent quite some time in that area but it was not during that time span...
- When we are done I will need the following;
- Name of the file
- Description
- Category/ies at commons
- to be able to upload it at commons. Give me feedback, thanks. -- Goran tek-en ( talk) 17:35, 29 July 2015 (UTC)
- @
Al Ameer son: I'm sorry, It just felt like to much for a moment. I do understand that you couldn't see that coming.
- @
Goran tek-en: My apologies. To be honest I had not thought of that aspect until I saw your latest draft. --
Al Ameer (
talk) 18:40, 26 July 2015 (UTC)
- It would had been great if you told me about the bordes from the beginning, it would have saved work for me. --
Goran tek-en (
talk) 18:00, 26 July 2015 (UTC)
@ Goran tek-en: The map looks great.
- File name: Zahir al-Umar maximum extent map
- Description: The maximum extent (actual and nominal) of the autonomous sheikh Zahir al-Umar's sheikhdom within the Ottoman Empire in 1774.
- Categories: "Daher el-Omar", "Maps of the Ottoman Empire in the 18th-century", "Maps of Ottoman Levant", "Ottoman period in Palestine", "Lebanon under Ottoman rule". -- Al Ameer ( talk) 18:44, 29 July 2015 (UTC)
- Now you can find it here
Zahir al-Umar maximum extent map
![]() Done --
Goran tek-en (
talk) 17:55, 30 July 2015 (UTC)
Done --
Goran tek-en (
talk) 17:55, 30 July 2015 (UTC)

- Article(s)
- Alor Island
- Request
- It took me a while to find Alor Island on this map. It's way up in the upper right-hand corner. Also, some readers may not be familiar with the other islands, so even if they see the island labeled "Alor", they may not be able to visualize where Alor is. I'm wondering if someone could find or create a map that shows the island of Alor more toward the center of the map and that includes slightly more of the surrounding islands. CorinneSD ( talk) 17:52, 18 July 2015 (UTC)
- Graphist opinion(s)
- Article(s)
- Irish League 1890-91
- Request
- I wish to use the map below to plot locations, but when I do. this happens:
Lua error in Module:Location_map/multi at line 13: Unable to find the specified location map definition. Neither "Module:Location map/data/Counties of the island of Ireland" nor "Template:Location map Counties of the island of Ireland" exists.
- I'm advised that "the first unnamed parameter should stay as
|Ireland, with other parameters being used to obtain the map data (name, corner coordinates, etc.) that should be set in{{ Location map Ireland}}". Unfortunately I don't understand what this means. Can anyone help? Mooretwin ( talk) 09:20, 21 July 2015 (UTC)
- Graphist opinion(s)
- {{ Location map Ireland}} uses a different map - Ireland location map.svg - not the one you're trying to use. For future reference, this isn't the right place to ask questions about template usage - we make maps according to requests. Next time I suggest you ask at the Help Desk. Philg88 ♦ talk 14:59, 26 July 2015 (UTC)
I'd like to create some river maps for Papakating Creek (with tributaries and watershed) and Neepaulakating Creek, a mountain map for Kittatinny Mountain amongst other landforms in northwestern New Jersey that I'll be working on going forward (drafts being sandboxed). If someone from this project would help me with creating those three--I mean teach me as you do them--I'd be glad to learn how to make maps and maybe if I get the hang of it (I tend to be a quick study) assist in aiding this project and any backlog of requests. Look forward to hearing from you. JackTheVicar ( talk) 14:57, 26 July 2015 (UTC)
- Do you have any suitable sources for these maps? You also need to use the {{
Reqmap}} template for your request.
Philg88 ♦
talk 15:02, 26 July 2015 (UTC)
- It would be nice if that template had instructions for its use...a template page without clear or sufficient instruction to aid a novice is counterproductive. I think USGS/GIS has suitable source material but I'm not sufficiently familiar yet with those systems to know better.
JackTheVicar (
talk) 14:48, 27 July 2015 (UTC)
- Use the --New Request-- link at the top of the page (in the darker green area) and that will provide us with all the code we need to be able to complete a request. Click on it and copy the code to your request is what you can do on this one. -- Goran tek-en ( talk) 18:58, 27 July 2015 (UTC)
- It would be nice if that template had instructions for its use...a template page without clear or sufficient instruction to aid a novice is counterproductive. I think USGS/GIS has suitable source material but I'm not sufficiently familiar yet with those systems to know better.
JackTheVicar (
talk) 14:48, 27 July 2015 (UTC)
-
 Cairo-Cape Town Highway

- Article(s)
- Cape to Cairo Road
- Request
- please update the map as there is a new land port opened between Egypt ans Sudan 1 -- Mohamed Ouda ( talk) 10:36, 28 July 2015 (UTC)
- Graphist opinion(s)
- Article(s)
- Pōmare Dynasty
- Request
- Please recreate a non-copyrighted version of this map of Cimetière royal des Pomare d’Arue found here http://www.tahitiheritage.pf/wp-content/uploads/2013/08/arue-cimetiere-pomare-emplacement-tombes.jpg ?-- KAVEBEAR ( talk) 18:47, 29 July 2015 (UTC)
- Graphist opinion(s)

- Article(s)
- Golden jackal & African golden wolf
- Request
- Recent studies show that African "golden jackals" are a separate species from those in Eurasia. In order to reflect this new discovery, there need to be two new maps separating the African/Eurasian ranges. — Preceding unsigned comment added by Mariomassone ( talk • contribs) 11:04, 8 August 2015
- Graphist opinion(s)
Who is requesting this, please sign. Can you also please provide a link for that new knowledge, thanks. -- Goran tek-en ( talk) 15:45, 9 August 2015 (UTC)
- Apologies, my signature is Mariomassone ( talk) 08:05, 10 August 2015 (UTC), and the information is from http://www.cell.com/current-biology/abstract/S0960-9822%2815%2900787-3.
![]() Request taken by
Goran tek-en (
talk) 18:02, 10 August 2015 (UTC).
Request taken by
Goran tek-en (
talk) 18:02, 10 August 2015 (UTC).
- @ Mariomassone: Now you can look at the two drafts:
- and give me feedback on them, thanks. --
Goran tek-en (
talk) 19:00, 12 August 2015 (UTC)
- The African range is perfect. The Eurasian one just needs to also include north east Italy, as shown
here.
Mariomassone (
talk) 07:04, 13 August 2015 (UTC)
- @
Mariomassone:
Check this draft for eurasian and give me feedback, thanks.
- Eventually I will need the following for both of the files;
- Name of the file
- Description
- Category/ies at commons
- to be able to upload it at commons. -- Goran tek-en ( talk) 17:19, 16 August 2015 (UTC)
- @
Mariomassone:
Check this draft for eurasian and give me feedback, thanks.
- The African range is perfect. The Eurasian one just needs to also include north east Italy, as shown
here.
Mariomassone (
talk) 07:04, 13 August 2015 (UTC)
- Excellent work;
- Canis_aureus_range (for Eurasian), Canis_anthus_range (for African)
- Current range of golden jackal (for Eurasian), Current range of African golden wolf (for African)
- Canis aureus (for Eurasian), Canis anthus (for African), Canidae distribution maps (for both)
- Once again, great job! Mariomassone ( talk) 21:58, 16 August 2015 (UTC)
- Excellent work;
@ Mariomassone: Now you can find them here;
![]() Done --
Goran tek-en (
talk) 18:55, 19 August 2015 (UTC)
Done --
Goran tek-en (
talk) 18:55, 19 August 2015 (UTC)
-
 Original nine-region map
 -
 New seven-region map


- Article(s)
- Municipalities of Yucatán + all 106 individual articles
- Request
- The number of regions has changed from 9 to 7. Belle has changed the table in the article to reflect that based on the original source new region designations (near the bottom of the page) Should be a fairly easy fix, but I have no skill to do it. Thank you! SusunW ( talk) 14:18, 10 August 2015 (UTC)
- Graphist opinion(s)
![]() Done, see above. But I recommend not using it for a week or so, as it may get deleted because I've done the bureaucracy wrong. Also, what I have created is a .png not a .svg, which some editors will disapprove.
Maproom (
talk) 16:13, 10 August 2015 (UTC)
Thank you!
SusunW (
talk) 16:27, 10 August 2015 (UTC)
Done, see above. But I recommend not using it for a week or so, as it may get deleted because I've done the bureaucracy wrong. Also, what I have created is a .png not a .svg, which some editors will disapprove.
Maproom (
talk) 16:13, 10 August 2015 (UTC)
Thank you!
SusunW (
talk) 16:27, 10 August 2015 (UTC)
- A DYK nomination for 14 of the municipalities was finally approved and I'd like to have the correct map on them all before they hit the front page. Is there any possible way we could use it sooner? SusunW ( talk) 17:56, 10 August 2015 (UTC)
-
Description of first image
-
Description of second image (if needed)
-
Description of third image (if needed; don't request too many at once, though)
- Article(s)
- [[]]
- Request
- Hey. For /info/en/?search=Trigana_Air_Service_Flight_267, can someone create a map showing the flight path and the wreckage site? The details are in the page -- FelixSeba7 ( talk) 14:44, 16 August 2015 (UTC)
- Graphist opinion(s)
- @ FelixSeba7:, I noticed that File:Trigana Air Service Flight 257.jpg was uploaded shortly after your request. Has this fulfilled your request? Jolly Ω Janner 04:12, 7 November 2015 (UTC)
-
 Description of first image
 -
 Description of second image (if needed)
 -
Description of third image (if needed; don't request too many at once, though)


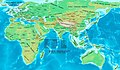
- Article(s)
- Kara-Khanid Khanate
- Request
- The first map urgently needs to be fixed. It contains a blatant historical error. Uyghurs and Kara-Khanids had two different states and did not live in the same state. The second maps portrayal of the Uyghur and Karakhanids is correct- only if it were transferred to the first map. In itself, the second map is also wrong and needs to be desperately fixed, because the Kingdom of Khotan existed at that time and was not part of the Kara-Khanids. … -- Rajmaan ( talk) 02:57, 24 August 2015 (UTC)
- Graphist opinion(s)
-
Description of first image
-
Description of second image (if needed)
-
Description of third image (if needed; don't request too many at once, though)
- Request
- Like the article for the previous competition, there needs to be a location map for Loto-Tonga Soka Centre, as there is for National Soccer stadium in 2014. To remain consistent, can we have same style etc.? Also, Loto-Tonga Soka Centre is in Nuku'alofa, so if you can't find it just put a point for Nuku'alofa. -- This is Mkbw50 signing out! 14:41, 31 August 2015 (UTC)
- Graphist opinion(s)
![]() Done @
Mkbw50:, I couldn't find data for the capacity of stadium, so left it as a hidden comment to later be filled in. An additional point to consider would be that the location map creates a lot of white space. If the article is not going to use an infobox, the map could be positioned there.
Jolly
Ω
Janner 20:35, 5 November 2015 (UTC)
Done @
Mkbw50:, I couldn't find data for the capacity of stadium, so left it as a hidden comment to later be filled in. An additional point to consider would be that the location map creates a lot of white space. If the article is not going to use an infobox, the map could be positioned there.
Jolly
Ω
Janner 20:35, 5 November 2015 (UTC)
-
 Map of Romance dialects
 -
 Map of Germanic dialects


- Article(s)
- Romance languages, Germanic languages
- Request
- Requesting for vector maps of Romance and Germanic dialects. Additional information for Romance dialects can be found here: Iberia and Southern France, Portuguese, Spain ( Castilian), France ( langues d'oïl), Occitano-Romance ( Occitan, Catalan), Italy ( 1, 2), Rhaeto-Romance, Eastern. Additional information for Germanic dialects can be found here: West Germanic, Upper German and High Franconian ( Alemannic, Bavarian), Central German, Low German and Low Franconian ( Dutch). -- Article editor ( talk) 19:52, 8 September 2015 (UTC)
- Graphist opinion(s)
Hi there, I need help with a historical map which can be seen here:

Basically, we need to update this map, changing the Byzantine eastern frontier so that it matches the line shown here:

I've already uploaded a rough version that I made myself, which shows what I want, but I need someone with a more 'professional' hand to do it properly and make it look nice. My rough version can be seen here:

It is for the 'Byzantium under the Palaiologoi' article on Wikipedia. I really need someone who has good map skills to help with this. Thanks! Bigdaddy1204 ( talk) 16:23, 10 September 2015 (UTC)

- Request
- The current image is difficult to read and becomes grainy in articles. It'd be if someone could make an SVG without the bottom text so that this could be added as a caption.
- P.S. Ping me with {{ Ping}} and I will be here much quicker!
- -- CFCF 🍌 ( email) 21:17, 10 September 2015 (UTC)
- Graphist opinion(s)
- @
CFCF: I'd be interested in taking this on, but before I do, I'd like to check whether there is a more recent map or data. A quick look at
List of countries by literacy rate shows some data that could be used. I'm wondering whether it may be easier to use that data and render the current map redundant. Do you have any thoughts? I haven't been able to find the data on WomanStats.
Jolly
Ω
Janner 03:11, 31 October 2015 (UTC)
- I've made File:World map of countries by difference in gender literacy rate.svg, which I think is an improvement to the old one in all aspects. Would you like to hear your thoughts, @ CFCF:. Jolly Ω Janner 05:59, 3 November 2015 (UTC)
![]() Done—Looks amazing. Live.
CFCF
💌
📧 11:04, 11 January 2016 (UTC)
Done—Looks amazing. Live.
CFCF
💌
📧 11:04, 11 January 2016 (UTC)
This is a call for technical assistance upgrading an orthographic map in an .svg format [File:USA orthographic.svg].
A discussion at Talk:United States#which map should we use? has led to the conclusion that the map in use from Wikicommons, [1] should be upgraded to include Puerto Rico using color #C6DEBD, representing “Other areas part of the same political unity”, as sourced at U.S. State Department, Common Core Document to U.N. Committee on Human Rights, December 30, 2011, Item 22, 27, and agreed to in a Request for Mediation and supported by a Request for Comment consensus on the Talk page with inputs from Politics, government and law. Geography. and the United States wiki communities.
The introductory sentence has been edited to read, "The United States of America (USA), ... is a federal republic composed of 50 states, a federal district, five major territories and various possessions." The map does not depict all insular territories, but Puerto Rico alone comprises 90% of their population, so it is useful in locating the United States territory in the Caribbean Sea, which the present version does not. There is also some expressed concern about the border and background conforming to standard. TheVirginiaHistorian ( talk) 07:11, 18 September 2015 (UTC)
We have scalable ethnic maps for Afghanistan, Pakistan, Iraq – but not for Syria and Somalia. May anyone please help creating them?
Cheers,-- Kopiersperre ( talk) 15:37, 21 September 2015 (UTC)
-
 Somalia
 -
 Syria
Syria -
 Syria and Libanon (1935)


.jpg)
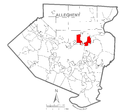
O'Hara Township has 5 non-contiguous pieces
-
 O'Hara Township, Allegheny County, Pennsylvania
 -
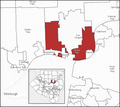 new graphic


- Request
- In
Allegheny County,
O'Hara Township consists of
five non-contiguous areas, with
Sharpsburg,
Aspinwall and
Fox Chapel separating them. See
http://viewer.nationalmap.gov/viewer/?p=default&b=base1&x=-8893566.632940842&y=4939807.880087165&l=13&v=Boundaries%3A4%3B14 . It would be great if there were a zoomed-in map that showed these 5 parts, shaded to show the detail, so that the separation was clear. One of the parts is an island in the river.
Jeff in CA (
talk) 06:03, 28 September 2015 (UTC)
-
Jeff in CA, have you seen
File:Map of O'Hara Township, Allegheny County, Pennsylvania Highlighted.png? Part of the same map series as the Delaware County map you linked, it shows only four pieces, not five, but despite what the article says, I can only find four pieces. If you know the name of the island in question, that would help.
Nyttend (
talk) 19:06, 29 September 2015 (UTC)
- Thank you,
Nyttend, for looking at my request. I did not remember having seen that map, but at some time I think I did see it. You are correct that it does not show the fifth piece, named
Sixmile Island, in the Allegheny River a short distance downstream from the other pieces. One other problem with that map is that it does not show the separation between two of the pieces (that separation is small but quite real). That map makes it appear that they are connected at a point, which they are not. Please let me know if there is any other information I can provide.
Jeff in CA (
talk) 04:44, 30 September 2015 (UTC)
- Note that I'm not a graphist; I saw this while participating in my own request, and I jumped in because I used to live in metro Pittsburgh. At this scale, it's not really going to be practical to separate the tiny gap on Gayasuta Road, because it's literally about fifty feet or less; USGS topo maps at
highest resolution don't show the gap, so you have to pick a different map option and zoom in all the way. If you use the
Allegheny County GIS website, you'll see that it's literally just a single lot that separates the two pieces. Meanwhile, aside from the unsourced bit in the article, do you have any source for Sixmile Island being in O'Hara Township? Everything I'm seeing (whether USGS, Google Maps, or the county GIS) depicts it within Sharpsburg Borough, with the township chunk being largely restricted to the
Highland Park Bridge and ending about 150 feet downstream of
Lock and Dam No. 2.
Nyttend (
talk) 13:05, 30 September 2015 (UTC)
- Thank you. My source for Sixmile Island being in O'Hara Township is this USGS link:
http://viewer.nationalmap.gov/viewer/?p=default&b=base1&x=-8893566.632940842&y=4939807.880087165&l=13&v=Boundaries%3A4%3B14 Click this link, and after the map loads, click the box for the "Minor Civil Division labels" overlay, zoom in on Sixmile Island, wait for the data to finish "Loading", position the cursor on the island and double-click. It should display the word "O'Hara" on the island. (Or, just an extreme zoom-in without clicking should reveal it also.)
Jeff in CA (
talk)
- Also, if you go the Allegheny County GIS map that you linked, and again do an extreme zoom-in, the map changes to an aerial photograph of the island. Click on the island to bring up a text box that states,"Municipality: O'HARA Owner:TOWNSHIP OF O'HARA".
Jeff in CA (
talk) 20:05, 30 September 2015 (UTC)
- Okay, you're clearly right. Thanks for the instructions, because without them, I would still have been thinking you were wrong. I previously used the GIS and clicked on the island and got nothing: all it told me was that it didn't know what parcel I was clicking on, even though I'd clearly clicked on the island, not on the surrounding river. Nyttend ( talk) 21:01, 30 September 2015 (UTC)
- Also, if you go the Allegheny County GIS map that you linked, and again do an extreme zoom-in, the map changes to an aerial photograph of the island. Click on the island to bring up a text box that states,"Municipality: O'HARA Owner:TOWNSHIP OF O'HARA".
Jeff in CA (
talk) 20:05, 30 September 2015 (UTC)
- Thank you. My source for Sixmile Island being in O'Hara Township is this USGS link:
http://viewer.nationalmap.gov/viewer/?p=default&b=base1&x=-8893566.632940842&y=4939807.880087165&l=13&v=Boundaries%3A4%3B14 Click this link, and after the map loads, click the box for the "Minor Civil Division labels" overlay, zoom in on Sixmile Island, wait for the data to finish "Loading", position the cursor on the island and double-click. It should display the word "O'Hara" on the island. (Or, just an extreme zoom-in without clicking should reveal it also.)
Jeff in CA (
talk)
- Note that I'm not a graphist; I saw this while participating in my own request, and I jumped in because I used to live in metro Pittsburgh. At this scale, it's not really going to be practical to separate the tiny gap on Gayasuta Road, because it's literally about fifty feet or less; USGS topo maps at
highest resolution don't show the gap, so you have to pick a different map option and zoom in all the way. If you use the
Allegheny County GIS website, you'll see that it's literally just a single lot that separates the two pieces. Meanwhile, aside from the unsourced bit in the article, do you have any source for Sixmile Island being in O'Hara Township? Everything I'm seeing (whether USGS, Google Maps, or the county GIS) depicts it within Sharpsburg Borough, with the township chunk being largely restricted to the
Highland Park Bridge and ending about 150 feet downstream of
Lock and Dam No. 2.
Nyttend (
talk) 13:05, 30 September 2015 (UTC)
- Thank you,
Nyttend, for looking at my request. I did not remember having seen that map, but at some time I think I did see it. You are correct that it does not show the fifth piece, named
Sixmile Island, in the Allegheny River a short distance downstream from the other pieces. One other problem with that map is that it does not show the separation between two of the pieces (that separation is small but quite real). That map makes it appear that they are connected at a point, which they are not. Please let me know if there is any other information I can provide.
Jeff in CA (
talk) 04:44, 30 September 2015 (UTC)
-
Jeff in CA, have you seen
File:Map of O'Hara Township, Allegheny County, Pennsylvania Highlighted.png? Part of the same map series as the Delaware County map you linked, it shows only four pieces, not five, but despite what the article says, I can only find four pieces. If you know the name of the island in question, that would help.
Nyttend (
talk) 19:06, 29 September 2015 (UTC)
- Graphist opinion(s)
OK, I did this myself. The result is a png file, not svg. Someone who knows more than I might be able to create an svg version.
Jeff in CA (
talk) 20:19, 5 March 2016 (UTC)
![]() Done
Done
Can I have a locator map for Cyrenaica (the eastern province of Libya) please? Keith-264 ( talk) 17:06, 22 October 2015 (UTC)
- @
Keith-264:, I believe this is the one currently used on the article:
File:Map of traditional provinces of Libye-en.svg. Were you after something different?
Jolly
Ω
Janner 03:53, 4 November 2015 (UTC)
- Yes, I want a map of Cyrenaica only, so it's big enough to put the locations mentioned in
Operation Sommenblume. I've found "Locator map many" so I can follow that formula but using maps like the one you linked gets too cramped.
Keith-264 (
talk) 05:58, 4 November 2015 (UTC)
- @ Keith-264: ,are you looking for something like this? Template:Location map Libya, but cropped to comfortably fit Cyrenaica? Jolly Ω Janner 07:19, 4 November 2015 (UTC)
- Yes, I want a map of Cyrenaica only, so it's big enough to put the locations mentioned in
Operation Sommenblume. I've found "Locator map many" so I can follow that formula but using maps like the one you linked gets too cramped.
Keith-264 (
talk) 05:58, 4 November 2015 (UTC)

- Article(s)
- Second Battle of the Masurian Lakes
- Request
- Please vectorize the map of the Winter Battle of the Masurian Lakes in WW1 -- Kopiersperre ( talk) 14:07, 27 October 2015 (UTC)
- Graphist opinion(s)
-
 Indo-Parthian Kingdom at its maximum extent.

- Article(s)
- Indo-Parthian kingdom
- Request
Hello, I recently asked the creator of the map (User:Lommes) to update the map, but now actually based upon some sourcing, but he kindly told me he unfortunately does not find himself able to do so, regarding time. So, upon recommendation of him, I'm asking it to be fixed here. It was actually made back then apparantly in the graphics-lab upon request (without any source), but the article is still unfortunately a mess ever since (like 2011?) so I thought of bringing in some references.
Basically; the territories of the Indo-Parthians need some tweaking, with; the western border set at Nimruz Province, as well as Herat, the northern borders comprising Kabul and Bagram, the eastern border at minor parts of Punjab, India, while the southern border at Kandahar and the mouth of the Indus River; basically, spread mostly at Afghanistan and Pakistan, with a little bit of territoriy in contemporary northwestern India. Here are the references as well, which you can add on commons --> [1] [2]
Could you perhaps ping me upon reply, finishing the map, etc (e.g any reaction)? Thanks and bests :) - LouisAragon ( talk) 04:03, 5 November 2015 (UTC) -- LouisAragon ( talk) 18:39, 5 November 2015 (UTC)
- No one? :/ -
LouisAragon (
talk) 20:12, 19 November 2015 (UTC)
- I don't know if it's the same reason for everyone, but I'd like to point out the reasons I didn't want to take this on. While the image itself is fairly straightforward to manipulate, knowing exactly where to extend it is very difficult. I cannot access either of the references (also they use google.nl), so I'm just going on what you said. Upon looking at out article on Kandahar I see that the map appears to cover it or some of it, so I'm left unsure to what extent it needs to be covered. Same goes for Punjab. Jolly Ω Janner 20:23, 19 November 2015 (UTC)
- @ Jolly Janner:, excus me for the belated response. If I demarcate the exact territory in the two regions you described, do you think you could fix it then afterwards? Bests - LouisAragon ( talk) 03:17, 1 December 2015 (UTC)
- @ LouisAragon:, yes of course. I will give it my best shot. The map can easily be tweaked so it may take several revisions to get it spot on. Jolly Ω Janner 09:19, 1 December 2015 (UTC)
- @ Jolly Janner:, upon rethinking, I think you could just include the entire Kandahar Province as the "southern border", apart of the already aforemention "mouth of the Indus River". For Punjab, India, lets take this place as the maximum eastern extent (tried to take something that was the most central in the province, guess we could fix that later even, but its sufficient for now). Is this more helpful or do you need more specific information? :-) Bests - LouisAragon ( talk) 04:20, 6 December 2015 (UTC)
- @ LouisAragon: first draft is up. Jolly Ω Janner 05:33, 6 December 2015 (UTC)
- @ Jolly Janner:, thanks much. That's looking like it :-) Now, if you could shade a part of Balochistan, Pakistan in order for it not to look "too much" as if as drew it with a ruler, excluding any territory within Eastern Iran (the western-most border should include most of Nimruz Province), and making sure the northern borders are set at Bagram and Kabul (I think they are), I think were about done here! - LouisAragon ( talk) 12:27, 6 December 2015 (UTC)
- @ LouisAragon: second draft up. The border between Minnagara and Charik looks a little odd. Am I doing it right now that I've converted the straight line to a curve? Jolly Ω Janner 00:00, 7 December 2015 (UTC)
- @ Jolly Janner:, yeah regarding such maps for very vague empires its alright to do that. If you could make the border between Minnagara and Charik like it was drawn "priorly" like in the original, aka, straightly back into Pakistan, but more smoothly drawn, that should do it. Also, the minor part in the easternmost area of Iran needs to get removed. In general, as long as it all doesnt look too "ruler drawn", you can make it any shape you want Jolly as long as its roughly within the confined territories I described. If it includes swaths of Balochistan, Pakistan as well, that doesnt matter. :-) Bests - LouisAragon ( talk) 04:03, 8 December 2015 (UTC)
- I think it should be alright like this, thank you! - LouisAragon ( talk) 07:43, 10 December 2015 (UTC)
- @ LouisAragon: I've smoothed some of the borders. There was no territory in Iran. Jolly Ω Janner 21:55, 10 December 2015 (UTC)
- Graphist opinion(s)
References
- ^ Dani, Ahmad Hasan. History of Civilizations of Central Asia: The development of sedentary and nomadic civilizations: 700 B.C. to A.D. 250 Motilal Banarsidass Publ., 1999 ISBN 978-8120814080 p 196
- ^ Rosenfield, John M. The Dynastic Arts of the Kushans (Photographic reference; figures 278–279) University of California Press, 1967
-
 An initial rough stab
 -
Description of second image (if needed)
-
Description of third image (if needed; don't request too many at once, though)

- Article(s)
- Nevado Tres Cruces
- Request
- I was directed here from Wikipedia:Media Copyright Questions when I asked whether the map at the bottom of this PDF ( Archive index at the Wayback Machine) could be used in an article. Following the comments there, I now wonder if that map could be recreated as a version a) that is not a derivative work and thus not subject to non-free content policies and b) isn't just Spanish and black-n'-white. To my understanding, this should be possible to do without creating a derivative work by taking only the information, but not its expression.-- Jo-Jo Eumerus ( talk, contributions) 09:47, 23 November 2015 (UTC)
- Graphist opinion(s)
I think we need more information. What exactly do you want to have on the map? Do you want elevation, geological formations, other? What min and max coordinates? I took a quick look and I think if one starts with our own map created from freely available sources one can superimpose other information. Erp ( talk) 04:23, 24 November 2015 (UTC)
- @
Erp: At a minimum, the geological formations should be there - perhaps as a colour map? The coordinate lines and names should also be there; elevation and ages are not strictly necessary. Superimposing the information on a pre-existent free map seems like a good move, especially if it's a topographic map. Does this help?
Jo-Jo Eumerus (
talk,
contributions) 09:56, 24 November 2015 (UTC)
- This may well be beyond my current skill. I'm trying to figure out what area the map in the pdf covers. The longitudes are fairly straightforward (approx. between 68d35'W and 68d55'W) but latitude is a bit trickier. At a minimum 27d02'S and 27d07'S. I've put an initial first stab up above with just elevation info (I know that isn't what you want, this also isn't quite using the standard wikipedia color scheme for elevation, I shifted it up so the color changes represent 200 meters). I suspect if the other map's info can be aligned one could use patterning superimposed on something like this map to indicate the geological formation.
Erp (
talk) 05:02, 25 November 2015 (UTC)
- It's a good start (misspelling aside; the correct name is Nevado not Nevada), for height lines at least. Jo-Jo Eumerus ( talk, contributions) 12:53, 25 November 2015 (UTC)
- This may well be beyond my current skill. I'm trying to figure out what area the map in the pdf covers. The longitudes are fairly straightforward (approx. between 68d35'W and 68d55'W) but latitude is a bit trickier. At a minimum 27d02'S and 27d07'S. I've put an initial first stab up above with just elevation info (I know that isn't what you want, this also isn't quite using the standard wikipedia color scheme for elevation, I shifted it up so the color changes represent 200 meters). I suspect if the other map's info can be aligned one could use patterning superimposed on something like this map to indicate the geological formation.
Erp (
talk) 05:02, 25 November 2015 (UTC)
Alleged flight paths of 2015 Russian Sukhoi Su-24 shootdown
- Article(s)
- 2015 Russian Sukhoi Su-24 shootdown
- Request
- Request: Turkey and Russia disputed where the plane were before and when it was shot down. According to Turkey: [2] (the red line) and according to Russia: [3]. Would be good if we can combine these two claims in a single map which also show where the border is. HaEr48 ( talk) 07:04, 25 November 2015 (UTC)
- Graphist opinion(s)
- @ HaEr48: with this being such a highly visible article, it was likely someone would make a map without the need of graphics lab. There is File:Sukhoi Su-24 shootdown Syrian-Turkey border.svg in use on the article. I'm wondering if this is sufficient? Jolly Ω Janner 03:00, 1 December 2015 (UTC)
- Article(s)
- Taxation of digital goods
- Request
- A map that shows the legal status of taxation of digital goods per state. The article has a section called "legal status by state" with three subsections that describe the possible position a given state could be in and I think a map would be very helpful.-- Proud User ( talk) 22:01, 3 December 2015 (UTC)
- Graphist opinion(s)
![]() Request taken by
Jolly
Ω
Janner 01:48, 4 December 2015 (UTC). I should be able to get a first draft done within six hours.
Jolly
Ω
Janner 01:48, 4 December 2015 (UTC)
Request taken by
Jolly
Ω
Janner 01:48, 4 December 2015 (UTC). I should be able to get a first draft done within six hours.
Jolly
Ω
Janner 01:48, 4 December 2015 (UTC)
 Done @
Proud User: first draft located at
File:Map of States in the USA by the status of taxation on digital goods.svg. Please let me know of any improvements you can recommend. I have noticed the colour scheme is quite harsh.
Jolly
Ω
Janner 03:21, 4 December 2015 (UTC)
Done @
Proud User: first draft located at
File:Map of States in the USA by the status of taxation on digital goods.svg. Please let me know of any improvements you can recommend. I have noticed the colour scheme is quite harsh.
Jolly
Ω
Janner 03:21, 4 December 2015 (UTC)
-
 The first draft (updated)
- Article(s)
- Siculi
- Sicani
- Elymians
- perhaps also Sicily, History of Italy and others
- Request
- I already did most of the work, but I'm not happy with the result. How can I improve the map to make it more readable and more in-line with the map conventions? Enlarge the texts? Make them smaller? Stick to one type of icons? Also, how to improve the large texts marking subdivisions ("countries")? There's something wrong and I don't know what it is. Any comments appreciated.
- BTW, if anyone wanted to give it a go, the source file is also available for download here. -- // Halibu tt 01:50, 5 December 2015 (UTC)
- Graphist opinion(s)
I have various comments. Please do not take these too seriously, I am far from an expert.
- The colouring of the relief in the sea is too heavy, and tends to distract from the important content.
- The colouring of the three "countries" is darker than it need be, making the place names harder to read.
- Some towns are shown as white circles, but most are triangles of black dots. If there is an important distinction here, it should be explained in a key.
- The font used is rendered in more than one way, depending onto whether I look at the image above, or at the original in Commons. For example, in the image above the word "Sikeloi" extends a tiny way into the sea, but in the Commons version it is entirely on land (as I believe was intended). Likewise, in the version above, I see one of the three dots for "Nakone" obscured by the "i" of "Elymoi". This is a common problem with SVG images on Wikipedia, and can be avoided by taking the advice at [4].
Maproom ( talk) 10:02, 5 December 2015 (UTC)

- @
Maproom:, thanks for taking a look. I updated the file per your suggestions. As to specific issues:
- That's a feature of the original topographic map. I tried to turn off the entire relief layer, the resulting map is indeed lighter, but looses much of its' charm.
- Those were precisely the colours suggested by Wikipedia:WikiProject_Maps#Historical_maps, but apparently they don't work well with color-coded topographic background. I turned the altimetry layer altogether, perhaps it's better that way.
- Yeah, I was initially planning to distinguish larger towns from merely archaeological locations, but the idea didn't work out. Corrected now. (the icon for excavations is from Wikiproject Maps as well)
- That one is weird. If you look at the source, all texts are in Liberation Sans Regular, which is on the list, so in theory it should work just fine. I have no idea why it doesn't. Anyway, I moved the labels around a bit, perhaps this could solve some of the problems. // Halibu tt 01:27, 6 December 2015 (UTC)
- Article(s)
- Yucca Corridor, Los Angeles
- Request
- Boundaries of the area and street names as shown in the sample. BeenAroundAWhile ( talk) 19:15, 13 December 2015 (UTC) The southern boundary apparently does not include the sidewalk or any part of Hollywood Boulevard. BeenAroundAWhile ( talk) 07:17, 16 December 2015 (UTC)
- Graphist opinion(s)
-
 (1)
(1)
Main location map -
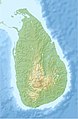 (2)
(2)
Main location map (relief) -
 (3)
(3)
NASA topography map


- Article(s)
- Template:Location map Sri Lanka
- Module:Location map/data/Sri Lanka Northern Province
- (more modules to be created)
- Request
- Replace the topography detail of the existing relief map (2nd file), with that of the more accurate and detailed NASA map (3rd file). (recolouring will be needed)
- Sharpen the provincial and district borders with those as shown on
files 4 and 5file 6. These two files are samples only, and are to be deleted. - Fix borders on the relief map (top area - 2nd file).
- Make provincial borders thicker than district borders.
- Remove the two rivers and reservoirs from the first two maps ( see also), and
- If needed, you may visit this page to test the accuracy of the country's borders. The placemark's coordinates are very accurate (taken from Google Earth), and shows the extreme ends of the country. Thanks! Reh man 06:47, 27 December 2015 (UTC)
- Graphist opinion(s)
Talk page Information
With User:Dycedarg's help I've implemented auto-archiving, let me or him know if there are problems with it. Kmusser ( talk) 12:52, 8 April 2009 (UTC)
Now I know that this isn't the best way to make svgs but ... you can use the site vectormagic.com to do them automatically! It is a computer that is doing the work so sometimes the results aren't just right, which makes later editing harder but for certain (generally simple) images it works fine. Chris DHDR 17:15, 25 April 2009 (UTC)
I clicked on the "make a request" link, and noticed I was logged out. I asked at the Help desk, and they suggested asking here. The person that suggested it tried, and did not have the same problem. I've tried several times, so it isn't a one-off glitch. I can navigate elsewhere without logging out, so I don't think it is a general cookies problem. (If someone notes I successfully filed a map request - I did it by copy and paste, not by clicking the link. Not a big deal, just wanted to see if it is a known problem with a solution. Sphilbrick ( talk) 16:13, 4 May 2009 (UTC)
I'm a fairly new user, but I've developed some private wikis elsewhere and was curious if there is any possibility of using Google Map embeds within Wikipedia pages. Specifically, I'm looking at some sections that could be expanded, covering legislative districts. There are certainly some graphical maps that could be used for this, but I was hoping that an embed would be possible to allow for greater detail. Gregwythe ( talk) 08:42, 11 May 2009 (UTC)
- I doubt it, Google Maps license is not compatible with Wikipedia.
Kmusser (
talk) 10:11, 11 May 2009 (UTC)
- Thanks ... I suspected there might be either a copyright or security reason for not seeing the two together. Any advice for what would be an appropriate, allowed way to incorporate a legislative district boundary map? I've been using GIS tools to convert boundary shapefiles onto Google Earth/Maps for my personal use. If I were to create a graphic with that outline on any other map, I just want to make sure I'm using something that passes copyright muster. The maps provided by the state aren't terribly great, aesthetically speaking.
Gregwythe (
talk) 17:28, 11 May 2009 (UTC)
- Assuming we're talking the U.S. here you should be able to put together a decent map using entirely U.S. government sources which avoids any copyright issues. I use GIS files from the Census and the National Atlas which is USGS. Kmusser ( talk) 19:21, 11 May 2009 (UTC)
- Thanks ... I suspected there might be either a copyright or security reason for not seeing the two together. Any advice for what would be an appropriate, allowed way to incorporate a legislative district boundary map? I've been using GIS tools to convert boundary shapefiles onto Google Earth/Maps for my personal use. If I were to create a graphic with that outline on any other map, I just want to make sure I'm using something that passes copyright muster. The maps provided by the state aren't terribly great, aesthetically speaking.
Gregwythe (
talk) 17:28, 11 May 2009 (UTC)
Hello, not sure who is watching the page but I have a query. I need a map for the range of the subspecies of the Australian Magpie, and I have taken photos of the relevant pages in the two books which have the source material. I was about to upload and post here when I had doubts about what licence to place on them. Are they for me to label as own work, as I took the photo, or Fair Use? But using he range is altering, isn't it? Shall I upload them here or ask to send to someone? The reason there are two maps is one covers the range in Australia and the other has southern New Guinea. Casliber ( talk · contribs) 12:02, 28 May 2009 (UTC)
- That would be Fair Use if anything, but the rationale would be a little sketchy, e-mailing them to whoever takes your map request would probably be better. Kmusser ( talk) 12:55, 28 May 2009 (UTC)
The convention set is really fine, congrats.
I wonder if some of you using ArcMap have prepared and/or shared style elements in respect to these conventions. phme ( talk) 14:21, 4 June 2009 (UTC)
I've created a map with Adobe Illustrator CS2, but I'm having trouble opening/uploading the resulting SVG file when I export. When I upload to Wikimedia Commons, it says the file is corrupted. When I attempt to open it with Firefox, I get an XML parsing error. Any suggestions? JKBrooks85 ( talk) 04:57, 24 July 2009 (UTC)
- I've had problems with Illustrator's SVG export as well. Sometimes you can fix it just by running it through Inkscape (open and save as simple SVG), if that doesn't work you usually have to edit the SVG file in a text editor to find the offending code. Kmusser ( talk) 12:34, 24 July 2009 (UTC)
- Firefox is usually good at pinpointing SVG errors within the file. Search the source with a text editor or use View → Page Source (Ctrl-U) + Find (Ctrl-F) in Firefox to locate the text mentioned in the error message. (If it occurs multiple times, the line number should narrow it down.) If the quoted text seems correct, it may be worth studying the line or two above it: perhaps a previous tag was not terminated properly.
Certes (
talk) 14:25, 24 July 2009 (UTC)
- Thanks for the suggestions. I got it to work by running it through Inkscape after creating it in Illustrator. JKBrooks85 ( talk) 22:39, 24 July 2009 (UTC)
I need a map of the Norfolk Broads area creating for use on the List of drainage windmills in Norfolk. I tried using the existing Norfolk map with this result. I can lose #57 from the map as it was a pumping windmill rather than a drainage windmill. Can someone create a map just showing the Norfolk Broads area please?


I've recently created these maps using a command-line tool that I wrote to project multiple shapefiles directly into an SVG file. The bits are barely dry on the program, but you can see that it has a certain level of functionality. I am mentioning it here in case others could find it useful for their projects, and because I would appreciate cogent feedback. It is written in Perl, and I've developed and used it on Linux. It should be able to run on Windows if the Perl module Geo::Proj4 can be installed there.
The project is available for download along with some basic documentation and an example of its use (to produce the first map shown here). It's probably not for those who shy away from the command line -- it's syntax is a doozy. Among the list of possible enhancements I'm considering are either a separate config file to specify the rendering information for a map, or a GUI, or both.
In the interest of full disclosure, some post-processing in Inkscape was required for these, as is documented in the project. Most notably, all text is added manually. -- Kbh3rd talk 04:18, 8 August 2009 (UTC)
- Very interesting ! I'm interesting to know clearly : for these maps, what made your soft ? what made you yourself in Inkscape ?
- May you create a tutorial such as :
- Introduction/description ;
- what system/packages are need ;
- how to install + download link ;
- how to use (list of functions) ;
- gallery of examples.
- I encourage you to put this there:
Wikipedia:Graphic_Lab/Resources/Software/Kbh SVG script. Keep me aware of your progression ;)
Yug
(talk) 13:08, 4 November 2009 (UTC)
- Note1: I don't understand clearly what make this script, and if it apply to world wide or USA only.
- Note2: Your script may maybe help the large German map project there de:Wikipedia:Kartenwerkstatt/Positionskarten/Europa.
- Please keep me informed. ;) Yug (talk) 13:08, 4 November 2009 (UTC)
- I think that this perl script is fairly well documented on its github wiki pages, though of course improvements are possible. There is full parameter coverage, an example script, and a gallery of maps with a brief discussion of how each was made, albeit without the full command line. I think I chose the BSD license for it, so you can do whatever you want with it, and of course it adds no encumbrance to what you produce with it.
- Apart from some external Perl packages (and that libproj library) that it depends on, there is no installation required for this program itself. I have intentionally architected it as a monolithic script that includes no modules of its own that need installing -- just run it from wherever you downloaded it to. Dependencies are listed there, but the list might not be 100% complete -- many perl packages came pre-installed with the Linux distribution that I use, and cpan installs other dependencies with little effort, so I probably missed some third-party packages required by the modules that I directly import.
- Having used it a bit more myself, I have in mind a longer to-do list than what is shown, to make it more useful in more situations. I'd like to add data filtering by numerical comparison, e.g., which cannot currently be done with the regular expression matching that it has. I'd also like to color object based on numeric ranges. Getting the bounding box right should be made a higher priority, too, though it can be corrected afterwards with Inkscape. I really should get around to removing the SVG package to avoid its errors, minimize external dependencies, and streamline operation.
- If this tool is not polished enough for your use, or if you require a point-and-click GUI, you might want to investigate Quantum GIS. It is supposed to have the capability to "print" directly to an SVG file. My inability to make that work with the current version was part of the impetus behind this project.
Sorry, I know this is probably not the right place to put this, but is there an international {{Move to commons}} tag for other-language Wikipedias? I've found some images on other Wikis that are free-use, but don't know how to tag them properly. -- Chris (クリス • フィッチュ) ( talk) 17:35, 20 February 2010 (UTC)
Can someone help me out on this? Or at least explain the map in its current form. Thanks 81.68.255.36 ( talk) 10:30, 14 March 2010 (UTC)
I don't know if there is a tool exits already for this (probably there is - for JPEGs there is anyway) but I've cobbled together a website to generate SVG maps to show colourised data e.g. the typical GDP per capita maps, etc.. The site takes CSV data info form of ISO country code [comma] value and currently can generate a world or Europe map.
Based on feedback from here, I will (or not) add other maps and features. Link to site. Some sample data is provided. --RA ( talk) 00:48, 18 March 2010 (UTC)
- (I have revised county to country.)
- What tools exists already for JPEGs? installed on the internet like this one?
- Are there freely available tools to combine user-provided country-level data, a single numeric variable keyed by the ISO country code, with political outline data (shapefile?) provided by some geographic organization? And to select a region such as the European countries from the world political map? Or have you written those parts yourself? -- P64 ( talk) 13:45, 12 July 2010 (UTC)
- This is amazing. Over at commons there are all kinds of requests all the time for maps showing diplomatic relationships etc - they take a graphist 10m to do, but it's time that could be spent on other things. You tool can give the non-graphists exactly what they need. Thumbs up! Jon C ( talk) 22:59, 28 December 2010 (UTC)
- JC, thanks. --RA ( talk) 18:09, 13 February 2011 (UTC)
Please see:
- commons:Commons talk:Map resources#I need some advice -- Timeshifter ( talk) 09:25, 20 March 2010 (UTC)
- The set of maps J.Wales is talking about seems really high level. I answered on the page, and messaged to him. Hope he will forward the message. Yug (talk) 17:44, 14 April 2010 (UTC)
Later correction: we later decided to rather focus on SVG map making tutorial. See this section. And to make some contributors calls. Yug (talk) 11:06, 1 February 2012 (UTC)
Is there some map makers ?? I was astonished to see that 90% of maps requests don't get neither comments, neither satisfied. We really need some users to come on the Wikipedia:Graphic Lab/Map workshop. People interested, please come ! Map making is a specific skill, almost easy to do, while maps, or relate technical diagrams are wonderful tools to explain and illustrate articles and knowledges. Inkscape ( Download!) is a nice free software to create SVG maps. So come, come, come, choice one, and give a try ! We need MAPMAKERS there !!! :] -- Yug (talk) 04:28, 13 April 2010 (UTC)
- Might be better to post this at teh
village pump then to generate interest.
Casliber (
talk ·
contribs) 00:35, 27 April 2010 (UTC)
- Done !
Village pump 2011/06/10
Yug
(talk) 18:26, 9 June 2011 (UTC)
- It might help if the map tutorials were complete and/or in English. For a long time I was stuck at a halfway point on a number of maps until I played around and got the results I wanted.
Matthewedwards :
Chat 23:53, 30 May 2010 (UTC)
- Done for topo maps! See
Wikipedia:Graphic Lab/Resources/QGis lesson 1: Create a topographic background
Yug
(talk) 18:28, 9 June 2011 (UTC)
Salut, Yug! Is there still some things to do for map-makers? Where I can see requests for the maps? I am looking for projects in data visualization and recalled wikipedia Pasvikdalen ( talk) 12:45, 29 January 2014 (UTC)
I uploaded a fairly large (53Mb) image to commons, Greater_Jerusalem_May_2006_CIA_remote-sensing_map_.jpg. Actually the orginal jp2 format image is much smaller than that but I converted it to jpg assuming that was a current requirement. The auto-generated preview (463 × 599 pixels) works fine in commons but not in wikipedia. The software in wikipedia seems to be trying to generate a 7,726 × 10,000 pixel preview. Seems odd. Should I do something about it and if so, what ? I'm not sure that it matters since the link to the commons file is there but I thought I should ask. I wasn't planning to reduce the resolution of the commons file since the full resolution is required and complies with policy. Sean.hoyland - talk 08:57, 26 April 2010 (UTC)
- Looks fine to me, I'm seeing it's default preview size as 791 × 1,024.
Kmusser (
talk) 10:03, 26 April 2010 (UTC)
- In wikipedia ? The plot thickens. I'm still seeing 'Size of this preview: 7,726 × 10,000 pixels' and no preview. Maybe there's a setting somewhere... ? Or perhaps it's client dependent. I use Internet Explorer. Oddly the image is fine when used in wiki articles. Sean.hoyland - talk 10:15, 26 April 2010 (UTC)
- ah got it. there a preview limit setting under my prefs. That fixed it. Thanks. Sean.hoyland - talk 10:18, 26 April 2010 (UTC)
Wikipedia:Graphic Lab/Resources/Tutorials
Using shapefiles and R statistical software, I know how to do some statistical analysis and generate some maps of area data (eg "Colourised data maps" above). What tools are available for these more basic tasks?
- selecting a shapefile subset, such as sub-Saharan Africa from Africa or from the World? or New England counties from a county map of the United States? At wikipedia we have zillions of maps of the United States, and of individual states, but few or no regional maps.
- extending a shapefile to incorporate user-provided fields of numeric data, such as every country's number of participations in the World Cup tournament? -- P64 ( talk) 14:02, 12 July 2010 (UTC)
- I have learned more about R's own capabilities (not yet the hoped for answers). After reading some articles on geographic software and data, and some project pages on maps and graphs, some of my searches are more effective. Even writing my preceding note has been some help (eg, shapefile subset, there's a concept). -- P64 ( talk) 21:59, 13 July 2010 (UTC)
I'm interested in creating new .svg files from raster maps. But i have some doubts, mostly because i don't know what to do after the file has been created.
- I have to copy all the features (colours, font size ec.), or may i use the ones suggested by Wikipedia:WikiProject Maps/Conventions?
- How to load file in Commons? Do i have to use a new name for file, or just upload in the parent one?
- How to categorize the "new" file? Do i have to place in same category of the parent file, or do i put it in the "generic" category SVG maps?
- What to do with the parent file? Has it to be purposed for deletion or not? Thanks a lot Ciaurlec ( talk) 21:17, 29 October 2010 (UTC)
- I’m pretty new at this but here’s my 2¢ worth:
- I think for any current informational map it would be best to use the standard formats as much as possible. Illustrated maps and historical ‘replicas’ might be exceptions. (Thanks for pointing out that template BTW—I hadn’t come across it yet!)
- If you choose the “derivative work” link from the Upload page, you’re passed to a helper script that copies the description & licence info from the original file into your new one. It also lets you choose from a list of categories it’s guessed, based on the original description, and checks for filename conflicts. Unless the original name is excessively long or short, uninformative, misleading, or in another language perhaps, you might as well keep it the same: note that foo.svg is considered different from foo.jpg and foo.png.
- Outside my experience, apart from the above. But if the upload helper doesn’t come up with any good ones, you might look at how the original was categorized.
- I just tag it with Template:Vector version available; this template includes a note implying that keeping the original is sometimes necessary for licensing reasons. I presume there are bots that delete redundant images once they’ve been orphaned, but I don’t know much about the deletion process(es).
- — Odysseus1479 ( talk) 01:04, 30 October 2010 (UTC)
I'd like to withdraw my request for a route of the
Wallkill Valley Rail Trail. I've just discovered
OpenStreetMap, which can create such maps under a free license.
--
Gyrobo (
talk) 15:32, 12 January 2011 (UTC)
The .svg maps of countries within the EU, such as [[File:EU-United Kingdom.svg|600px], are not displaying properly. Can someone here help sort it out? Ghmyrtle ( talk) 09:34, 15 February 2011 (UTC)
I'm having the same problem when viewing File:EU-Hungary.svg via the English Wikipedia. Curiously enough this problem seems to be limited to EN Wiki only, as the same files are rendered correctly when viewed in Commons and other language Wikipedias as well. There seems to be some problem in the coding that retrieves the files and their respective info from the Commons, because the PNG "previews"/thumbnails of the files are replaced with a placeholder icon and the image dimensions are given as 0 x 0, while their size is given correctly (2.61 MB for EU-Hungary.svg). This seems to point to a permission problem within the EN Wikipedia itself (with the script having either insufficient permissions or lack of membership in the appropriate group). Could any of the admins (not the sysops, but guys who have the capabilities and privileges to actually "look under the hood") take a look at this? CoolKoon ( talk) 17:59, 15 February 2011 (UTC)
I've done some research as far as the EU maps are concerned and found out that it's the EU maps of the following countries that don't work: Belgium, Bulgaria, Cyprus, Finland, Germany, Hungary, Italy, Lithuania, Luxembourg, Malta, Netherlands, Poland, Slovakia, Slovenia, Spain, Sweden, United Kingdom. All of the files use the naming convention EU-Country_Name.svg (e.g. File:EU-United_Kingdom.svg, File:EU-Slovenia.svg etc.), none of these are displayed correctly (at least the PNG files derived from them), all of them use a placeholder icon instead and basically have the same issues as the File:EU-Hungary.svg mentioned above. CoolKoon ( talk) 19:12, 15 February 2011 (UTC)
- Has someone changed the underlying coding or something? Sounds strange that it has just decided to develop this error. Jamesinderbyshire ( talk) 14:54, 16 February 2011 (UTC)
Same problem with File:Europe-Georgia.svg Chipmunkdavis ( talk) 06:49, 17 February 2011 (UTC)
- I saw someone say that changing a thumb600px to 599px (or 601px) got around a problem they had with thumbs not refreshing. I don't know if that helps EdwardLane ( talk) 09:52, 16 July 2011 (UTC)
Hello ! I'm looking for partners to push toward GIS mapmaking, GRASS GIS, QGis ! Who have some basis in this ? which software ? Please let me know below ! Yug (talk) 16:31, 9 June 2011 (UTC)
Quality push: QGIS lesson 1: Create a topographic background
Later correction: we later decided to rather focus on SVG map making tutorial. See this section. And to make some contributors calls. Yug (talk) 11:06, 1 February 2012 (UTC)
|
Dear Map makers ! |
|
|


- If you are nearby London, there will also be some 'free*' GIS/QGis courses. (* = £15 for food/facilities)
- http://www.faunalia.co.uk/en/courses
- 12th July 2011 - Beginning Computer Mapping (Dauntsey, Wilts, UK)
- 19th September 2011 - Quantum GIS (Reading, Berks, UK)
- 20th September 2011 - Advanced Quantum GIS (Reading, Berks, UK)
- Would be nice if some of us go there, for learning and networking. Yug (talk) 16:27, 9 June 2011 (UTC)
- I'd be willing to copy-edit the tutorial. Speaking of copy-editing, you may want to be a little more inclusive in your message ("a tester and his feedbacks, installing the QGis on his computer" [emphasis mine]); although Wikipedia sadly skews quite heavily toward male editors, there is the occasional female ones around too. ;) - MissMJ ( talk) 01:45, 10 June 2011 (UTC)
We continue to push ! Lesson 1, lesson 2, and the major GIS sources are available :
We are exploring and finding ways within QGis. If you want to join and explore, let's go. Download QGis, follow the toturials, find new ways to do things, and share what you find ! Lesson 1, lesson 2, /QGis mapcolor files & GIS sources, a Todo list are available, and lesson 3 have an outline to complete. Fresh explorers/sharers welcome ! Yug (talk) 08:46, 16 June 2011 (UTC)
Inkscape⇔
Adobe Illustrator
[5]: Inkscape's native format is
SVG, ant it's also a format supported by AI, but the two implementations are not 100% compatible. Inkscape can also export into PS, EPS and PDF, that Illustrator recognize.
clarification needed It is also advice to stay working on illustrator if you start do do so, since illustrator openning a SVG translate some of the SVG code, and will then just focus and work on this, while Inkscape will keep working on the standard SVG code.
|
Hello, a friend complained he can't use my SVG in illustrator. Did someone had troubles to open complex file to export from Inkscape into Adobe Illustrator ? Should I export to him with SVG, PS, PDF, EPS ? Did you made some tests ? some failures ? what are your experience and Is there a section about this on the graphic lab ? and in the whole, is Adobe Illustrator code fine wiki wikipedia and its collaborative approach ? Yug (talk) 06:01, 17 June 2011 (UTC)
- After 3 hours of testing, it appears that the bug was not Inkscape's SVG code, it's Illustrator itself, which crash when the SVG (one path) is too heavy. Some other experiences ?
Yug
(talk) 14:08, 17 June 2011 (UTC)
- They're both horrible. I've lost count of the number of times I've had to resort to manual editing to ensure W3C compliance. Illustrator seems to flatten all paths then group and clip them, which makes things too complex for alternative editors (this can happen the other way around too). Inkscape adds "sodpodi" tags all over the place, which, while not affecting readability in Illustrator, wrecks compliance. FWIW, the trick seems to be to save SVGs as "plain" in Inkscape and without the default "Maintain Illustrator Editing Capability" check box ticked in Illustrator. These don't solve the problem completely, but they help. Philg88 ♦ talk 17:53, 12 August 2014 (UTC)
See: Wikipedia:Graphic_Lab/Map_workshop/China/Github Yug (talk) 14:31, 25 January 2012 (UTC)
So now that South Sudan has become a country, there are about a gazillion maps that need to be changed reflecting its borders. I'm wondering if it would be beneficial to create a different section of the workshop, or a separate category, or something, anything, where all the maps that need editing could be added to avoid swamping the main workshop page with a metric ton of requests relating to South Sudan. Or maybe just one monster request tacked at the top of the page where people can add a list (not thumbnails) of files that need to be modified? - MissMJ ( talk) 20:24, 12 July 2011 (UTC)
- I am sure the vast majority need to be changed, but would counsel that some maps may be used in history-based articles and should not have the borders changed. Also, the impression I have is that S Sudan will be widely recognized, but we should just wait and see that has happened. When I looked a day ago, there were only a couple countries that had done so and not UN yet. We should make sure our political boundaries follow general consensus.
TCO (
reviews needed) 20:48, 12 July 2011 (UTC)e
- MissMJ, QGis may help greatly in this project of serial creation of locator maps. Naturalearthdata have a file about 'disputed territories', maybe south sudan is there.
Yug
(talk) 23:26, 12 July 2011 (UTC)(I'm going to bed)
- Would it be possible to tag the images with "Categories: South Sudan map update project". Then the tag can be removed once the image has been updated. This would create a thorough list as people tag maps that are likely to be in need of an update. Delusion23 ( talk) 12:22, 13 July 2011 (UTC)
- Okay I've created commons:Category:Maps_needing_South_Sudan_political_boundaries. Any images that need South Sudan added that are on Commons should be tagged with [[Category:Maps needing South Sudan political boundaries]]. Anyone wishing to work on a map can then go there. There's already some good bases in commons:Category:Maps of South Sudan. Add a {{Warning|When updating this map with the borders of South Sudan, please upload a separate version.}} to any maps that shouldn't be overwritten. - MissMJ ( talk) 21:07, 13 July 2011 (UTC)
- MissMJ, QGis may help greatly in this project of serial creation of locator maps. Naturalearthdata have a file about 'disputed territories', maybe south sudan is there.
Yug
(talk) 23:26, 12 July 2011 (UTC)(I'm going to bed)
- Done: to do list updated. New
SVG exercices for mapmaking (to open in Inkscape) published + stated the need for new editors. Non-free softs tutorial + QGIS unclear/unfinished tutorial issue : stale.
Extended content
|
|---|
|
Hello, we clearly need more management on this English workshop. Challenging map requests are there, but we manage just 20% of them O.O ! We need more map makers, we need to push toward better maps (
GIS -
shapefile /
QGIS), we need more reactive talks (have fun !), and to summarize them better, we need people, and to call for them. I will continue to push as I can toward these inspiring directions, but we need more overview than just me : a French mapmaker. The English workshop need leadership and initiative ! There is a lot to learn, Let's explore, let's Have fun !
Yug
(talk) 14:36, 25 January 2012 (UTC)
|
Marcus, I also started a clean up for the QGIS tutorial. It's not the priority, but the lesson 1 need a full rewriting, that's true. Yug (talk) 21:52, 1 February 2012 (UTC)
- SVG exercices for mapmaking (v. 12/01/30: to open in Inkscape). Try it : )
According to previous feedbacks, I pushed toward the publication of this much need basic SVG mapmaking tutorial (rather than the too-high-level GIS tutorials). Review/copyedit welcome ! If feedbacks are positive, we can increase sharply its visibility. I also updated our "road map/priority list" : /to do, so we have a guideline to how to improve the project. Graphism is a slow, precise work. We mainly need more people, and more people digging in SVG mapmaking. So if you are interested ! Yug (talk) 11:26, 30 January 2012 (UTC)
Can anyone give me an example of how to stitch SRTM3 tiles using the raster calculator in QGIS, please? Cheers, Ma®©usBritish[ chat 10:03, 14 February 2012 (UTC)
- Hello Marcus, nice to see you are exploring GIS map making. We still have a long way to go. Your question is out of my current knowledge, but I can redirect you toward the QGIS forum :
| If you encounter any issues, you can browse and ask questions at the QGis Forum > Help using QGIS (very active, will generally answer in ~6 hours). |
- You have to create an account in 5 mins. Then go, say you are from wikipedia, and put your question very clearly (they are busy professionals) :) . For me, 2 questions failed so I did without, but I solved more than half dozen big troubles by asking them. That's a place to know. Best wishes~~ -- Yug (talk) 17:38, 15 February 2012 (UTC)
- If you have too many tiles, then just prefert this source :
-
 NASA / USGS:
SRTM3 (2000,
Public domain).
Specifics: topography layer(s), 1px= 93m (3"arch), 60⁰N-56⁰S (landmass only), datum WGS 84. Files: on command, 1 tiles.
NASA / USGS:
SRTM3 (2000,
Public domain).
Specifics: topography layer(s), 1px= 93m (3"arch), 60⁰N-56⁰S (landmass only), datum WGS 84. Files: on command, 1 tiles.
- --
Yug
(talk) 17:56, 15 February 2012 (UTC)
- Merci beaucoup! Ma®©usBritish[ chat 10:47, 16 February 2012 (UTC)
- QGIS is tiresome, is it not? I went to great lengths to Merge many SRTM3 tiles into 5x5 size tiles, to ease raster loading, only to find that the Shaded Relief plugin cannon handle the new size file (most ~50–100Mb) and gives a Python MemoryError. I hope the next version of QGIS deals with memory handling, or supports x64-bit better.. I have 4Gb RAM, it should have been sufficient, so this is a disappointing setback.
Ma®©usBritish[
chat 13:14, 18 February 2012 (UTC)
- 1. Hello Marcus, first and for convenience, did you used the new NASA website for GIS, so you just have one big tile ? nb: I update the tutorial accordingly. Thanks for your feedback : )
- 2. What is your OS ? Linux, Windows, Mac ? I use Ubuntu. I will ask around, I think some other GIS mapmakers use Windows.
- 3. For shaded relief I met the same memory issue but I then believed it was my computer. Anyway, I see two ways to bypass it :
- as I did, by using Galdem (see tutorial section for installation and use). I got better result with Galdem: about 5-10 times faster. (!) And never bugging. I use Ubuntu, Galdem should be available on other OS, tell me your OS, I will ask for help.
- getting smaller GIS source. If the plugin crash, I guess it's because your .tiff is too big, too precise, for a too large area. If you use SRTM3, then move to a lower quality datum : ETOP01. I never tried, but that should reduce the tiff file by 10, so the plugin *may* handle it successfully.
- 4. Do you use SimpleSVG (plugin), will be need soon I guess. Or are you creating a png map ?
- 5. Yes, QGIS is tiresome, GIS mapmaking is tiresome to learn. Just a small dozen of wikipedian do it. I personnally learned from Sting, NNW, Sémhur, Bourrichon how they create great maps : slowly, carefully. You are progressing : keep asking questions when you need, I will answer to as much as I can. You can also upload a svg/png of your current work so I/we can follow your situation.
- Best wishes ! Yug (talk) 14:38, 18 February 2012 (UTC)
- Thanks, I'm using Windows 7 on my PC and laptop, I don't use any other OS. The NASA site works for me, but I often get errors such as "The Device is Full" (what device?). Is ASTER GDEM V2 the same quality detail as SRTM3? But I don't see how downloading the data as 1 large tile, which can be upto 20 tiles in area helps, as it also causes a MemoryError when creating Shading Relief. I have no problem with the tiles per se (SRTM3s atop a ETOPO1 basemap to hide the voids), I've passed learning that stage.
- I'm now at the Shading Relief part, I'm upto trying en masse: I'm using Azimuth 320°, Elevation 60° with 0.000009 exaggeration, which works fine for individual SRTM3 tiles, although I have to convert them from TIFF to PNG in Photoshop, in order to completely remove the white alpha transparency which adds a faint but irritating tint. Not sure if there's any other way than this? It's a shame QGIS can't handle larger areas without memory issues. And the properties should be easier to apply to multiple tiles, without repeating long-winded processes. Some kind of "Select All" and "Apply to Selected" would be great addition to the software. QGIS needs an Adobe CS-style application to shake it up.. if QGIS was as friendly to use as Photoshop CS it'd be amazing. I wonder when QGIS 2.0 is due. Cheers,
Ma®©usBritish[
chat 16:26, 18 February 2012 (UTC)
- (please put numbers and line jump between your issues, that ease reading / answering)
- Aster and SRTM3 have about the same quality : 1px = 31m. See our page "/GIS sources..." But GTOPO/ETOPO are far lighter, since 1px = 930m.
- Ok, you know merging, good. : ) If you work fine with SRTM3's tiles, continue.
- Yes, I did the same : I had to convert to PNG for the GIMP/Photoshop clean up, you do it right : )
- I agree for the need of grouping. I ignore if there is a way to group them without merging them.
- QGIS is already a major improvement for the free GIS softs, but It also still have a long way to go on the accessibility/functionality side. I'm actively involve in the SimpleSVG plugin development, which may one day be include in QGIS, thus adding a lot of convenience for SVG mapping. : ) From what I see, you manage well, you took the initiative to bypass some issues which is always the way to do : "find a way". Good. PS: if you learn some tips, consider sharing.
Yug
(talk) 17:13, 18 February 2012 (UTC)
- Thanks. I'm aware that SRTM1 provides very high detail DEMs but only for the USA. I was wondering if there have ever been any high detail tiles produced for the UK/Europe, beyond SRTM3? I notice that even with shaded relief applied, a lot of the hill ranges in certain UK regions lack detail.. e.g. Cumbria, which means small area maps are not easy to produce without appearing somewhat inaccurate. Cheers,
Ma®©usBritish[
chat 07:32, 20 February 2012 (UTC)
- The ASTER DEM provides a global 30m resolution (the same as SRTM1). However, it is not in the public domain, see the terms and conditions. OSM isn't sure if it can use it, and the reviews of ASTER linked there indicate its actually not any better than SRTM3(!)
- For the UK, OS OpenData provides a DTM.
File:Central Cairngorms UK relief map.png shows its limit, which is about double the resolution of SRTM3. Tile merging will be a nuisance though.--
Nilf
anion (
talk) 12:17, 21 February 2012 (UTC)
- Thanks for the info!
Ma®©usBritish[
chat 13:18, 21 February 2012 (UTC)
- @Nilfanion, you do GIS mapmaking.... @____@ (I almost killed myself to open this GIS/QGIS way for the English wikigraphists)
- @Marcus, tell me when you upload on commons. Even a draft. Cheer !
Yug
(talk) 21:32, 25 February 2012 (UTC)
- No - I clearly have nothing to do with GIS. I'll have a look over the tutorials sometime and see if any work is needed ;)-- Nilf anion ( talk) 11:54, 26 February 2012 (UTC)
- Thanks for the info!
Ma®©usBritish[
chat 13:18, 21 February 2012 (UTC)
- Thanks. I'm aware that SRTM1 provides very high detail DEMs but only for the USA. I was wondering if there have ever been any high detail tiles produced for the UK/Europe, beyond SRTM3? I notice that even with shaded relief applied, a lot of the hill ranges in certain UK regions lack detail.. e.g. Cumbria, which means small area maps are not easy to produce without appearing somewhat inaccurate. Cheers,
Ma®©usBritish[
chat 07:32, 20 February 2012 (UTC)
- Okay, will do.. have been busy with other things lately, and am a bit side-tracked from Wikipedia and QGIS, but will get back into the swing of things. On a side note, I'm confused by the SimpleSVG plugin hype. I saved two test files, one via SimpleSVG, one via regular "Save As Image". They both saved an identical quality 553Kb PNG image based on what was in the main frame (i.e a screenshot), and SimpleSVG also produced an additional .svg file which appears to be little more than an XML wrapper that embeds the raster. I had expected, from the plugin name, for it to output some form of pure (bit simple) vector code of the map; sort of a Raster > Vector converter. Maybe I'm missing the point of this plugin, as I don't have Inkscape (I have Illustrator), but when I loaded the .svg file in my browser it just shows a red outline, the raster doesn't show. I use the "Print screen" method to get a custom sized raster output, though I would prefer SVG. Should I be outputting maps as a raster and using dedicated software like Illustrator to redraw it as a vector? Cheers,
Ma®©usBritish[
chat 23:49, 25 February 2012 (UTC)
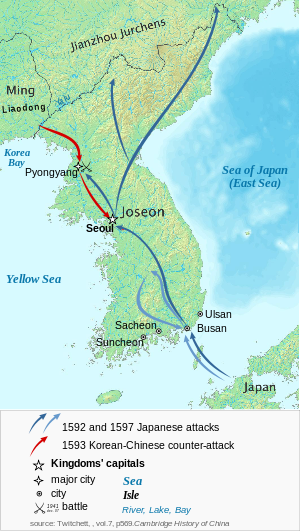
Example of nice raster topographic background for wikipedia use : fine : ) - SimpleSVG: If you use both shape files and raster files in QGIS —which I assumed—, SimpleSVG is helpful. If you just use raster layer, then there is no special advantage over the print composer (which even provide more control for the output).
- Until now, SimpleSVG point is to cleanly convert ShapeFile to clean SVG files, outputting a clean, well structured SVG to edit in Inkscape.
- SimpleSVG haven't raster2SVG converter... yet. That may come soon (some few months?) I'm in contact with the programmer for that. That would be wonderful.
- Second point. Currently, to convert from raster to SVG, it's an handcraft job. Based on a same main frame, we create a serie of black/white raster output with different altitude level :
- white < 0m < black
- white < 100m < black
- white < 200m < black
- Then vectorize in Illustrator/Inkscape each black shape, thus creating the different topographic layers to color accordingly. It's in my opinion more fun and interesting than useful (for wikipedia usage). Full vectorization become a 'must have' if your usage is real-world professional publishing or conference's projection. Let's me add this to my to do list for the QGIS tutorials. ; )
Yug
(talk) 09:42, 26 February 2012 (UTC)
- Ah, I see. No I didn't test the plugin with anything but rasters; I have some shapefiles but they were not used. Seems like a fairly long process to go through each altitude, export it, vectorise it, colour it, make it a layer until all the levels form a purely vectorised basemap on which to apply geological features, locations, etc. I'm sure the end result can be brilliant, but it's a shame there is no automated process to do this far faster. I have yet to understand how the Raster Calculator works apart from a couple of very basic tasks. GIS is somewhat specialised work, and as is often the case with such software the pros don't like to publish too many tutorials/guides for amateurs to learn the job and risk taking away their work, as I expect they can charge quite a high price for well produced maps/terrain images, etc. Any guides, tutorials or information you publish is appreciated however. Cheers,
Ma®©usBritish[
chat 10:00, 26 February 2012 (UTC)
- Incidentally, the map of Korea is not a full vectorisation; as it still contains a raster element (the relief shading). It would be good if the tutorials provided a mechanism for vectorising that too - I'd imagine a similar process to that above but even more tedious (unless automated somehow).--
Nilf
anion (
talk) 11:54, 26 February 2012 (UTC)
- There is a plugin, SimpleSVG, which may include this function soon. We need to push the programmers into this direction.
Yug
(talk) 15:18, 26 February 2012 (UTC)
- I agree with that, I find it irritating that we have to have one raster layer in an otherwise pure vector image.--
Nilf
anion (
talk) 17:17, 26 February 2012 (UTC)
- @Marcus, as always, you can explore around if there is an other solution or a new plug in. What I got 6 months ago was a 'Line creator', a function creating a line for all point with an altitude of 200m. This was actually not helpful, especially since most of these lines were open.
Yug
(talk) 18:48, 26 February 2012 (UTC)
- The main benefit of Open Source is, of course, that it is free and often involves a lot of developers directing the software to suit many applications based on demand for greater functionality. The downside is that it only goes as fast as those developers can be bothered to work.. being unpaid means they don't necessarily reel out new updates weekly/monthly/quarterly, and the lack of commercial income, i.e. funding, means they don't always have the same interest in providing dedicated support, because the loss of a user isn't a lost paying customer. So it can be hard to press programmers into volunteering their efforts to making plugins, etc when other members of the team are not pulling their weight to develop the core, other plugins, etc at the same pace. I notice QGIS has a roughly "once a year" major release pattern, which is about the same as Adobe CS products, but imo quite slow when you consider how quickly hardware, OSs, and other technology moves. QGIS seems good at first, but feels very slow and lacking in many areas which I'm sure could be improved a great deal. I just noticed, whilst writing this, that version 1.7.4 was released a week ago.. so I need to update. Ma®©usBritish[ chat 19:22, 26 February 2012 (UTC)
- @Marcus, as always, you can explore around if there is an other solution or a new plug in. What I got 6 months ago was a 'Line creator', a function creating a line for all point with an altitude of 200m. This was actually not helpful, especially since most of these lines were open.
Yug
(talk) 18:48, 26 February 2012 (UTC)
- I agree with that, I find it irritating that we have to have one raster layer in an otherwise pure vector image.--
Nilf
anion (
talk) 17:17, 26 February 2012 (UTC)
- There is a plugin, SimpleSVG, which may include this function soon. We need to push the programmers into this direction.
Yug
(talk) 15:18, 26 February 2012 (UTC)
- Incidentally, the map of Korea is not a full vectorisation; as it still contains a raster element (the relief shading). It would be good if the tutorials provided a mechanism for vectorising that too - I'd imagine a similar process to that above but even more tedious (unless automated somehow).--
Nilf
anion (
talk) 11:54, 26 February 2012 (UTC)
- Ah, I see. No I didn't test the plugin with anything but rasters; I have some shapefiles but they were not used. Seems like a fairly long process to go through each altitude, export it, vectorise it, colour it, make it a layer until all the levels form a purely vectorised basemap on which to apply geological features, locations, etc. I'm sure the end result can be brilliant, but it's a shame there is no automated process to do this far faster. I have yet to understand how the Raster Calculator works apart from a couple of very basic tasks. GIS is somewhat specialised work, and as is often the case with such software the pros don't like to publish too many tutorials/guides for amateurs to learn the job and risk taking away their work, as I expect they can charge quite a high price for well produced maps/terrain images, etc. Any guides, tutorials or information you publish is appreciated however. Cheers,
Ma®©usBritish[
chat 10:00, 26 February 2012 (UTC)

I just remember this :
http://www.sourcepole.com/2012/1/16/shaded-relief-maps-with-qgis :
- > QGIS 1.7.4+ > Plugin > Plugin manager > enable 'Raster terrain analysis plugin’
- >> QGIS > Raster->Terrain Analysis->Relief
- >>> Follow the tutorials n⁰1 and n⁰2
- "Also you need to have a very recent build of the QGIS master branch."
- Never tested here (1.7.3), feedbacks welcome ! Yug (talk) 22:22, 26 February 2012 (UTC)
- If you test this way, please add your feedback to its tutorial section, here. Yug (talk) 10:30, 27 February 2012 (UTC) (I'm unable to upgrade to 1.7.4 and to test it myself)
That's also a long work, as for every beautiful work, but if someone is interested to create a "Lord of the Rings"-like map, there are some tutorials :
Have fun : ) Yug (talk) 17:51, 17 February 2012 (UTC)
- Map analysis (layers) & Reflexion:
- Background:
- Water seawave : drawing one seawave, then use Cloning ? Pattern ?
- MapBackgroud: Rectagle minus Planisphere. Pattern ?
- Old paper pattern.
- Landmass :
- Landmass shape: from natural fractal object photograph + black/white contrast.
- Landmass border: 2px, black. +Below: blur black duplicata
- Surrounding waves effects: expand Landmass, empty fill, border 1px, black
- Topographic and climate:
- Guess the Tectonic moves → mountains → hydrographic → rivers ; +world winds & rain shadow → deserts ; sea streams → sailors and fishes.
- Mountains (5 kinds) : Volcanic, Fault-block, Complex/folded, Erosional, Upward → drawing one of each, then use Cloning
- Rivers: ?
- Icons
- Borders (2 kinds) :
- inter-kingdoms → draw all the borders, group (Ctrl+G), make 2 more duplicata (Ctrl+D). Bottom: large 4px, blur, black, line. Middle: 2px, blur, white, line. Top: 1px, no blur, black/brown, doted.
- smaller border → Top: 0.5px, no blur, black/brown, doted.
- Cities: small circle.
- Borders (2 kinds) :
- Labels
- Font ?
- Legend
- Wind rose: to create, brown.
Interesting !! Yug (talk) 18:20, 17 February 2012 (UTC)
- I get a 403 error on the example. Wait.. it works if you go through the
directory. --
Golbez (
talk) 21:50, 17 February 2012 (UTC)
- Should be fixed. In the dir look at the largest one for more details. The PDF is really interesting, especially the images where we see step by step differences. so nice : )
Yug
(talk) 21:54, 17 February 2012 (UTC)
- I spent the last two days browsing deviantart.com's Cartography guild, there are a lot of ways to have more creativity and fun with maps. Yug (talk) 12:15, 18 February 2012 (UTC)
- Should be fixed. In the dir look at the largest one for more details. The PDF is really interesting, especially the images where we see step by step differences. so nice : )
Yug
(talk) 21:54, 17 February 2012 (UTC)
Template {{ Cite GIS}} voted for deletion. Help welcome !
There is a discussion to delete our project template {Cite GIS}. This template is useful for us, supporting our GIS mapmaking push by organizing systematically our GIS/satelite/NASA sources on the Wikipedia:Graphic Lab/Resources/Gis sources and palettes page. These sources make mapmaking a reliable science, with realistic topographic background, and systematically well geo-localized items (see GIS). From what I know, no other {Cite} template can do the job we, mapmakers, request here: introduce systematically these GIS sources and the usefulness for wikimapmakers. 8 fields which are not in {Cite map}. Namely: covered area, datum, projection, size_compressed, size uncompressed (world GIS are about 20 to 100Go files), tile size, tiles total, comments (for mapmakers), editor notes (for the dataset known bugs, limits). These fields are specific to raw materials, to databases files which can reach 100 Go, not to end products that are maps (a 2D drawing file). Currently, the fate of this template is voted by NON-cartographer. Also, your input will be welcome ! Yug (talk) 20:43, 3 March 2012 (UTC)
- PS: they suggest merging with {{ cite map}}, which may be considered, but not workable right now. Also, deletion is NOT acceptable. Yug (talk) 20:45, 3 March 2012 (UTC)
Cheers, the tutorial for basic SVG mapmaking is ready : File:Tutorial-cartography_(basic).svg , that allow people with basic or no SVG skills to do nice SVG maps, and the first feedbacks are enthousiastic : ) It would be nice to tell people interested by cartography read it. What else on GIS push side ? Marcus launched an interesting talk and we thus made some progress. We are now about 5 graphists (--slowly--) who recently dogged into GIS mapmaking, that's good. I also saw GIS maps made by non-Graphic Lab users, so I started to invite them here and encourage them to give us their input. We need their advices ! If you meet some great mapmaker, drop them an invitation to join us on the WP:GL/MAP. This is to build a great cartographer team. Next, it will be need to move on the real battle field, there are many requests to check and to try. We will do a part of them ! and improve that way : ) That sound good. Cheers ! Yug (talk) 09:51, 18 March 2012 (UTC)
Need Help with Distribution Maps for Wikiproject Birds
Few WP articles on migratory birds of the western hemisphere have adequate distribution maps per the project's guidelines. I am updating articles on American swallows and swifts beginning with the Chimney Swift. Distribution maps are relatively simple, outlines of the continents and countries/states/provinces with the breeding and wintering ranges of a bird species highlighted in standard colors. Most print and on-line bird guides contain distribution maps. An example is the AllAboutBirds Chimney Swift article. Most of the print and on-line maps were produced in the mid to late 20th century and, for the species in which I am most interested, are out of date. If you go to the AllAboutBirds Chimney Swift article, click on "View dynamic map of eBird sightings" just below the map that is included. Note that Chimney Swifts are now commonly sited in Idaho, Arizona and parts of California. That breeding distribution is confirmed by the USGS Breeding bird survey data. In addition, the South American distribution is wider than previously shown. Creating an accurate distribution map that is current based on raw data should violate neither WP:SYNTH nor WP:NOR, in my opinion. Please correct me if I'm wrong.
I have no background in cartography. If someone here can point me to large outline maps of the western hemisphere that include outlines of countries/provinces/states, I may be able to use the GIMP to trace outlines and fill in distribution maps. A revision of the Chimney Swift article is slowly growing in my sandbox. I would appreciate help from those more experienced dealing with maps. Thanks in advance, DocTree ( talk) 04:23, 2 June 2012 (UTC)
I put in a request a few months ago for a location map for the USSR, which wasn't fulfilled. Meanwhile someone has made one on commons, but it hasn't been done using GIS software, doesn't have co-ordinates and probably isn't right. I really need a location map for the Main Centre for Missile Attack Warning article so I've sat down and tried to work out how to make one. The tutorials don't cover these and I cannot find the standards anywhere, never mind a tutorial. Is this key in German the standard to follow? Does anyone know how the differing line widths are defined? Is there a tutorial on making location maps anywhere, even in French or German? I'm finding this really frustrating! Thanks. Secretlondon ( talk) 22:04, 23 June 2012 (UTC)
- Any map can be used as a location map. The secret is in the Wikipedia template and not in the map itself. You basically define the longitudes and latitudes that match the maps edges and the template will automatically calculate the x,y when you enter the coordinates for a city. The only catch is, this will work only for maps with cylindrical projection, which keeps the parallels and meridians as straight horizontal and vertical lines. For Canada, Russia and the USSR, very large countries at very high latitudes, cylindrical projection creates extreme distortion, that's why other types of projection are usually used for these countries. This complicates the calculation process, See for example the difference in the formula between Template:Location map Russia and Template:Location map Spain. Apparently users still active here cannot help you.
- I'd suggest you post your request to the or directly ask one of the regular contributors there (you can try who's one of the active regulars). The German workshop have more mappers and excellent ones at that. Most probably you'll have more luck there and they might be able to provide both political and relief maps. If for some reason you don't find a response there, you can come back here or post on my talk page and I'll try to concoct something for you using available Commons maps (not a location map, a normal one just for the missile warning article).
- It seems, by the way, that most of the USSR maps we have now are of low quality and even wrong (esp. historical borders of East Germany, Czechoslovakia, Yugoslavia, and the extent of Aral sea) so any good quality map will be a huge improvement.
- Hope that helps. Cheers! --
Orionist ★
talk 13:36, 24 June 2012 (UTC)
- Thanks for your help. By following the tutorial I've got a vector map out of QGIS (and should be able to do a relief map too). It's how to work with it that I'm stuck with now.
Secretlondon (
talk) 20:14, 24 June 2012 (UTC)
- I see you went with equirectangular projection (which is easier to implement but very distorted). But your map is messing the parts east of 180 long. For that, you might want to have a look at
Template:Location_map_Russia_(equirectangular), it has some instructions on how to get a 180 crossing template to work. You might also want to remove administrative divisions of neighboring countries, as the map looks very crowded.--
Orionist ★
talk 08:20, 25 June 2012 (UTC)
- Thanks again! It looks like the current maps we have are using the edcp projection - do you know how to select that in QGIS? There's nothing in the list of projections - does it have another name? I'd modify File:Russia edcp location map.svg but it misses out some of Ukraine, and some of the south. I've no idea where the formulas come from so borrowing them from another template is appealing. Secretlondon ( talk) 04:08, 26 June 2012 (UTC)
- I see you went with equirectangular projection (which is easier to implement but very distorted). But your map is messing the parts east of 180 long. For that, you might want to have a look at
Template:Location_map_Russia_(equirectangular), it has some instructions on how to get a 180 crossing template to work. You might also want to remove administrative divisions of neighboring countries, as the map looks very crowded.--
Orionist ★
talk 08:20, 25 June 2012 (UTC)
- Thanks for your help. By following the tutorial I've got a vector map out of QGIS (and should be able to do a relief map too). It's how to work with it that I'm stuck with now.
Secretlondon (
talk) 20:14, 24 June 2012 (UTC)
What does it mean when a request is tagged by a bot as Stale? -- DThomsen8 ( talk) 17:22, 28 October 2012 (UTC)
- Qualitatively: that means no one have edited the request for a while, so the request is not progressing. That's a soft encouragement to take the request.
- Quantitatively, I don't remember after how many days of inactivity this template is pasted in. Yug (talk) 20:02, 28 October 2012 (UTC)
Hello! I have posted a draft of an Individual Engagement Grant titled GIS and Cartography in Wikimedia. The grant calls for increased contributions of map content to Wikimedia projects through outreach to GIS and cartography communities that are currently not exposed to the idea and practice of contributing content to Wikimedia. This will be led by Darin Jensen, the Department Cartographer and a Continuing Lecturer in UC Berkeley’s geography department and Evelyn Hammid (myself), a UC Berkeley geography student and Wikipedia editor. We will recruit GIS and cartography courses in colleges, universities and possibly high schools into the US Education Program and assist these classes in contributing their projects to Wikimedia. We will also conduct outreach to GIS and cartography communities outside of schools to encourage freely licensed map contributions. If you are interested in this project or have any questions or concerns, please take a look at the draft and comment on the discussion page. Thank you and I look forward to hearing from you. EHammid ( talk) 04:49, 16 February 2013 (UTC)
Over at Talk:M4 motorway there is a discussion (between non-graphics experts) on how best to show the episodic construction of the motorway, in non-continuous stretches over time. At present there is a blocky, some would say confusing and valueless, diagram attempting to show this. I have suggested an animated map, which would require an expert here to devise it - something like this would do the job. It would be very helpful if a graphics expert or two could input to that discussion, with some ideas as to what best could be done. Thanks. Ghmyrtle ( talk) 10:31, 16 March 2013 (UTC)
Hi! Can anyone make a position map about Firenze? - Hujber Tünde ( talk) 20:06, 23 March 2013 (UTC)
- I think you're talking about the city of
Florence? If so you can find many maps in the related Commons category
Category:Maps of Florence. If you meant the
Province of Florence then you can find a location map in its article. If you can't find what you need in those places, can you be more specific, or give us an example of the type of map you want? Cheers! --
Orionist ★
talk 04:08, 24 March 2013 (UTC)
- Sorry! Of course I talk about the city of Florence, in Italy. I need a map I can use in the infobox of buildings, statues, squares, etc. located in this town. Can you help me? -
Hujber Tünde (
talk) 13:05, 24 March 2013 (UTC)
- Why don't you take a map from openstreetmap.org. You can download it in png. or svg.
Wereldburger758 (
talk) 13:50, 24 March 2013 (UTC)
- Because I don't know that site and I don't know how to use it and how to make a position map. - Hujber Tünde ( talk) 18:49, 24 March 2013 (UTC)
- Why don't you take a map from openstreetmap.org. You can download it in png. or svg.
Wereldburger758 (
talk) 13:50, 24 March 2013 (UTC)
- Sorry! Of course I talk about the city of Florence, in Italy. I need a map I can use in the infobox of buildings, statues, squares, etc. located in this town. Can you help me? -
Hujber Tünde (
talk) 13:05, 24 March 2013 (UTC)
- This request is now at the workshop page. I moved it there to work on it properly. -- Orionist ★ talk 22:04, 24 March 2013 (UTC)
I'm new to the map world, and I'm not ready to make an official map request just yet. What I'd love to know is if it would be possible to make a fairly simple map of the state of Colorado ( File:USA Colorado location map.svg) that has the path shown in this photo: here. I apologize for it being so tiny, it's from a 1964 document on JStor and is probably copyrighted. Please note that only the dotted trail (not the dashed) would be required, and I've shown more of the surrounding states than needed to give the mapmaker a sense of direction. I've seen the cool location maps with floating dots on them, but I wasn't sure how an actual trail would be produced. Is this feasible? Again, not a formal request just yet. – Kerαunoςcopia◁ gala xies 19:05, 8 April 2013 (UTC)
In the map at http://upload.wikimedia.org/wikipedia/commons/7/77/SMOM_relations.svg, Canada is coloured orange based on relations with SMOM other than diplomatic (e.g., postal system cooperation). The English article on SMOM mentions that this situation exists for both Canada and Mongolia. Therefore, should Mongolia not also be coloured orange?
Jeff in CA 18:47, 22 April 2013 (UTC)
I am looking for a .svg map of Asia with countries grouped for easy colouring (Philippines is a pain to do manually). The following map uses th
http://commons.wikimedia.org/wiki/File:Location_Map_Asia.svg
However, countries don't appear to be grouped. I found one which has countries grouped, but it isn't the same projection or look.
http://commons.wikimedia.org/wiki/File:Asia_countries-gray.svg
Are you aware of any other .svg maps of Asia with countries grouped for easy colouring?
Thank you.
Anyanghaseyo ( talk) 19:43, 30 May 2013 (UTC)
- What's wrong with Asia_countries-gray.svg? Its projection actually looks much better than Location_Map_Asia.svg (which seems to be cut from the world map in Robinson projection). Hellerick ( talk) 09:01, 3 June 2013 (UTC)
Nothing has been produced for months - what's the problem here? Roger (Dodger67) ( talk) 10:26, 5 August 2013 (UTC)
- The problem is that we don't have any cartographers, we've never had more than 1 or 2 at a time. I've been too busy to take requests. Kmusser ( talk) 14:34, 5 August 2013 (UTC)
Ok! So about a five days ago I put a request in for a new map of the Sasanian Empire or at least an improved version of my map of the Sasanian Empire that I made. See here: http://en.wikipedia.org/wiki/Wikipedia:Graphics_Lab/Map_workshop#New_Sasanian_Empire_Map.21 So far no Graphist has responded to the request at all. I am not sure if the Graphists are supposed to make a response and the Cartographers make the maps after the response or if the Cartographers make see the request and make decide to go ahead and make the map while leaving no response to the user who requested it. I do not mean to sound rude if I am, but I was just wondering why no one has responded to my map request. Regards. Keeby101 ( talk) 05:54, 20 August 2013 (UTC)
|
As noticed upper, we lack PNG or SVG cartographers ! It's time to call for users, graphists, who may be interested in map making and to get some graphic competences ! Images, maps are one of Wikipedia's sides where we can contribute with fun while getting graphist skills. We do have ressources (location maps! SVG map tutorial) which allow to satisfy most requests. Yet, we have to connect them more with potential cartographers. Let's push for more clarity while calling for graphists to get involve. If need, let's reset the list of requests, wipe it, keep a hand of successful and pretty cases, so we restart on a fresh and clean ground. Yug (talk) 06:07, 21 August 2013 (UTC) |
Just updated these {{ User_WikiProject_Maps}} and {User:Scepia/maps} templates. Could be improve ! |
- My push: 1. Map conventions -- I will continue the push in accordance with current and emerging best practices. The toolkit will thus be more coherent and handy. 2. WikiProject Maps main page will get a clean up. Yug (talk) 06:07, 21 August 2013 (UTC)
Thank you so much for getting new cartographers together. I see that they are responding to new requests on the Project page :D . However, sadly there is still no response to my request that I put in... :( Keeby101 ( talk) 05:50, 25 August 2013 (UTC)

I was just curious if the cartographers on the Map Workshop were capable of making a map like the one I linked in the title of this topic, or a map like the File:Kievan_Rus_en.jpg ?

These maps were created with the Generic Mapping Tools: http://gmt.soest.hawaii.edu/ using one or more of these public domain datasets for the relief:
- ETOPO2 (topography/bathymetry): http://www.ngdc.noaa.gov/mgg/global/global.html
- GLOBE (topography): http://www.ngdc.noaa.gov/mgg/topo/gltiles.html
- SRTM (topography): http://www2.jpl.nasa.gov/srtm/
- NaturalEarthData.com/Feature/#Raster Data Themes > 50m-bathymetry
Regards. Keeby101 ( talk) 08:10, 27 August 2013 (UTC)
- Yes, a hand non-english Graphic Lab editors are able to design such maps: NordNordWest, Sting, Bourrichon, Séhmur, myself. There are also a hand of native English speaking cartographers who are able to design such maps but for some reasons they are upload maps on their side, without joining up and showing up their work on the lab. These maps are indeed very elegant and charming, but also quite time consuming depending on both the technology you use and the details you input. I heard some cartographers saying that GMT is quite convenient and rapid to produce such maps. I myself use other ways (QGIS, console : gdal, Gimp for image processing, inkscape) which give more control but need 2 working days do design a such maps. There are lot of trial, fail, redo.
- It would be good to know is those independant cartographers may jump in to share their tips for faster GMT mapmaking. Google may also help you, there are tutorials around. Just need the will to invest a weekend in it for a map which look like you wanted.
Yug
(talk) 08:49, 29 August 2013 (UTC)
- I suspect these guys to be professional cartographers who sometime come to drop a map on commons.
Yug
(talk) 08:51, 29 August 2013 (UTC)
- Héhé ! Profitant de visiter un peu par hasard cette page et de voir ton msg, je te souhaite un petit bonjour à toi Yug depuis mes contrées lointaines ! Toujours pas le temps de me remettre à la carto mais je garde toujours un œil sur WP ! Comment vont les choses sur WP-fr (section carto / vos didacticiels) ? Um abraço do país do samba ! Sting ( talk) 23:21, 29 August 2013 (UTC)
- PS : À voir le sujet précédent je constate avec plaisir que les conventions cartos et les didacticiels ont fait des émules (Ikonact, p.ex.). C'est très bien ! — Preceding unsigned comment added by Sting ( talk • contribs) 23:24, 29 August 2013 (UTC)
- I suspect these guys to be professional cartographers who sometime come to drop a map on commons.
Yug
(talk) 08:51, 29 August 2013 (UTC)
- @Keeby: Oh! Your background data, already processed, is actually already available online :
- Download: NaturalEarthData.com/Feature/#Raster Data Themes > 50m-bathymetry.
- Open in some GIS software ( QGIS)
- Export the area you want as png
- Open png in Inkscape (preferably a vector editor to ease reuse/translations)
- Complete, and send to commons.
- The natural earth data processing should largely speed up your map making. : ]
- Yug (talk) 02:55, 30 August 2013 (UTC)
Ok, on regards to this part:
- Open in some GIS software ( QGIS)
I am having the biggest trouble with that.. Do I open it with the apps, bin, icons, lib, share or etc part of the QGIS Lisboa? I have WinRar and I can't open this damn Natural Earth Data as long as it is stuck in a zipped file called BATH_50M... I need help! :( Keeby101 ( talk) 18:46, 31 August 2013 (UTC)
- Oh.
- 1. You indeed need to unzip first.
- 2. BATH_50M.zip unzip > BATH_50M.psd in Photoshop. (see webpage saying: Rasterized 10m vector polygons in a layered Photoshop file that you can manipulate for color and then save a GeoTIF —use with the provided TFW world file. Optional reference layers include an ocean mask and land shaded relief.)
- Note: The image is very, very, very big. My 2Ghz CPU + Gimp has difficulties to handle it.
- 3. Which OS do you have? Do you have Photoshop ?
- 4. Are you familar the Console ? (may sometimes be easier)
- 5. What are the W,S,E,N border of your area of interest on an plate carrée map ? Yug (talk) 06:45, 1 September 2013 (UTC)
I do not have Photoshop. I have Quantum GIS Lisbona. I know how to use Photoshop very well and I might just download it because Quantum GIS Lisbona is not working out quite the way I planned. I am not familiar with Console. On regards to the W,S,E,N border of my area of interest on a plate carree map, It would be the entire Middle-east/Central Asia area that would also include Egypt.
Also, do I need Photoshop to create the type of maps that I want to make? Do I need Photoshop to unzip BATH_50M.zip? Is it easier to create these advanced maps with Photoshop?
Regards. :) Keeby101 ( talk) 03:16, 2 September 2013 (UTC)
Nevermind, I got it on Photoshop and unzipped. All that I am asking is how did you all make the colors so bright on the Khazar map? I try using yellow, orange and red and all that I can get is dark yellow, semi-dark red and dark orange.... Can anyone help? What tools on Photoshop did you all use to create the countries on those maps? I really need to know! Regards. -- Keeby101 ( talk) 15:43, 2 September 2013 (UTC)
P.S. Yug, I took your advice and went on to Google images as well as looked at sources such as Cambridge Ancient History. They were very reliable, but none of the less, I need a response to what I posted above soon. Cheers! :) Keeby101 ( talk) 07:29, 5 September 2013 (UTC)
- Hello Keeby. First upload your current work to commons and share the link, so we may actually see and guide your progress. I don't have photoshop myself. Does anyone have Photoshop around ? Yug (talk) 05:49, 13 September 2013 (UTC)
Here it is: https://commons.wikimedia.org/wiki/File:The_Sasanian_Empire_expansion_%28prototype%29.jpg Remember, it's a prototype. Given that I have not managed to find and use the coloring and editing tools you all use. Regards. :) Keeby101 ( talk) 20:48, 16 September 2013 (UTC)
- @Keeby: you are going the right way ! I moved your work on the map workshop page, there. Let's keep the talk there from now.
- @others: any idea how to improve Keeby's shaded relief ? Come over to see how he manage and want could be done. Yug (talk) 14:25, 17 September 2013 (UTC)
I hope I'm not opening up a can of worms here... In investigating a map request, I checked a couple SVG locator maps in Illinois. While the PNG thumbnails for these images worked, opening the SVG only produced the red box of the located county, with no other county outlines or state outlines. I expanded my search further out, and found that all the county locator maps of all (so far as I've checked) would not render properly. Since I use Chrome, I decided to check other browsers. Firefox also produced the bad image, while IE did produce a fully rendered SVG image. So I decided to check the images with the W3C validator, and the SVGs are not properly formatted. Do these ALL need to be corrected? As a test case, I worked up an updated SVG image: file:Jo Daviess County Illinois map test.svg, to compare with the old version: file:Map of Illinois highlighting Jo Daviess County.svg.
- Since our objective is to provide in-article maps, I would say we don't *have to* fix that. Maps are properly rendered in PNG, end users are satisfied, priority is low. There is also a US location maps guideline & project designed by user:Shereth which was planing to programmatically redraw all these maps. It may be good to support and complete this last project, so all these maps are updated. Yug (talk) 11:56, 11 September 2013 (UTC)
Hello all
As you may know, I have been involve for years into the Graphic Labs as well as its Map workshops. I've been mainly busy with connecting the French, English, German, Spanish labs so best GIS resources, practices and toolboxes are shared, but also synchronized so we all work more efficiently and with similar color-schemes. At the Map labs, we've been aware for years that the heavy part of an high quality maps is an accurate GIS based background (base map), while on the other hand the added value is actually within the encyclopedic facts we select to hand-draw into the map's semantic layer. We also had talks dreaming about a centralized, automatic system to design these base map, and which could update them ALL whenever we update our map guidelines, or whenever a new country is created (remember South Sudan? with article editors suggesting us to redraw ALL wikipedia's Africa and world maps ?!). It appears we now have the technologies, skills sets, proof of concepts, a road-map and a proposal to do so.
User:Planemad, who created the first map toolbox about 2006, today a webdevelopper, and myself (
User:Yug), who created the Labs, maintains our map conventions up to best practices, and pushe for GIS map making are both, as Wikicartographers, deeply aware of the difficulty and needs we have. Having both map making oriented coding skills (JS, D3js, topojson, Makefile, gdal, wikidata), we've been busy along these 3 past months exploring to possibility to create a such system. It is now within reach. We can data-mine the name and bounding boxes of all administrative areas, then generate SVG location_map and relief_location_maps for each of them according to our map guidelines. Generated maps will also be strictly & consistently XML coded, opening the way for interactive maps. The vision sound great and doable on short term, Engineers at the
WMF encouraged us to applied for a Wikimedia Foundation Grant request, so we did it, and there it is:
Due to the scale and complexity of the project, the total grant request is for an amount of USD 10500, which will allow both of us to work on this project full time for a period of 3 months to really get it DONE. The grant also includes a budget to hire external consultants where required to accomplish the stated goals. We want to provide first some thousands elegant basemaps for all countries and provinces of the world, but more importantly, we want to provide a open source centralized system able to easily update all these maps. Secondly, if you graphists and cartographers provide this system with a title and a WNES bounding box (West/North/East/South, decimal degrees), the system will give you back within minutes both a location_map and relief_location_maps of the area, so we could focus on designing the encyclopedic layers. We fight for that. The proof of concept were GIS+D3js result into a nice SVG wikimaps is
here (Yug), an example of Wikidata-connected multilingual interactive map is
there (Planemad), and this kind of stuff sound just handsome. Wikidata open interesting doors, especially in the direction of multilingualism and gradient maps.
What you can do: The WMF grant jury have some central criteria. They want to know :
- will/does these basemaps will help you -graphists and cartographers- to design high quality maps ?
- What do you think about this idea ? The project goals currently focus on 2 styles : lat/long location_map and relief_location_maps.
- But our code will be open source, so you will be able to hack it, add some few code :
- to generate other layers, gdal give promising hints for shaded reliefs, in bitmap or SVG.
- to generate other projections. D3js give us promising hints for orthogonal projections, and it seems possible to have odds projections such Albert_conic & Co for polar areas.
- to integrate other GIS data, such animal ranges, etc.
The project also need your support there:
meta:Grants:IEG/Wikimaps_Atlas#Endorsements
Last note: While the project will mainly rely on Planemad and myself, it is a Map workshop project, we need this support and system to smooth our cartographic work. So I wish to keep it within the map workshop, sharing GIS tricks, resources, ideas. Fight !
Yug
(talk) 09:43, 19 October 2013 (UTC)
-
 locator_map: USA_location_map + focus and red on Hawaii (2009 guidelines)
 -
 location_map (2009 guidelines)
 -
 relief_location_map
 -
 _(orthographic_projection).svg
 -
 _location_map.svg (2009 guidelines)
 -
 _locator_map.svg : India_location_map + focus and red on Maharashtra (2009 scheme)
 -
 _relief_location_map
_(US50)_(-grid).svg)


.svg)

.svg)

Hi members of Graphics Lab,
ShareMap is a collaborative map creation tool and is currently applying for Wikimedia grant to continue project development.
There is already dozens of maps created with ShareMap, you can see them all here:
We will be very happy for endorsement, opinions or even criticism from all community members on Wikimedia grant project.
The ShareMap idea is perfectly coordinated with other project requesting for grant meta:Grants:IEG/Wikimaps_Atlas. All Wikimaps Atlas scripts and practices can be easile reused within data generated from ShareMap to generate pixel perfect map from user contributions.
Both the Wikimaps and Sharemaps grant requests are coordinated. Wikimaps are for short term, stand alone maps, which perfectly fit in current wikipedia cartographers' practices. Sharemap is actually a long term, but more powerful cloud approach, which is the future of in-wikipedia map making. Both initiatives may also eventually merge, thus recycling hundreds high quality SVG maps. Most importantly for now, both initiative need your support. Yug
If you would like to learn more about ShareMap project please visit:


.svg)
.jpg&action=edit&redlink=1)
![[1]](/info/en/?search=United_States#/media/File:USA_orthographic.svg)
![[3]](/info/en/?search=File:Russian_map_of_Su-24_shootdown_by_Turkey.png)
.svg)
-- Jkan997 ( talk) 11:18, 22 October 2013 (UTC)
- Hello all. I'am happy to confirm. Jacob and his partner have made an amazing job at http://Sharemap.org and have from the beginning asked advices to satisfy Wikipedia map making needs. Recently, Jacob and myself have been coordinating to make these 2 grants requests (Wiki Atlas & Sharemap), which will assist cartographers by satisfying 2 different needs. These 2 grants requests are the first ones from & for the wikigraphists, for images & maps within the Wikipedia. We indeed want the Wikimedia foundation to start to take illustrations seriously, to invest a bit for images and graphic design, and maps are first. These 2 grants request are still in competitions with ~30 others grant request, mainly about articles' textual content and community management, where the WMF spend most of its IE Grants' money. All grant request will not get validated and founded, these 2 IEG request need your support so one or 2 of these heavy projects get founded and really achieved. Yug (talk) 15:51, 22 October 2013 (UTC)
Hello all,
I don't know why, nor what happened, but thanks to
Begoon,
Tobias (and Keeby101!), for the first time the English map workshop cartographers designs great GIS maps. We start to be serious about cartography, that's nice, time to the English speaking to kick back : ] From recent works I though about some tricks which may be useful to know.
- Upload an SVG to check the end result. SVG are better for later translationss. But you probably noticed that MediaWiki use a SVG-to-PNG renderer so Wikipedia article display .png miniatures, which, for sure, all web-browser can a handle. So... your perfect SVG when on your computer, while moved to commons and associated with PNG versions, mays now have some tiny changes and annoying little bugs. Typically, the renderer have difficulties with fonts, so your labels may get a bit bigger and out of the frame (in the rendered png). The German cartographerd thus upload png that no one can reedit. The French cartographers upload the svg, check what is bugging, then upload a new version which.... can be translated.
- You are the boss of the map you design, take the lead to push your map into the article(s). Sometimes, the user who requested the map just disappears. So when you think your map is better than the current in-article situation, go ahead, push your maps into the article so readers may enjoy it.
- It's important to give a clear name to your maps, generaly File:{TITLE}_{YYYY}_{ERA}_{TYPE}-en.svg , the TITLE can be the article article's title (ex: Serbian Empire), YYYY_ERA the year and era (ex: 1355_CE, ca3000_BC, etc.), the TYPE is generally missing for pure SVG maps but when you do GIS cartography they it may be relief_map (for relief), relief_map-bw (for relief in black & whine), _location_map (for administrative), then the language iso of the wikipedia is important since your maps will likely, some time, be translated. We use -en for English, last is the extension. I think this is within our map toolkits/convention, but not sure (the historical map guideline is poor and should be revamped!). This is actually quick to get.
- When uploading your work, remember to also add templates:
- {Graphic Lab|en|map} (iso and work type without majuscule, for all maps)
- {translation possible} (wonderful tool to ease translation of your work by non-svg editors!)
That's all I can think of for now. I will find some other tricks in coming weeks. If you have any question, please ask & propose some solutions! Yug (talk) 11:17, 1 November 2013 (UTC)
- Thanks for those tips! I didn't know any of those things. It would be cool if we could somehow pull the labels for places from Wikidata into the SVG and people could just translate the item on Wikidata. Maybe in the future :) -- Tobias1984 ( talk) 18:50, 3 November 2013 (UTC)
I'm new here but I do some work in the graphic lab. Now I have been asked if I should be attributed as co author on the images were I have removed different water marks?
They will be used in Ukrainian WLM photos. I have tried to find information on this but haven't found. --
Goran tek-en (
talk) 16:07, 5 December 2013 (UTC)
Many maps on Wikipedia and Commons have lines of latitude and longitude etc. which can cause problems when editing them. (Example:
File:Mollweide projection SW.jpg) Is there any easy way to remove such lines? --
Ypnypn (
talk) 21:18, 12 December 2013 (UTC)
- Not when it's a bitmap image (jpg, png, gif) like this one. You have to retouch every pixel where there is a line and depending on the image it can be more or less time consuming and difficult, but it always takes time. -- Goran tek-en ( talk) 23:27, 12 December 2013 (UTC)
All new location map definitions should be created at Module:Location map/data/place name, rather than at Template:Location map place name. For further details, see the updated instructions at Template:Location map/Creating a new map definition. (Note that if all you do is make the images and let someone else set them up, this doesn't apply to you.) Jackmcbarn ( talk) 19:31, 16 April 2014 (UTC)
- This is almost certainly the wrong place for this – but I don't know where is the right place. I have been noticing the very wide disparity of location maps in Wikipedia, and collecting some good examples and some strange examples, with a view to maybe using them in a discussion about location maps. My collection is
here. I will welcome any comments.
Maproom (
talk) 20:13, 16 April 2014 (UTC)
- That really doesn't have anything to do with what I posted, so I've changed its heading to level 2. Jackmcbarn ( talk) 20:18, 16 April 2014 (UTC)
The map at File:Mashonaland East districts.png has an obvious labeling error. It lists two districts as "Murehwa". Prior to 1982 Murehwa District was split into a reduced Murehwa District to the south and the Uzumba-Maramba-Pfungwe or UMP District to the northwest. This can be seen on the larger map: Davies, D. Hywel; Wheeler, R. G. "Zimbabwe Administrative Areas (as used for the basis of the Enumeration Areas for the Population Census of 1982)". Central Statistical Office, the Department of the Surveyor-General, Zimbabwe.. Please could someone correct the image at File:Mashonaland East districts.png. Thanks. -- Bejnar ( talk) 15:33, 19 April 2014 (UTC)
- This can be seen, with some interpretation, on the constituency map at File:Mashonaland East-constituency2008.gif and on the UN-OCHA map of Uzumba-Maramba-Pfungwe, and most clearly at the maps at http://www.mapmakerdata.co.uk.s3-website-eu-west-1.amazonaws.com/library/stacks/Africa/Zimbabwe/Mashonaland%20East/index.htm. -- Bejnar ( talk) 15:47, 19 April 2014 (UTC)
Hello,
I´ve been making KML files using Directions in Google Maps, that way I don´t have to draw the route but I simply use the routes that Google draws for me. When I´m done, I download it as a KML-file, which simply is a big list of coordinates. Am I allowed to use this functionality, as you can see I only use raw data, no imagery. An example of a road for which I made a KML using Google Maps directions is Idaho State Highway 28 Thewombatguru ( talk) 20:09, 13 May 2014 (UTC)
- Data is not copyrightable in the US; this is why, to some extent, the GL exists as to recreate figures based on uncopyrightable data in a free license form. In the UK or other places , sweat of the brow may allow such to be copyrightable.
- While a database can be copyrighted if there is sufficient creativity involved in it, the creation of the KML file - an XML-coded list of coordinates - is not sufficient for that. --
MASEM (
t) 21:58, 13 May 2014 (UTC)
- Excellent answer
Masem. I'd just add that because all Wikipedia's maps are hosted by Wikimedia servers based in the US, the underlying data is not copyrightable. The situation is different in other jurisdictions (for example in the UK
Crown copyright applies to all
Ordnance survey data). However,
OpenStreetMap data is licensed for use under the
ODBL across all jurisdictions. There are also free tools like
Maperative available which will convert XML data to SVG, which makes life much easier.
Philg88 ♦
talk 08:09, 14 May 2014 (UTC)
- Thank you for that
User:Philg88. That tool just eliminated the painful process of dealing with qgis to convert my KMLs to svg. -
Floydian
τ
¢ 23:18, 19 May 2014 (UTC)
- You're welcome, Floydian. There are also some useful things that you can do vis-a-vis KML/XML with JOSM and the OpenData plugin. Ignore the OpenStreetMap functionality and just use local files. Cheers, Philg88 ♦ talk 05:18, 20 May 2014 (UTC)
- Thank you for that
User:Philg88. That tool just eliminated the painful process of dealing with qgis to convert my KMLs to svg. -
Floydian
τ
¢ 23:18, 19 May 2014 (UTC)
- Excellent answer
Masem. I'd just add that because all Wikipedia's maps are hosted by Wikimedia servers based in the US, the underlying data is not copyrightable. The situation is different in other jurisdictions (for example in the UK
Crown copyright applies to all
Ordnance survey data). However,
OpenStreetMap data is licensed for use under the
ODBL across all jurisdictions. There are also free tools like
Maperative available which will convert XML data to SVG, which makes life much easier.
Philg88 ♦
talk 08:09, 14 May 2014 (UTC)

This question is rather tentative as I really don't know whether this has been endlessly discussed nor do I want to insult people who've done a lot of hard work. But generally Google (and a whole host of others) have the edge on anything in Wikipedia because they use Ajax to be able to scale a map at will. For instance, the map shown isn't a bad attempt to show a locality within a larger one, but it really doesn't work. (Could you guess where it is or what it shows?) I usually have to click on the coordinates to get to Google or OSM at this point. And there are probably thousands of such carefully drawn maps in WP. Might it not be possible to use scaleable OSM maps directly (with a sensible initial scaling) to do better? Chris55 ( talk) 14:35, 12 August 2014 (UTC)
-
Chris, this issue is know be wikipedia "volunteer" community there reach its limits. Using OSM is tricky :
- Direct embeding of OSM data is staled since Wikipedia doesn't want to let any other web company, even OSM.org, to see your IP. (privacy)
- Rebuilding locally OSM needs technical expertise, and Human Ressources investment haven't been done... aside of passionate voluteers who lead the "Wikimaps" initiative, which gather tons of good will, but where each member work on his spare time.
- OSM data itself is actually messy. For the past 3 years, National GIS agencies started to open their data, allowing dump of accurates polygons into OSM, which sharp increased OSM quality for these countries. But this coverage is very unequal, so we can't trust OSM for a world wide project.
- The Wikiatlas project that I lead is a recent project to bridge a bit Wikicartographers best practices (map guidelines) and available GIS data (NASA, NaturalEarthData.org, OSM), together with smart technologies (D3js, Make). But we reach humans, and sources limits. As we are just 2 paid students and open GIS resources are still unstable as we go from Countries (L0) to Provinces (L1) levels. Natural earth data just revamped this L1 level, and injected some misunderstanding (L2 levels as L1 for France!).
- To make it short, the field is not mature enough on the Open GIS side and Wikipedia haven't invest enough to make the best of available resources.
Yug
(talk) 15:31, 21 August 2014 (UTC)
- Glad to see there's someone interested! I don't do twitter I'm afraid so I'm not clear about your project. But I realised that English Wikipedia is not the only place this would be discussed and a fair bit of work has been done on Meta, particularly
OpenStreetMap (the
Wikiatlas project is clearly different to yours). The Germans contributed money for a toolserver project but that all seemed to happen in 2009 and very little has matured since. I can understand that OSM is best for N.Am. & Europe, but won't that be the case for any open project? I can also understand that Wikimedia would not want to depend on external servers, but OSM material can be periodically dumped to a Wiki server and can therefore be independent day-to-day. I see there is at least
one example of an OSM layer on the English Wiki but that's not exactly what I think is needed. The OSM terminology is '
slippy maps' and
at least one person has experimented with them on a Wiki. OSM also has a
MediaWiki extension for simple maps which must have the simplest syntax:
- <map lat="51.485" lon="-0.15" z="11" w="300" h="200" format="jpeg" />
- inserts a map which can be clicked on to make it full page. So the ideas are around. Maybe just more resources and urgency are needed. Chris55 ( talk) 09:44, 22 August 2014 (UTC)
- Glad to see there's someone interested! I don't do twitter I'm afraid so I'm not clear about your project. But I realised that English Wikipedia is not the only place this would be discussed and a fair bit of work has been done on Meta, particularly
OpenStreetMap (the
Wikiatlas project is clearly different to yours). The Germans contributed money for a toolserver project but that all seemed to happen in 2009 and very little has matured since. I can understand that OSM is best for N.Am. & Europe, but won't that be the case for any open project? I can also understand that Wikimedia would not want to depend on external servers, but OSM material can be periodically dumped to a Wiki server and can therefore be independent day-to-day. I see there is at least
one example of an OSM layer on the English Wiki but that's not exactly what I think is needed. The OSM terminology is '
slippy maps' and
at least one person has experimented with them on a Wiki. OSM also has a
MediaWiki extension for simple maps which must have the simplest syntax:
- It's a bit pointless my responding 20 months late - but that's Galicia, and it would be better as a location map if it showed the coasts of Portugal and the neighbouring province of Spain, and maybe also the border between them. Maproom ( talk) 20:40, 8 May 2016 (UTC)
There is an open source map competition opened !
- FOSS4G Call for Maps, avant August 31st > Map Submittion Form
Submission is simple but require a NICE GIS MAP ! :) Yug (talk) 15:34, 21 August 2014 (UTC)

Some of the maps used on Wikepidia have a vector format, SVG; some have a raster, or bitmap, format, including .PNG and .JPG (maybe .GIF is still used). It is sometimes claimed that .SVG is uniformly better. In fact each has its advantages, as I shall show with two examples from the current workshop page.
Someone wants the map of Europe to the right changed, making the Crimean peninsula green instead of yellow, as it is now part of Russia. If it were a bitmap this would be easy: draw the border across the Isthmus of Perekop in white, and floodfill the peninsula in green. But this image is SVG, and the SVG format, for good reasons, does not support floodfill. So I have not volunteered to edit this map. I am sure it could be done by someone with the right tools and the knowledge of how to use them, but I lack both.

Someone else wants the map of Switzerland to the left changed, with the country and language names translated from German into English. If this were a sensibly-constructed .SVG, this would also be easy: find strings such as "FRANKREICH" in the file, replace them by "FRANCE" etc., and maybe change their x-position so that they are centred in the right place. But it is a bitmap. The change would involve removing the German names, repairing the damage to the frontiers, rivers, etc. which they overlaid, and writing in the English names, damaging the mountains, rivers etc. again.
It would be good if maps could have all the text represented internally as text as in an .SVG, but the other features in a bitmap format. Then both types of change could be made easily whenever there was a need to maintain or update the map.
This could be achieved as follows. The .SVG format allows an image to contain an embedded bitmap, given in the .SVG file as a url or path/filename of the embedded image. I believe that this would work well, with both files on Commons. The main disadvantage is that one map being two images might confuse editors. An incidental advantage would be that maps like the linguistic map of Switzerland above could be a single bitmap, embedded in an English-language SVG for use in en:Wikipedia, a German-language one for use in de:Wikipedia, etc.
I am tempted to try uploading such a two-file map to Commons, to see if anything goes wrong. Maproom ( talk) 19:57, 10 October 2014 (UTC)

- Well — it didn't quite work. I stripped out the German-language text, and uploaded the result, as seen to the right. Then I wrote a simple English-language .SVG wrapper to include it, which reads
<svg xmlns="http://www.w3.org/2000/svg" xmlns:xlink="http://www.w3.org/1999/xlink">
  <image x="0" y="0" width="1000" height="712"
xlink:href="https://upload.wikimedia.org/wikipedia/commons/9/93/Linguistic_map_of_Switzerland.png" />
  <g style="font-size: 32pt">
    <text x="560" y="50">Germany</text>
    <text x="60" y="280">France</text>
    <text x="770" y="610">Italy</text>
    <text x="860" y="270">Austria</text>
  </g>
  <g style="font-size: 16pt">
    <text x="735" y="290">Liechtenstein</text>
  </g>
  <g style="font-size: 28pt; font-family: sans-serif;">
    <text x="130" y="440">French</text>
    <text x="360" y="270">German</text>
    <text x="560" y="530">Italian</text>
    <text x="670" y="440">Romansh</text>
  </g>
</svg>

and uploaded that. The results are shown below.
I don't understand what went wrong. The same file that I uploaded, with its xlink to its included file on Commons, works on my local computer. Maproom ( talk) 21:25, 10 October 2014 (UTC)
- I now understand what went wrong. I tried repeatedly to upload the file using Chrome. About seven times, it unhelpfully said "Aw, Snap!". Twice, it changed the entry in the edit box for the file I was trying to upload. And once, it succeeded, but I now see that something removed the <image> tag from the SVG, resulting in the text-only image you see to the right.
- Today, I tried with other browsers. They were all more helpful than Chrome, reporting back from Commons "This file contains HTML or script code that may be erroneously interpreted by a web browser. See the FAQ for more information." So it seems that Commons doesn't like image files with embedded image files. I wonder if there's a way around this. Maproom ( talk) 13:03, 11 October 2014 (UTC)
- Encapsulating a raster file within a vector format wrapper is a waste of storage space, a waste of computing power and a total waste of time. Only use an SVG to contain a raster if the effect can only be achieved that way and then only as a last resort. It's a vector format for a reason, and there is no reason whatsoever for an SVG map to contain a PNG version of the map within it. It won't scale like a vector, it won't print like a vector and most likely the map started in vector form in the first place. So please don't upload SVGs with deliberately embedded raster artwork. A Gaussian drop shadow is one thing, but a full map is quite another. -- 64.9.157.30 ( talk) 18:24, 14 October 2014 (UTC)
Hello, is it possible to remove watermarks from a whole batch of SVG-files at once (with a script or tool)? My question is referring to the Commons UNOCHA maps category, which was uploaded with watermarks (against current WP:WATERMARK policy, but that doesn't matter here). After some random checks all identical watermarks seem to be in the lower right corner, either on their own or embedded in a small surrounding box (to create a bit of distance to other map elements). Besides some basic editing skills, I am completely ignorant in more complex image editing - any advice would be appreciated. GermanJoe ( talk) 20:07, 7 November 2014 (UTC)
- At
Wikipedia talk:Image use policy#Clarification needed regarding WP:WATERMARK I suggested the use of
the
visibility="hidden"attribute. -- Redrose64 ( talk) 16:27, 25 November 2014 (UTC)
Just wondered who (if anyone) makes maps still or whether this project is now defunct? The Rambling Man ( talk) 20:34, 16 November 2014 (UTC)
- It's still active, there just aren't as many editors participating as there once were.
Philg88 ♦
talk 20:53, 16 November 2014 (UTC)
- Ok, I guess the fact there are still requests outstanding since April should have given the game away. I guess it's pointless adding further requests since the page is neither maintained nor updated per its own instructions. The Rambling Man ( talk) 21:08, 16 November 2014 (UTC)
Hello cartographers,
The Wikiatlas project is soon delivering its online tool for easier WP map making. We took lot of inspiration and courage from your elegant work and would like to offer one book to some active cartographers of the English workshop :)
Please help me to identify 2 leading wikicartographer here, I will handle the purchase thanks to WMF funding, and amazon may, with luck, deliver to you for Xmas. Also, with lot of geeky admiration, thanks for all and Merry Xmas to you ! -- Yug & Planemad 16:39, 8 December 2014 (UTC)
-
Philg88, any local name coming to your mind ?
Yug
(talk) 00:47, 12 December 2014 (UTC)
- @
Yug: You mean the name of an editor or the name of a book? Cheers,
Philg88 ♦
talk 07:16, 12 December 2014 (UTC)
- I need 2 English wikicartographers names, I'am not here recently and can only think about
user:MapMaster (if you hear us!), who would totally deserve it, but is not active anymore. I admire MapMaster works, yet it would make more sense to encourage emerging map makers. SVG editors working a lot on maps are fine too. Any names in your mind ?
Yug
(talk) 10:27, 12 December 2014 (UTC)
- Well, apart from me, the only recently active editor seems to be
EuroCarGT. I don't know if
Maproom is still around.
Philg88 ♦
talk 17:06, 12 December 2014 (UTC)
-
Philg88, there is
the Xmas tree to talk to ^^. I just sent it to
Goran tek-en since he is maintaining
file:Maps_template-en.svg and design cool svg maps as well. These books are thanks you notes from the community, enjoy !
Yug
(talk) 19:58, 15 December 2014 (UTC)
- Thanks Yug! Apologies to Goran_tek-en for forgetting to mention him and request to Santa duly filed! Best, Philg88 ♦ talk 23:00, 15 December 2014 (UTC)
-
Philg88, there is
the Xmas tree to talk to ^^. I just sent it to
Goran tek-en since he is maintaining
file:Maps_template-en.svg and design cool svg maps as well. These books are thanks you notes from the community, enjoy !
Yug
(talk) 19:58, 15 December 2014 (UTC)
- Well, apart from me, the only recently active editor seems to be
EuroCarGT. I don't know if
Maproom is still around.
Philg88 ♦
talk 17:06, 12 December 2014 (UTC)
- I need 2 English wikicartographers names, I'am not here recently and can only think about
user:MapMaster (if you hear us!), who would totally deserve it, but is not active anymore. I admire MapMaster works, yet it would make more sense to encourage emerging map makers. SVG editors working a lot on maps are fine too. Any names in your mind ?
Yug
(talk) 10:27, 12 December 2014 (UTC)
- @
Yug: You mean the name of an editor or the name of a book? Cheers,
Philg88 ♦
talk 07:16, 12 December 2014 (UTC)
- Books sent ! I did what I could to thanks you back guys. Happy it's underway~ Yug (talk) 13:26, 22 December 2014 (UTC)
Hi. I'm not sure whether this is the place to ask. I would think or at least hope that my question has an easy answer, ha ha.
I want to make a map to place in a Wikipedia article. It would be comparable to File:Map_of_world_countries_by_GDP_(nominal)_in_US$.png
_in_US$.png)
I'm thinking that there must be free software whose input is: 1) a table, each row being the name of a country together with a number, and 2) another table listing colors and data ranges. Then the program would produce a world map colored according to the data.
Can someone suggest some free software to make such maps? Thank you. CountMacula ( talk) 13:22, 11 January 2015 (UTC)
- I'm not aware of any (free) software as simple/user-friendly as what you describe. However, InkScape is free and certainly capable of producing such a map. There is a tutorial at the top of this talk page. If you post a request with the data table and article name of the request page, one of us could easily build it for you. The map used as a source needs to be freely licensed, but that is not a problem. Gaff ( talk) 19:12, 11 January 2015 (UTC)
- Thanks, Gaff! I'll look into Inkscape and try to do it myself. But the font of the cartography tutorial is so small, I can barely read it.
CountMacula (
talk) 20:05, 11 January 2015 (UTC)
- There is a (if you ask me) much more elegant way of doing it using the advantages of svg images. Svg images can be edited by inkscape, but if you simply (really, I had no idea until 2 years ago or so) open the svg file in a text editor (right mouse click; open with .... then choose a text editor) you can also really edit the text. There are a lot of maps that have been prepared to accept colouring by just typing the
ISO 3166 country code. It is simply
- a list like .be, .nl, .us (to colour Belgium, Netherlands and the US; note that there is a point (.) before the country, and a comma (,) between them)
- followed by a colour statement
- {
- opacity: 1;
- fill: orange; [ or to use a hexadecimal colour: you can say fill : #337700; ]
- }
- An example can be found at
File:Arms_Trade_Treaty_status.svg, which you can use as a "scaffold". Just browse down ca 40 lines until you find "/* List of states which have ratified or acceded (green) */" and then start filling in countries.
- just save as an .svg file
- and upload it
- The advantage is that you can be much more exact in colouring, and also take the info easily to an other map, if the world map changes (again...)...
L.tak (
talk) 20:15, 11 January 2015 (UTC)
- That looks like a fine way to do it, L.tak. I believe I will. TYVM! CountMacula ( talk) 09:21, 12 January 2015 (UTC)
- There is a (if you ask me) much more elegant way of doing it using the advantages of svg images. Svg images can be edited by inkscape, but if you simply (really, I had no idea until 2 years ago or so) open the svg file in a text editor (right mouse click; open with .... then choose a text editor) you can also really edit the text. There are a lot of maps that have been prepared to accept colouring by just typing the
ISO 3166 country code. It is simply
- Thanks, Gaff! I'll look into Inkscape and try to do it myself. But the font of the cartography tutorial is so small, I can barely read it.
CountMacula (
talk) 20:05, 11 January 2015 (UTC)
I'm hoping to get my hands on the IUCN Red List range data for all lemur species so that I can update the existing range maps. I'm as green as you can possibly get with QGIS. Just by tinkering with it last night, I managed to learn that all I needed was to obtain SHP files (in the public domain) for Madagascar, the Comoros, and the major rivers (global) and add them along with the IUCN Red List SHP file to a new project—the software automatically puts everything in the right place. I figured out to tweak settings and several other things, and now I just need to export this work to a SVG so that I can polish it off in Inkscape. I found this tutorial, but I'm having a hard time scaling the map in Composer before exporting to SVG. After I choose the option to "Add a new map" and draw the box on the page, the map of Madagascar isn't centered and I can't find a way to center it. Often the Comoros get cut off. I can change the scale (which is hard given that the value is in the millions) but then it often includes unwanted material, like the rivers of Africa. I just can't find an easy way to constrain the map to just the part of the map I want. After that, I can figure everything else out in Inkscape. Any advice? I don't mind corresponding via email if it helps to share files and/or screenshots. – Maky « talk » 09:01, 14 January 2015 (UTC)
- No tips on QGIS? Sorry, but after figuring out 90% of it, I just need help with this last little bit so I can quickly process hundreds of data sets. – Maky « talk » 05:55, 21 January 2015 (UTC)
This is a basic how to use InkScape question, but how can I get rid of the checkerboard background on my maps? Some have them and some don't when viewed in the media viewer. They look fine in the infoboxes. This one is the current map of concern File:Toxostoma longirostre species distribution map.svg. Thanks -- Gaff ( talk) 03:40, 29 January 2015 (UTC)

- @ Gaff: It's not Inkscape, or the way that you draw them. It's the way that partially-transparent SVG files are always drawn on the file description pages. It's there partly to show the maximum extent of an image that might otherwise have no clear boundaries; but it's also there to indicate which portions are unpainted, and therefore transparent. See for example File:First angle projection symbol.svg where I deliberately gave the whole image a white background; compare File:BSicon exLKDSTa.svg which has two colours (pink and white), but no background so that the parts outside the circles are transparent. This transparency is intentional, and means that the image can be overlaid on another, as I did at Template:Mid-Suffolk Light Railway (look for the row marked "Proposed Debenham station" where it is overlaid on File:BSicon exKDSTe.svg).
- The chequered background is not shown when the image is used in the normal way (see right), but only when you are on the file description page. If you're on Commons, it's always there; but in English Wikipedia, it only shows when you hover your mouse over the image - move it away, and the chequered background disappears. Try File:BSicon exLKDSTa.svg (on English Wikipedia) again, and compare c:File:BSicon exLKDSTa.svg which is the same page on Commons. -- Redrose64 ( talk) 11:18, 29 January 2015 (UTC)
A week ago, Giovannibeltran67 made two requests on the project page, asking for maps to be updated to show the status of same-sex marriage in Chile and Finland. The Chile request appears premature, as we have no evidence that the Chilean president has yet ratified the bill into law. I could easily fulfill the Finland request, but only by converting the current SVG to a PNG or GIF, updating it, and uploading it as a new file. I lack the skill to modify the SVG directly. I could edit the SVG if it had comments like <!-- This section is for Finland -->, but it doesn't.
So, should I go ahead and upload an up-to-date PNG or GIF? Or should forget about it and hope that someone skilled in handling SVGs comes along? Maproom ( talk) 22:11, 8 February 2015 (UTC)
- The SSM maps are updated frequently, as various countries and U.S. states pass laws permitting the practice. Updates for these maps are usually proposed on their talk pages on en.wp (not Commons, even though the actual images are on Commons); for example,
File:Same sex marriage map Europe detailed.svg, which I have updated myself, is discussed at
File talk:Same sex marriage map Europe detailed.svg. Updating a SVG is quite easy, use a plain text editor, find the shape and alter its fill colour - for example, when I updated Gibraltar at 17:16, 1 April 2014, I changed one instance of
fill="#CCCCCC"tofill="#0066FF". You can also use an application like Inkscape or Adobe Illustrator, but those tend to bloat the file with metadata (and can damage certain constructs). Altering SVG maps to a raster format (whether PNG or something else) makes reverse conversion extremely difficult. -- Redrose64 ( talk) 22:53, 8 February 2015 (UTC)
I am working to create a new range map for sportive lemurs, replacing the problematic File:Lepilemur distribution.svg that is currently used. This image appears to be a copyright violation, lifted from a 2006 publication. I have recently created a new range map template for endemic Madagascar flora and fauna ( File:Madagascar range map template.svg—open to comments), which I created using both QGIS and Inkscape. (An example map created from this template is File:Phaner_range_map.svg.)
I have the SHP files from the IUCN for all sportive lemurs and can make a better map, but there are over 20 species. Looking at Color Brewer 2.0, the source for our color recommendations, the website suggests colors for up to 12 data sets for qualitative data, but no more. I was wondering if anyone had advice on colors or whether the map should be made at all. – Maky « talk » 20:13, 12 March 2015 (UTC)
- My recommendation would be to split them into two maps, do 13 species on each map, that lets you re-use colors and the results should be easier to read.
Kmusser (
talk) 13:41, 13 March 2015 (UTC)
- Thanks for the reply and suggestion. I did exactly that at the article
True lemur. However, there are occasional overlaps, and I haven't figured out an ideal way of handling them. (See either of the two maps on that page as examples.) What would you suggest? –
Maky «
talk » 16:53, 13 March 2015 (UTC)
- Ideally the overlapped area would be striped with the two overlapping colors, not sure how to do that in SVG though. Another possibility would be giving the color layers a bit of transparency.
Kmusser (
talk) 17:11, 13 March 2015 (UTC)
- Stripes in SVG isn't difficult, see the shapes for Croatia and Hungary at
File:Same sex marriage map Europe detailed.svg. --
Redrose64 (
talk) 17:51, 13 March 2015 (UTC)
- Thanks. I've already played with stripes and transparency. Transparency with two or three slightly overlapping colors was hard to interpret, and stripes didn't work because I kept the areas on separate layers. I guess I'd have to put them on the same layer and do an exclusion or division... or something... and then fill the overlap area with a pattern. The problem is that up to 3 species may overlap the same area very slightly. If you want to experiment with the overlap with orange, blue, and red on this map, you're welcome to. – Maky « talk » 20:27, 13 March 2015 (UTC)
- Stripes in SVG isn't difficult, see the shapes for Croatia and Hungary at
File:Same sex marriage map Europe detailed.svg. --
Redrose64 (
talk) 17:51, 13 March 2015 (UTC)
- Ideally the overlapped area would be striped with the two overlapping colors, not sure how to do that in SVG though. Another possibility would be giving the color layers a bit of transparency.
Kmusser (
talk) 17:11, 13 March 2015 (UTC)
- Thanks for the reply and suggestion. I did exactly that at the article
True lemur. However, there are occasional overlaps, and I haven't figured out an ideal way of handling them. (See either of the two maps on that page as examples.) What would you suggest? –
Maky «
talk » 16:53, 13 March 2015 (UTC)
_range_map.svg)
A technical question about OSM: I want to make a Location map template for a city ( Ljubljana, to be precise) from a screenshot in OSM. Is there an easy way to figure out border coordinates from the browser's interface or must I do it by centering features on all sides and reading their X/Y coordinates? Or maybe there's a more comprehensive way to export the current view in vector format from which those coordinates are evident? Any pointers would be much appreciated. — Yerpo Eh? 09:32, 19 July 2015 (UTC)
- The OSM export function will show you the coordinates of the bounding box you download, which can then be used as the data for the associated location map origin. Philg88 ♦ talk 10:04, 19 July 2015 (UTC)
- Whoa, I didn't even know that existed, thanks. And sorry if a stupid question, but is there any easy way to convert the resulting XML file to a decently-sized (i.e. not huge) SVG? — Yerpo Eh? 10:20, 19 July 2015 (UTC)
- Nevermind, I found the instructions
here. —
Yerpo
Eh? 10:56, 19 July 2015 (UTC)
- @ Yerpo: Try Maperative Does a good job of conversion - see an example here. Philg88 ♦ talk 11:28, 19 July 2015 (UTC)
Can anyone tell me what happened to my request? It just sort of disappeared. I now see it on the bottom of the page but see no way to edit it or even access it. SusunW ( talk) 14:24, 10 August 2015 (UTC)
- It seems as if my request was somehow embedded in the one above it (Golden jackal/African wolf ranges) but I have no idea how that happened--I got no error message--nor how to fix it.
SusunW (
talk) 14:36, 10 August 2015 (UTC)
- I have fixed it. I can't guess how it happened.
Maproom (
talk) 15:07, 10 August 2015 (UTC)
- Thank you. I, who am not remotely technical, had zero clue how it happened or how to fix it.
SusunW (
talk) 15:19, 10 August 2015 (UTC)
- @
SusunW: When
Mariomassone (
talk ·
contribs) made
this request, they omitted the last line, which was the three characters
-->that are used to terminate a HTML comment. -- Redrose64 ( talk) 17:20, 10 August 2015 (UTC)- Redrose64 Thank you! I just assumed it was me. Wikipedia technology and I don't communicate well. LOL I truly appreciate all of you folks who get the coding part as well as those who can do the creative design parts, which makes the articles I write so much better. SusunW ( talk) 17:25, 10 August 2015 (UTC)
- @
SusunW: When
Mariomassone (
talk ·
contribs) made
this request, they omitted the last line, which was the three characters
- Thank you. I, who am not remotely technical, had zero clue how it happened or how to fix it.
SusunW (
talk) 15:19, 10 August 2015 (UTC)
- I have fixed it. I can't guess how it happened.
Maproom (
talk) 15:07, 10 August 2015 (UTC)
- It seems as if my request was somehow embedded in the one above it (Golden jackal/African wolf ranges) but I have no idea how that happened--I got no error message--nor how to fix it.
SusunW (
talk) 14:36, 10 August 2015 (UTC)
Can someone please fix the "Tutorial for begginers" line, because I cannot figure it out.-- DThomsen8 ( talk) 12:37, 30 October 2015 (UTC)
Moved here from the project page
Is anyone in charge of the map icons? If so, consider the following comment. Below is a table of icons I find useful. If you think its worth anything you might want to load it somewhere, change it or whatever. Since this is merely a comment fix anything needed and close. Thank you. Benjamin Trovato ( talk) 23:03, 5 October 2015 (UTC)
Since I seem to be one of the few people who use multiple map icons ( Saskatchewan River fur trade, Russian conquest of the Caucasus), my comments may be of some value. Multiple icons sometimes look sloppy ( Dagestan Uprising (1920)), but give the editor easy control over some parts of the map.
Most icons seem useless and are rarely used ("Crime symbol mobilehome fire80px.png"). There is no index and it is hard to be sure that you have searched all the categories. You usually have to copy several onto a test map to find one that works. Icon names are irregular, hard to remember and usually must be copied with cntl-C ("AS-skrzyzowanie-icon-blau.svg" is a blue X, "NChart-Symbol INT Rock CoverUncover.svg" is the only asterisk I could find ). It might be good to have a table of standard shapes (circle, square, triangle, star...) each in five colors. If they had standard fixed-length names they would be easy to remember and show up better in code. Since F=French is a little clearer than blue=French it might be good to have an icon for each letter and digit, possibly in several colors. It might even be possible to define position=center which would drop the icon and start the label at the lat/long. This would convert 1-letter labels into icons and be more exact ( Russo-Persian War (1804–13)). A set of lines in various directions (line00,line10...lin170 +line45,lin135) would allow drawing lines. They could be lengthened with marksize= but this would thicken then, so it might not work.
Since multiple icons are rarely used there is no reason to do any of this work now, but it might become good in the future. It is not clear whether multiple icons are useless or just hard to use.
icon collection

Hol=transparent interior.
Use marksize=16 to enlarge.
These icons may be good for simple work:
BlkDot=Location dot black.svg YelDot
=Location dot yellow.svg RedDot
=Location dot red.svg BluDot
=Location dot blue.svg BlkHol
=Circle-empty-512px.svg (Hol=transparent interior) RedHol
=Cercle rouge 100%.svg YelCir
=Dot-yellow.svg RedCir
=Red dot.svg BluCir
=Blue-circle.png BlkBox
=Square city locator.png WhtBox
=Thick lined square.svg RedBox
=Point carte.svg BluBox
=Solid blue.svg YelStr
=Map symbol attraction 02.png (off center) BlkEks
=X solid black 17.gif BlkDia
=Filled diamond.svg BluBul
=Blue-circle-concentric.png Arrows
=Pfeil (oben,unten,rechts,links,rechts oben).svg
NoIcon=Clear pog.svg
BigIcn=marksize=16
NoLabl=”label=” or position=none
BigLab=label_size=200
Background=|mark=White flag icon.svg|marksize=16|background=yellow
Icon in caption=caption= <*br/>[*[file:Blue-circle.gif|10px]*]=icon in caption.
Mouseover=label=[*[jail|go to]*]
Dear community, I would like to get your feedback on the future of Wikipedia Maps. As you might have heard, our maps server is now operational, and is used on Wikivoyage and the Android app. We do not yet have enough maps servers to enable it for all Wikipedia articles, in part because we need community to expressly say this is a high priority, in part because community needs to establish what must happen for maps to be adapted, and lastly because we should have a <map> wiki markup to support direct maps usage. Be forewarned that most of our time was spent developing the tiling server, whereas the map itself (style) can use more work - we even have this proposal from a volunteer to help us with it (please support). So, to move ahead, we need:
- Blockers: Decide what changes must happen for maps to be used anywhere in Wikipedia.
- Hopefully this list is short, otherwise it will be tough to allocate substantial resource without a clear community buy-in.
- Labs: Decide on the migration of the map popups at the top of the articles to the new underlying tiles.
- Articles: Decide which capabilities should the <map> tag support.
- Prioritization: Plan which of these features should we work on next. What use cases will be the most valuable from the start?
Please send your general maps feedback, comments, and questions here. Thanks! (originally posted by Yurik (WMF) ( talk) on VP/T), message forwarded by — TheDJ ( talk • contribs) 09:17, 10 November 2015 (UTC)