| STC rapid transit | |||||||||||
 | |||||||||||
| General information | |||||||||||
| Location |
Mexico City Mexico | ||||||||||
| Coordinates | 19°27′42″N 99°03′42″W / 19.461656°N 99.061704°W | ||||||||||
| Line(s) |
| ||||||||||
| Platforms | 1 island platform | ||||||||||
| Tracks | 2 | ||||||||||
| Connections |
| ||||||||||
| Construction | |||||||||||
| Structure type | At grade | ||||||||||
| History | |||||||||||
| Opened | 15 December 2000 | ||||||||||
| Passengers | |||||||||||
| 2022 | 4,442,634
[1] | ||||||||||
| Rank | 95/195 [1] | ||||||||||
| Services | |||||||||||
| |||||||||||
| Location | |||||||||||
|
| |||||||||||
| Area map | |||||||||||
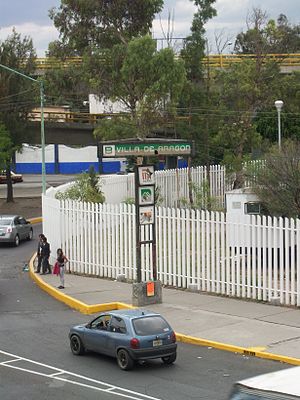
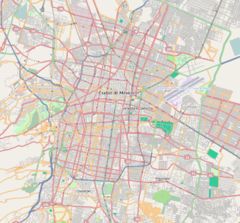
Villa de Aragón is a station on Line B of the Mexico City Metro system. [2] [3] It is located in the Gustavo A. Madero municipality, in the limits with the State of Mexico. In 2019, the station had an average ridership of 14,456 passengers per day. [4]
General information
The station was opened on 15 December 1999 and was the temporary northern terminus of the line, until its expansion towards Ciudad Azteca in November 2000. [5]
Villa de Aragón serves the Villa de Aragón and San Juan de Aragón neighborhoods in the Gustavo A. Madero municipality in the north of Mexico City. [2]
Name and pictogram
The station is located in the Villa de Aragón neighborhood, hence the name. Villa de Aragón's pictogram depicts a collection of houses. [3]
Ridership
| Annual passenger ridership | |||||
|---|---|---|---|---|---|
| Year | Ridership | Average daily | Rank | % change | Ref. |
| 2022 | 4,442,634 | 12,171 | 95/195 | +71.51% | [1] |
| 2021 | 2,590,343 | 7,096 | 121/195 | +126.73% | [6] |
| 2020 | 1,142,478 | 6,215 | 185/195 | −78.84% | [7] |
| 2019 | 5,398,782 | 14,791 | 122/195 | +1.58% | [8] |
| 2018 | 5,314,564 | 14,560 | 122/195 | +5.76% | [9] |
| 2017 | 5,025,145 | 13,767 | 124/195 | −2.38% | [10] |
| 2016 | 5,147,843 | 14,065 | 123/195 | +1.24% | [11] |
| 2015 | 5,084,941 | 13,931 | 119/195 | +2.11% | [12] |
| 2014 | 4,979,959 | 13,643 | 117/195 | −5.97% | [13] |
| 2013 | 5,296,168 | 14,510 | 117/195 | +1.53% | [14] |
| 2012 | 5,216,530 | 14,252 | 123/195 | −0.90% | [15] |
| 2011 | 5,263,844 | 14,421 | 125/175 | +9.31% | [16] |
| 2010 | 4,815,556 | 13,193 | 113/175 | – | [17] |
References
- ^ a b c "Afluencia de estación por línea 2022" [Station traffic per line 2022] (in Spanish). Sistema Transporte Colectivo Metro. 2023. Archived from the original on 5 March 2023. Retrieved 5 March 2023.
- ^ a b "Villa de Aragón" (in Spanish). Metro CDMX. Retrieved 4 April 2020.
- ^ a b Archambault, Richard. "Villa de Aragón » Mexico City Metro System". Retrieved 5 August 2011.
- ^ "Afluencia de estación por línea 2019" (in Spanish). Metro CDMX. Retrieved 4 April 2020.
- ^ Monroy, Marco. Schwandl, Robert (ed.). "Opening Dates for Mexico City's Subway". Retrieved 4 August 2011.
- ^ "Afluencia de estación por línea 2021" [Station traffic per line 2021] (in Spanish). Sistema Transporte Colectivo Metro. 2020. Archived from the original on 7 March 2022. Retrieved 7 March 2022.
- ^ "Afluencia de estación por línea 2020" [Station traffic per line 2020] (in Spanish). Sistema Transporte Colectivo Metro. 2021. Archived from the original on 21 June 2021. Retrieved 21 June 2021.
- ^ "Afluencia de estación por línea 2019" [Station traffic per line 2019] (in Spanish). Sistema Transporte Colectivo Metro. 2020. Archived from the original on 8 April 2020. Retrieved 3 May 2020.
- ^ "Afluencia de estación por línea 2018" [Station traffic per line 2018] (in Spanish). Sistema Transporte Colectivo Metro. 2019. Archived from the original on 6 June 2019. Retrieved 7 April 2020.
- ^ "Afluencia de estación por línea 2017" [Station traffic per line 2017] (in Spanish). Sistema Transporte Colectivo Metro. 2019. Archived from the original on 3 May 2020. Retrieved 3 May 2020.
- ^ "Afluencia de estación por línea 2016" [Station traffic per line 2016] (in Spanish). Sistema Transporte Colectivo Metro. 2017. Archived from the original on 3 May 2020. Retrieved 3 May 2020.
- ^ "Afluencia de estación por línea 2015" [Station traffic per line 2015] (in Spanish). Sistema Transporte Colectivo Metro. 2016. Archived from the original on 3 May 2020. Retrieved 6 May 2020.
- ^ "Afluencia de estación por línea 2014" [Station traffic per line 2014] (in Spanish). Sistema Transporte Colectivo Metro. 2015. Archived from the original on 3 May 2020. Retrieved 6 May 2020.
- ^ "Afluencia de estación por línea 2013" [Station traffic per line 2013] (in Spanish). Sistema Transporte Colectivo Metro. 2014. Archived from the original on 3 May 2020. Retrieved 6 May 2020.
- ^ "Afluencia de estación por línea 2012" [Station traffic per line 2012] (in Spanish). Sistema Transporte Colectivo Metro. 2013. Archived from the original on 3 May 2020. Retrieved 6 May 2020.
- ^ "Afluencia de estación por línea 2011" [Station traffic per line 2011] (in Spanish). Sistema Transporte Colectivo Metro. 2012. Archived from the original on 7 May 2020. Retrieved 6 May 2020.
- ^ "Afluencia de estación por línea 2010" [Station traffic per line 2010] (in Spanish). Sistema Transporte Colectivo Metro. 2011. Archived from the original on 7 May 2020. Retrieved 6 May 2020.
External links
-
 Media related to
Villa de Aragón (station) at Wikimedia Commons
