

Centro Médico ( Spanish: Estación Centro Médico) is an underground metro station on the Mexico City Metro. [2] [3] It is located in the Cuauhtémoc borough of Mexico City. [2] It is a transfer station for both Lines 3 and 9. [2] [3]
General information
The station logo represents the caduceus, a variant of the Rod of Aesculapius, the Greek god of medicine. [2] Its name refers to the Centro Médico Siglo XXI general hospital, located above the metro station. [4] [5] [6] The station opened along Line 3 on 7 June 1980 when Centro Médico served briefly as the southern terminus of that line. [7] Line 3 service then extended further southward toward Zapata a year later by 25 August 1980. [7] The Centro Médico Siglo XXI was almost destroyed by the 1985 earthquake. [8] The station served as the western terminus of Line 9 (which went east towards Pantitlán) starting on 26 August 1987. [7] Westward service on Line 9 toward Tacubaya started a year later on 29 August 1988. [7]
The station is directly connected to the main entrance of Centro Médico by a set of escalators. This metro station has facilities for the handicapped, a cultural display, and an information desk. [2]
Centro Médico serves the Roma Sur, Doctores and Buenos Aires neighbourhoods. [2] It is located at the intersection of Avenida Cuauhtemoc and Eje 3 Sur Baja California, just a block north of Viaducto Miguel Alemán, an important east-west highway. [9] [10] The southern exits at the Line 3 end of the station are close to the historic Panteón Francés (French Cemetery) in which important civil and military Mexican figures are buried. [9] [10] [11]
Ridership
| Annual passenger ridership (Line 3) | |||||
|---|---|---|---|---|---|
| Year | Ridership | Average daily | Rank | % change | Ref. |
| 2022 | 4,912,204 | 13,458 | 89/195 | +32.94% | [1] |
| 2021 | 3,695,180 | 10,123 | 81/195 | −13.25% | [12] |
| 2020 | 4,259,395 | 11,637 | 83/195 | −42.41% | [13] |
| 2019 | 7,395,505 | 20,261 | 88/195 | −6.66% | [14] |
| 2018 | 7,923,555 | 21,708 | 78/195 | +1.40% | [15] |
| 2017 | 7,814,324 | 21,409 | 75/195 | −1.28% | [16] |
| 2016 | 7,915,565 | 21,627 | 82/195 | +1.51% | [17] |
| 2015 | 7,797,999 | 21,364 | 81/195 | −0.71% | [18] |
| 2014 | 7,853,706 | 21,517 | 80/195 | −5.43% | [19] |
| 2013 | 8,304,787 | 22,752 | 75/195 | +10.63% | [20] |
| 2012 | 7,506,799 | 20,510 | 90/195 | −8.14% | [21] |
| 2011 | 8,172,404 | 22,390 | 87/175 | +3.75% | [22] |
| 2010 | 7,876,846 | 21,580 | 67/175 | – | [23] |
| Annual passenger ridership (Line 9) | |||||
|---|---|---|---|---|---|
| Year | Ridership | Average daily | Rank | % change | Ref. |
| 2022 | 4,333,424 | 11,872 | 99/195 | +29.43% | [1] |
| 2021 | 3,348,060 | 9,172 | 95/195 | +15.39% | [12] |
| 2020 | 2,901,629 | 7,927 | 121/195 | −43.59% | [13] |
| 2019 | 5,143,782 | 14,092 | 126/195 | −2.76% | [14] |
| 2018 | 5,289,525 | 14,491 | 123/195 | +4.97% | [15] |
| 2017 | 5,039,274 | 13,806 | 123/195 | −3.19% | [16] |
| 2016 | 5,205,246 | 14,221 | 122/195 | +2.73% | [17] |
| 2015 | 5,066,899 | 13,881 | 121/195 | +1.51% | [18] |
| 2014 | 4,991,549 | 13,675 | 116/195 | −0.82% | [19] |
| 2013 | 5,032,851 | 13,788 | 120/195 | +7.38% | [20] |
| 2012 | 4,686,903 | 12,805 | 132/195 | −18.28% | [21] |
| 2011 | 5,735,048 | 15,712 | 117/175 | +141.39% | [22] |
| 2010 | 2,375,852 | 6,509 | 150/175 | – | [23] |
-
 Station sign
 -
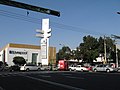
 Centro Médico Siglo XXI (Medical Center of the 21st Century) with metro entrance
 -
 Parque Delta Mall near Metro Centro Médico


References
- ^ a b c d e f "Afluencia de estación por línea 2022" [Station traffic per line 2022] (in Spanish). Sistema Transporte Colectivo Metro. 2023. Archived from the original on 5 March 2023. Retrieved 5 March 2023.
- ^ a b c d e f "Centro Médico" (in Spanish). Sistema de Transporte Colectivo. Archived from the original on 27 September 2011. Retrieved 29 July 2011.
- ^ a b Archambault, Richard. "Centro Médico - Mexico City Metro System". Retrieved 29 July 2011.
- ^ "CDS Centro Médico" (in Spanish). Retrieved 29 July 2011.
- ^ "Localización" (in Spanish). La Unidad Medica de Alta Expecialidad Hospital de Pediatria del Centro Médico Nacional Siglo XXI. Retrieved 29 July 2011.
- ^ "::: Hospital de Cardiología CMN S.XXI :::" (in Spanish). Archived from the original on 28 March 2012. Retrieved 29 July 2011.
- ^ a b c d Monroy, Marco. Schwandl, Robert (ed.). "Opening Dates for Mexico City's Subway". Retrieved 14 August 2011.
- ^ Soberon, Guillermo Julio; Jaime Sepulveda (June 1986). "The Health Care Reform in Mexico: Before and After the 1985 Earthquakes". American Journal of Public Health. 76 (6): 673–680. doi: 10.2105/AJPH.76.6.673. PMC 1646758. PMID 3706595.
- ^ a b "Cumulo 11: Centro Médico Siglo XXI" (PDF). Instituto Nacional de Estadística y Geografía. Archived from the original (PDF) on 6 October 2011. Retrieved 29 July 2011.
- ^ a b "Metro Centro Médico". Wikimapia. Retrieved 29 July 2011.
- ^ "Panteon Francés". Retrieved 29 July 2011.
- ^ a b "Afluencia de estación por línea 2021" [Station traffic per line 2021] (in Spanish). Sistema Transporte Colectivo Metro. 2020. Archived from the original on 7 March 2022. Retrieved 7 March 2022.
- ^ a b "Afluencia de estación por línea 2020" [Station traffic per line 2020] (in Spanish). Sistema Transporte Colectivo Metro. 2021. Archived from the original on 21 June 2021. Retrieved 21 June 2021.
- ^ a b "Afluencia de estación por línea 2019" (in Spanish). Sistema Transporte Colectivo Metro. 2020. Archived from the original on 8 April 2020. Retrieved 3 May 2020.
- ^ a b "Afluencia de estación por línea 2018" (in Spanish). Sistema Transporte Colectivo Metro. 2019. Archived from the original on 6 June 2019. Retrieved 7 April 2020.
- ^ a b "Afluencia de estación por línea 2017" (in Spanish). Sistema Transporte Colectivo Metro. 2019. Archived from the original on 3 May 2020. Retrieved 3 May 2020.
- ^ a b "Afluencia de estación por línea 2016" (in Spanish). Sistema Transporte Colectivo Metro. 2017. Archived from the original on 3 May 2020. Retrieved 3 May 2020.
- ^ a b "Afluencia de estación por línea 2015" (in Spanish). Sistema Transporte Colectivo Metro. 2016. Archived from the original on 3 May 2020. Retrieved 6 May 2020.
- ^ a b "Afluencia de estación por línea 2014" (in Spanish). Sistema Transporte Colectivo Metro. 2015. Archived from the original on 3 May 2020. Retrieved 6 May 2020.
- ^ a b "Afluencia de estación por línea 2013" (in Spanish). Sistema Transporte Colectivo Metro. 2014. Archived from the original on 3 May 2020. Retrieved 6 May 2020.
- ^ a b "Afluencia de estación por línea 2012" (in Spanish). Sistema Transporte Colectivo Metro. 2013. Archived from the original on 3 May 2020. Retrieved 6 May 2020.
- ^ a b "Afluencia de estación por línea 2011" (in Spanish). Sistema Transporte Colectivo Metro. 2012. Archived from the original on 7 May 2020. Retrieved 6 May 2020.
- ^ a b "Afluencia de estación por línea 2010" (in Spanish). Sistema Transporte Colectivo Metro. 2011. Archived from the original on 7 May 2020. Retrieved 6 May 2020.
External links
-
 Media related to
Centro Médico (station) at Wikimedia Commons
Media related to
Centro Médico (station) at Wikimedia Commons
| Line 1 | |
|---|---|
| Line 2 | |
| Line 3 |
|
| Line 4 | |
| Line 5 | |
| Line 6 | |
| Line 7 | |
| Line 8 | |
| Line 9 | |
| Line A | |
| Line B | |
| Line 12 | |
| Authority control databases: Geographic |
|---|