Southampton City Council elections are held three out of every four years to elect members of Southampton City Council, the local authority for the city of Southampton in Hampshire, England. Since 1 April 1997 Southampton has been a unitary authority responsible for all local government functions; prior to this it was a non-metropolitan district beneath Hampshire County Council.
Council elections
Non-metropolitan district elections
- 1973 Southampton City Council election
- 1976 Southampton City Council election
- 1979 Southampton City Council election (New ward boundaries & city boundary changes also took place) [1] [2]
- 1980 Southampton City Council election
- 1982 Southampton City Council election
- 1983 Southampton City Council election
- 1984 Southampton City Council election
- 1986 Southampton City Council election
- 1987 Southampton City Council election
- 1988 Southampton City Council election
- 1990 Southampton City Council election
- 1991 Southampton City Council election
- 1992 Southampton City Council election
- 1994 Southampton City Council election
- 1995 Southampton City Council election
Unitary authority elections
- 1996 Southampton City Council election
- 1998 Southampton City Council election
- 1999 Southampton City Council election
- 2000 Southampton City Council election
- 2002 Southampton City Council election (New ward boundaries increased the number of seats by 3) [3] [4] [5]
- 2003 Southampton City Council election
- 2004 Southampton City Council election
- 2006 Southampton City Council election
- 2007 Southampton City Council election
- 2008 Southampton City Council election
- 2010 Southampton City Council election
- 2012 Southampton City Council election
- 2014 Southampton City Council election
- 2015 Southampton City Council election
- 2016 Southampton City Council election
- 2018 Southampton City Council election
- 2019 Southampton City Council election
- 2021 Southampton City Council election
- 2022 Southampton City Council election
- 2023 Southampton City Council election (New ward boundaries increased the number of seats by 3) [6] [7]
City result maps
-
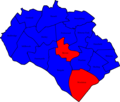
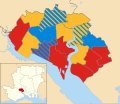 2002 results map
 -
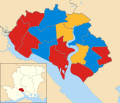
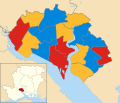 2003 results map
 -
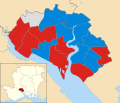
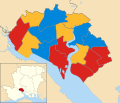 2004 results map
 -
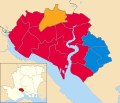
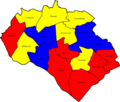 2006 results map
 -
 2007 results map
 -
 2008 results map
 -
 2010 results map
 -
 2011 results map
 -
 2012 results map
 -
 2014 results map
 -
 2015 results map
 -
 2016 results map
 -
 2018 results map
 -
 2019 results map
 -
 2021 results map
 -
 2022 results map
 -
 2023 results map


By-election results
1994-1998
| Party | Candidate | Votes | % | ±% | |
|---|---|---|---|---|---|
| Labour | 885 | 52.6 | -6.4 | ||
| Conservative | 259 | 15.4 | -3.0 | ||
| Socialist Labour | 257 | 15.3 | +9.3 | ||
| Liberal Democrats | 250 | 14.9 | +4.7 | ||
| Independent Labour | 31 | 1.8 | -4.7 | ||
| Majority | 626 | 37.2 | |||
| Turnout | 1,682 | 13.0 | |||
| Labour hold | Swing | ||||
| Party | Candidate | Votes | % | ±% | |
|---|---|---|---|---|---|
| Labour | 975 | 47.8 | -9.4 | ||
| Liberal Democrats | 725 | 35.6 | +6.1 | ||
| Conservative | 339 | 16.6 | +3.3 | ||
| Majority | 250 | 12.2 | |||
| Turnout | 2,039 | 17.9 | |||
| Labour hold | Swing | ||||
1998-2002
| Party | Candidate | Votes | % | ±% | |
|---|---|---|---|---|---|
| Conservative | 1,025 | 58.9 | +8.9 | ||
| Labour | 372 | 21.4 | -16.2 | ||
| Liberal Democrats | 344 | 19.8 | +7.5 | ||
| Majority | 653 | 37.5 | |||
| Turnout | 1,741 | 14.5 | |||
| Conservative hold | Swing | ||||
| Party | Candidate | Votes | % | ±% | |
|---|---|---|---|---|---|
| Labour | 858 | 44.1 | -6.7 | ||
| Conservative | 856 | 44.0 | +9.3 | ||
| Liberal Democrats | 231 | 11.9 | +3.3 | ||
| Majority | 2 | 0.1 | |||
| Turnout | 1,945 | 19.3 | |||
| Labour hold | Swing | ||||
2002-2006
| Party | Candidate | Votes | % | ±% | |
|---|---|---|---|---|---|
| Conservative | Clifford Coombes | 984 | 37.1 | +0.4 | |
| Labour | Mike Brainsby | 791 | 29.9 | +13.1 | |
| Liberal Democrats | Anne Work | 785 | 29.6 | -4.3 | |
| Green | Joseph Cox | 89 | 3.4 | +3.4 | |
| Majority | 193 | 7.2 | |||
| Turnout | 2,649 | ||||
| Conservative gain from Liberal Democrats | Swing | ||||
2010-2014
| Party | Candidate | Votes | % | ±% | |
|---|---|---|---|---|---|
| Labour | Christopher Hammond | 864 | 32.3 | -22.8 | |
| UKIP | John Sharp | 741 | 27.7 | +27.7 | |
| Conservative | Alex Houghton | 704 | 26.3 | -5.6 | |
| TUSC | Sue Atkins | 136 | 5.1 | +0.4 | |
| Liberal Democrats | Adrian Ford | 120 | 4.5 | -3.8 | |
| Green | Christopher Bluemel | 107 | 4.0 | +4.0 | |
| Majority | 123 | 4.6 | |||
| Turnout | 2,672 | ||||
| Labour hold | Swing | ||||
2014-2018
| Party | Candidate | Votes | % | ±% | |
|---|---|---|---|---|---|
| Labour | Matthew Raynard | 668 | 26.2 | -2.0 | |
| Conservative | Charles Perez-Storey | 529 | 20.7 | +4.3 | |
| Liberal Democrats | Josh Smith | 450 | 17.6 | +14.7 | |
| Socialist Alternative | Susan Anne Atkins | 368 | 14.4 | +14.4 | |
| Integrity Southampton | David John Fletcher | 178 | 7.0 | +7.0 | |
| Independent | Richard Terrence McQuillan | 174 | 6.8 | +4.4 | |
| UKIP | Derek Lascelles Humber | 123 | 4.8 | +4.8 | |
| Green | Cara Anne Sandys | 53 | 2.1 | −0.9 | |
| Majority | 139 | 5.4 | |||
| Turnout | 2,551 | 25.0 | −7.7 | ||
| Labour gain from Independent | Swing | ||||
2022-2026
| Party | Candidate | Votes | % | ±% | |
|---|---|---|---|---|---|
| Labour | Yvonne Frampton | 806 | 46.0 | +4.6 | |
| Conservative | Callum Ford | 793 | 45.3 | -1.8 | |
| Green | Ronald Meldrum | 66 | 3.8 | -1.5 | |
| Liberal Democrats | Nick McGeorge | 61 | 3.5 | -0.9 | |
| TUSC | Mabel Wellman | 26 | 1.5 | -0.3 | |
| Majority | 13 | 0.7 | |||
| Turnout | 1,752 | ||||
| Labour gain from Conservative | Swing | ||||
References
- ^ The City of Southampton (Electoral Arrangements) Order 1976
- ^ The New Forest and Southampton (Areas) Order 1978
- ^ legislation.gov.uk - The City of Southampton (Electoral Changes) Order 2001. Retrieved on 4 October 2015.
- ^ "Southampton". BBC News Online. Retrieved 25 April 2010.
- ^ "Elections explained". Southampton City Council. Retrieved 25 April 2010.
- ^ "Plan to make city council bigger – how to have your say".
- ^ "Why councillors could only stand for one year in Southampton". Southern Daily Echo. Newsquest. Retrieved 6 May 2022.
- ^ "Bitterne Park ward by election result 15/09/2005". Southampton City Council. Retrieved 25 April 2010.
- ^ "Local Elections Archive Project — Woolston Ward". www.andrewteale.me.uk. Retrieved 28 March 2024.
- ^ "Local Elections Archive Project — Coxford Ward". www.andrewteale.me.uk. Retrieved 28 March 2024.
- ^ "Local Elections Archive Project — Bitterne Ward". www.andrewteale.me.uk. Retrieved 28 March 2024.
