Swindon Borough Council is the local authority for the unitary authority of Swindon in Wiltshire, England. Until 1 April 1997 its area was a non-metropolitan district called Thamesdown Borough Council, with Wiltshire County Council providing the county-level services.
District council
- 1973 Thamesdown Borough Council election
- 1976 Thamesdown Borough Council election (New ward boundaries) [1]
- 1978 Thamesdown Borough Council election
- 1979 Thamesdown Borough Council election
- 1980 Thamesdown Borough Council election
- 1982 Thamesdown Borough Council election (Some new ward boundaries & borough boundary changes) [2] [3]
- 1983 Thamesdown Borough Council election
- 1984 Thamesdown Borough Council election
- 1986 Thamesdown Borough Council election (New ward boundaries) [4]
- 1987 Thamesdown Borough Council election
- 1988 Thamesdown Borough Council election
- 1990 Thamesdown Borough Council election
- 1991 Thamesdown Borough Council election
- 1992 Thamesdown Borough Council election
- 1994 Thamesdown Borough Council election
- 1995 Thamesdown Borough Council election
- 1996 Thamesdown Borough Council election
Unitary authority
- 1998 Swindon Borough Council election
- 1999 Swindon Borough Council election
- 2000 Swindon Borough Council election (New ward boundaries increased the number of seats by 5) [5] [6] [7]
- 2002 Swindon Borough Council election
- 2003 Swindon Borough Council election
- 2004 Swindon Borough Council election
- 2006 Swindon Borough Council election
- 2007 Swindon Borough Council election
- 2008 Swindon Borough Council election
- 2010 Swindon Borough Council election
- 2011 Swindon Borough Council election
- 2012 Swindon Borough Council election (New ward boundaries) [8]
- 2014 Swindon Borough Council election
- 2015 Swindon Borough Council election (New ward boundaries) [9]
- 2016 Swindon Borough Council election
- 2018 Swindon Borough Council election [10]
- 2019 Swindon Borough Council election
- 2021 Swindon Borough Council election
- 2022 Swindon Borough Council election
- 2023 Swindon Borough Council election
Results maps
-
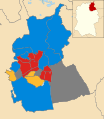
 2000 results map
 -
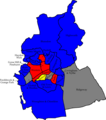
 2002 results map
 -
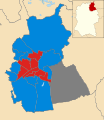
 2003 results map
 -
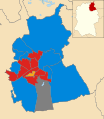
 2004 results map
 -
 2006 results map
 -
 2007 results map
 -
 2008 results map
 -
 2010 results map
 -
 2011 results map
 -
 2012 results map
 -
 2014 results map
 -
 2015 results map
 -
 2016 results map
 -
 2018 results map
 -
 2019 results map
 -
 2021 results map
 -
 2022 results map
 -
 2023 results map


By-election results
1994–1998
| Party | Candidate | Votes | % | ±% | |
|---|---|---|---|---|---|
| Labour | 548 | 46.3 | |||
| Liberal Democrats | 300 | 25.3 | |||
| Conservative | 224 | 18.9 | |||
| Green | 69 | 5.8 | |||
| Socialist Labour | 44 | 53.7.8 | |||
| Majority | 248 | 21.0 | |||
| Turnout | 1,185 | 20.7 | |||
| Labour hold | Swing | ||||
| Party | Candidate | Votes | % | ±% | |
|---|---|---|---|---|---|
| Labour | 715 | 66.0 | -4.4 | ||
| Conservative | 297 | 27.4 | +11.2 | ||
| Liberal Democrats | 72 | 6.6 | -6.8 | ||
| Majority | 418 | 38.6 | |||
| Turnout | 1,084 | 15.2 | |||
| Labour hold | Swing | ||||
2002-2006
| Party | Candidate | Votes | % | ±% | |
|---|---|---|---|---|---|
| Conservative | Raymond Fisher | 814 | 52.5 | +5.3 | |
| Labour | 409 | 26.4 | -13.2 | ||
| Liberal Democrats | 258 | 16.6 | +3.4 | ||
| UKIP | 69 | 4.5 | +4.5 | ||
| Majority | 405 | 26.1 | |||
| Turnout | 1,550 | 20.6 | |||
| Conservative gain from Labour | Swing | ||||
| Party | Candidate | Votes | % | ±% | |
|---|---|---|---|---|---|
| Labour | 513 | 37.9 | +0.3 | ||
| Liberal Democrats | 359 | 26.5 | -12.1 | ||
| Conservative | 229 | 16.9 | -0.6 | ||
| SA | 119 | 8.8 | +8.8 | ||
| Green | 71 | 5.2 | +5.2 | ||
| SOU | 41 | 3.0 | -3.2 | ||
| UKIP | 21 | 1.6 | +1.6 | ||
| Majority | 154 | 11.4 | |||
| Turnout | 1,353 | 19.4 | |||
| Labour hold | Swing | ||||
| Party | Candidate | Votes | % | ±% | |
|---|---|---|---|---|---|
| Labour | 829 | 47.5 | +4.2 | ||
| Conservative | 651 | 37.3 | +11.3 | ||
| Liberal Democrats | 154 | 8.8 | -13.5 | ||
| UKIP | 79 | 4.5 | -3.9 | ||
| Green | 34 | 1.9 | +1.9 | ||
| Majority | 178 | 10.2 | |||
| Turnout | 1,747 | 23.5 | |||
| Labour hold | Swing | ||||
| Party | Candidate | Votes | % | ±% | |
|---|---|---|---|---|---|
| Labour | Peter Mallinson | 706 | 38.4 | -3.4 | |
| Conservative | 586 | 31.9 | -1.8 | ||
| Liberal Democrats | 338 | 18.4 | +1.2 | ||
| Independent | 106 | 5.8 | +5.8 | ||
| Green | 60 | 3.3 | -3.9 | ||
| UKIP | 43 | 2.3 | +2.3 | ||
| Majority | 120 | 6.5 | |||
| Turnout | 1,839 | 35.0 | |||
| Labour gain from Conservative | Swing | ||||
2010-2012
| Party | Candidate | Votes | % | ±% | |
|---|---|---|---|---|---|
| Labour | Jenny Millin | 887 | 47.5 | +12.6 | |
| Conservative | Toby Elliott | 755 | 40.4 | +1.0 | |
| UKIP | William Oram | 129 | 6.9 | +6.9 | |
| Liberal Democrats | Chris Ward | 98 | 5.2 | -13.3 | |
| Majority | 132 | 7.1 | |||
| Turnout | 1,869 | 23.7 | |||
| Labour gain from Conservative | Swing | ||||
2012-2014
| Party | Candidate | Votes | % | ±% | |
|---|---|---|---|---|---|
| Conservative | Steve Weisinger | 1,453 | |||
| Labour | Phil Beaumont | 1,075 | |||
| UKIP | John Lenton | 195 | |||
| Green | Andrew Donald Day | 111 | |||
| Liberal Democrats | Cath Smith | 23 | |||
| Majority | 378 | ||||
| Turnout | 32.6 | ||||
| Conservative hold | Swing | ||||
| Party | Candidate | Votes | % | ±% | |
|---|---|---|---|---|---|
| Conservative | Oliver Donachie | 1,376 | 49.6 | +6.0 | |
| Labour | Maura Clarke | 887 | 32.0 | +0.8 | |
| UKIP | Ed Gerrard | 426 | 15.4 | +4.8 | |
| Liberal Democrats | Sean Davey | 83 | 3.0 | -3.3 | |
| Majority | 489 | 17.6 | |||
| Turnout | 2,772 | ||||
| Conservative hold | Swing | ||||
2018-2022
| Party | Candidate | Votes | % | ±% | |
|---|---|---|---|---|---|
| Conservative | Kate Tomlinson | 1,139 | 60.6 | +6.4 | |
| Labour | Ian Edwards | 508 | 27.0 | -5.9 | |
| Liberal Democrats | Joseph Polson | 102 | 5.4 | +5.4 | |
| Green | Stephen Litchfield | 83 | 4.4 | -3.4 | |
| Independent | Elena Mari | 47 | 2.5 | +2.5 | |
| Majority | 631 | 33.6 | |||
| Turnout | 1,879 | ||||
| Conservative hold | Swing | ||||
2022-2026
| Party | Candidate | Votes | % | ±% | |
|---|---|---|---|---|---|
| Conservative | Matthew Vallender | 1,143 | 50.6 | +11.6 | |
| Labour | Joseph Polson | 1,118 | 49.4 | -0.4 | |
| Majority | 25 | 1.2 | |||
| Turnout | 2,261 | ||||
| Conservative gain from Labour | Swing | ||||
References
- ^ legislation.gov.uk – The Borough of Thamesdown (Electoral Arrangements) Order 1975. Retrieved on 19 November 2015.
- ^ legislation.gov.uk – The North Wiltshire and Thamesdown (Areas) Order 1980. Retrieved on 18 November 2015.
- ^ The Oxfordshire and Wiltshire (Areas) Order 1980
- ^ The Borough of Thamesdown (Electoral Arrangements) Order 1986
- ^ legislation.gov.uk – The Borough of Swindon (Electoral Changes) Order 1999. Retrieved on 4 October 2015.
- ^ "Swindon". BBC News Online. Retrieved 16 August 2009.
- ^ "Want to be a Councillor?". Swindon Borough Council. Retrieved 18 March 2010.
- ^ legislation.gov.uk – The Swindon (Electoral Changes) Order 2012. Retrieved on 3 November 2015.
- ^ legislation.gov.uk – The Swindon (Electoral Changes) Order 2015. Retrieved on 3 November 2015.
- ^ "Local Elections 2018 – Swindon Borough Council". BBC News. 2018. Retrieved 6 May 2018.
- ^ "Labour slips in the snow". guardian.co.uk. London. 31 January 2003. Retrieved 18 March 2010.
- ^ "Double defeat for Tories in the west of England". guardian.co.uk. London. 4 February 2005. Retrieved 18 March 2010.
- ^ "Labour takes seat from Tories in election". This is Wiltshire.co.uk. 5 November 2010. Retrieved 6 November 2010.
- ^ "Conservatives hold Blunsdon and Highworth ward in by election". swindonadvertiser.co.uk. 16 November 2012. Retrieved 16 November 2012.
- ^ "Local Elections Archive Project — Haydon Wick Ward". www.andrewteale.me.uk. Retrieved 8 February 2024.
- ^ "Local Elections Archive Project — Priory Vale Ward". www.andrewteale.me.uk. Retrieved 8 February 2024.
- ^ "Local Elections Archive Project — St Margaret and South Marston Ward". www.andrewteale.me.uk. Retrieved 8 February 2024.
