Stale Information
-
 Sad beginnings of a Seattle map
 -
 Ideally should look something like this


Article(s): Seattle
Request: Trying to get this thing rolling, this is a request out of the archives that I'd like to see get done and just don't have never had the time to do myself. Seattle is one of our featured articles and it really ought to have a decent map to go with it. Kmusser ( talk) 18:01, 27 January 2009 (UTC)
Graphist opinion:
- OpenStreetMap may also help a lot ! Yug (talk) 06:41, 10 February 2009 (UTC)
- Yes Seattle on OpenStreetMap, osmarender view, cloudmade original, cloudmade tourist, cloudmade fine line. These are all cc-by-sa licensed and can be screenshotted and uploaded to wikipedia. SVG export is also possible, but at the current time it's a bit unreliable for zoomed out whole city maps. -- Harry Wood ( talk) 10:37, 25 February 2009 (UTC)

Article(s): Geology of North America and many others.
Request: Re-listing Connormah's request from the Image Lab - map probably needs to be re-done from scratch in order to look good. Kmusser ( talk) 13:07, 3 February 2009 (UTC)
Graphist opinion:

Article(s): Algonquin
Request: Another request re-listing, originally from Connormah, map should be totally re-done. Kmusser ( talk) 13:09, 3 February 2009 (UTC)
Non-Graphist questions: What is the meaning of the dotted areas? Should it show uncertainty in the distribution, movements or is the map resolved to village-level? Not being familiar with American history, did the states/provinces exist as indicated on the map around 1800? bamse ( talk) 17:37, 10 February 2009 (UTC)
- Presumably it's to show the uncertainty in the distribution, it's mapping linguistic groupings which wouldn't have definite borders - and the state/prov. boundaries shown are modern. Kmusser ( talk) 19:18, 11 February 2009 (UTC)
-
 state/prov. boundaries in North America for the year 1800

Graphist opinion:
-
 Existing, incorrect, OR map
 -
 This map is to use as background for the new one.


Article(s): Currently shown on Faisal–Weizmann Agreement, British Mandate of Palestine and Churchill White Paper, as well as discussed on talk pages.
Request: Hail graphists, if only my rapidographs were of the current era, I wouldn’t need to bother you. As an appreciative and knowledgeable map user, I request that this map be corrected to reflect the RSs provided below, rather than as currently presented. (If that is possible, because Wiki’s image-related policies are unfathomable to my mind). I want to keep the map, rather than just delete it; it is very important but must be accurate.
One source for this image can be found here. This site shows the borders, as well as geographically related text (See section: The Boundaries of Palestine SCHEDULE) to technically determine the validity of a wiki-map representation. I Google’d the book source cited for the map and found an original(?) accessible one here. Being a hot topic, I checked on the R of the RS, and found this among others. I also found it here and note its apparent acceptance by consensus. I consider this book source reliable and notable for its reported apparent lack of bias. Another accessible site for a representation of the borders exists here. This second representation is similar to the book source for the map, noted above, and by comparison, better illustrates the differences with the current wiki-map.
I doubled-checked the geographically related text and found similar here (Again section: The Boundaries of Palestine SCHEDULE), but no map is provided at this site. I am unaware of other sources for the map at this time.
After looking into the geographic text and included place-names, with the aid of this map (big file but I didn't look at the bigest one), my professional-level map skills, familiarity with the spoken Arabic language and the area, I believe an NPOV correction is possible. Sidon is obvious and ‘following the watersheds’ is largely technical. JISR EL KARAON is a 1919 bridge over/on the Litani River near a village at Lake Qaraoun. EL BIRE is Al-Bireh, Lebanon, because that article includes reference to ‘Wadi el-Taym’, (Wadi ET TEIM). I have found ‘Bayt Jinn’ (BEIT JENN) in Syria on the Dec. 1989 NatGeo map, Holy Land, which also shows the Hedjaz Railway to the east. I suspect that NAHR MUGHANIYE, may be an upper tributary name of what the same map shows as Nahr al A’waj, farther downstream, because of its location and the text description. Other than this last item, I do not consider this OR, since we are talking about a map and must translate languages, alphabets and differences in spelling over time. That, however, is your bailiwick.
I hope this sufficiently explains and illustrates my concerns regarding this current map presentation. Since the current representation is only consistent on the south and west, this leads me to believe that more than a technical zoom factor or aspect ratio may be involved. Sorry to put you under the gun. I am willing to assist technically if needed, to provide insight into the very important water resource aspects noted elsewhere in the text, or scaled long/lat data from my paper maps. But, electronically speaking, I am graphically challenged. I will be checking the page, with hope. Professional Regards, CasualObserver'48 ( talk) 09:52, 5 February 2009 (UTC)
- Re: Suggested base map. It might work, but I suspect that the northern border of the base map should cover farther north, so that the correct 'red line' border does not get squeezed to the edge. Looks to be a similar problem with the this one. CasualObserver'48 ( talk) 11:03, 5 February 2009 (UTC)
- I volunteer to provide any assistance that I can, provided you can accept classically calculated (paper, pencil, scale, etc) input. For starters, it would require agreement on a published base map (like the one noted above (1:405,500), from which I work, and a common understanding of the data/units you require for electronic input. Agreement on what dots go where would be consensual, based on how we got there and the variability of data provided. Regards, CasualObserver'48 ( talk) 05:52, 24 February 2009 (UTC)
Graphist opinion: Definitely doable, I won't get to it anytime soon though, so if anyone else wants to take this on please do. Kmusser ( talk) 14:01, 5 February 2009 (UTC)

Article(s):
Request: blank wiki map this projection... Chris (クリス • フィッチュ) ( talk) 05:27, 18 February 2009 (UTC)
Graphist opinion:
- Please clarify projection. Are you referring to this particular
Map projection? I presume you're wanting a SVG map of the pacific region. Is the
previous SVG map of the ring of fire the wrong projection? —Preceding
unsigned comment added by
202.154.152.34 (
talk) 10:53, 18 February 2009 (UTC)
- Is that what you meant? − Inductiveload ( talk) 21:13, 18 February 2009 (UTC)
- Ah, no, I meant where Alaska is shaped normally and not squashy, referring to this particular
Map projection.
Chris (クリス • フィッチュ) (
talk) 16:04, 19 February 2009 (UTC)
- Okay, I've worked out how to do a mercator projection (like what google maps does) with [
my script], but I don't like what that does to the sizes of countries. I'll have a hunt for a good equal-area projection. Because this is not the entire globe, shape distortion around the edges shouldn't matter so much.
gringer (
talk) 11:36, 25 February 2009 (UTC)
- Perhaps try
Winkel tripel projection?
Kmusser (
talk) 14:12, 25 February 2009 (UTC)
- That'll probably do. It's not the entire globe, but does cover quite a chunk at the top. Here's an outline-only non-cleaned [ high resolution version] (needs paths XORed, colours, etc). I'll upload a cleaned version of that to commons sometime in the next few days. gringer ( talk) 11:29, 26 February 2009 (UTC)
- Perhaps try
Winkel tripel projection?
Kmusser (
talk) 14:12, 25 February 2009 (UTC)
- I've updated that pacific map to a Winkel Tripel projection, which should be a better projection. gringer ( talk) 03:01, 28 February 2009 (UTC)
- Okay, I've worked out how to do a mercator projection (like what google maps does) with [
my script], but I don't like what that does to the sizes of countries. I'll have a hunt for a good equal-area projection. Because this is not the entire globe, shape distortion around the edges shouldn't matter so much.
gringer (
talk) 11:36, 25 February 2009 (UTC)
- If you're doing colors, can you also do a grey-and-white Wiki-style one as well? Thanks!
Chris (クリス • フィッチュ) (
talk) 17:38, 26 February 2009 (UTC)
- Okay, guys, I appreciate your hard work, but it is totally not what I am asking for, though the work you've done will also be useful on the Wikipedia, and thank you for that. You see the first map, File:Pacific Ring of Fire.png and how the continents and everything have very definite shapes? That's a particular projection, and unfortunately I do not know its name, but that is what I need, in grey-and-white Wiki-style.
Chris (クリス • フィッチュ) (
talk) 07:40, 28 February 2009 (UTC)
- That's pretty vague. That Ring of Fire map appears to be in a Mercator projection, if you wanted a gray and white Pacific Mercator map there was already one sitting on Commons. Kmusser ( talk) 12:25, 28 February 2009 (UTC)
- Okay, guys, I appreciate your hard work, but it is totally not what I am asking for, though the work you've done will also be useful on the Wikipedia, and thank you for that. You see the first map, File:Pacific Ring of Fire.png and how the continents and everything have very definite shapes? That's a particular projection, and unfortunately I do not know its name, but that is what I need, in grey-and-white Wiki-style.
Chris (クリス • フィッチュ) (
talk) 07:40, 28 February 2009 (UTC)
- That's what I needed, couldn't find one when I searched, thank you!
Chris (クリス • フィッチュ) (
talk) 20:56, 28 February 2009 (UTC)
- ah, wait, okay, that one, but can we get it with white national borders, make the lakes clear (right now they are grey like countries) and increase the visible size of the svg? Chris (クリス • フィッチュ) ( talk) 21:50, 28 February 2009 (UTC)

Article(s): Bosnia-Herzegovina
Request: Zoom and dim the regions that are not Bosnia-Herzegovina, it should look similar to [2]. PRODUCER ( talk) 19:17, 20 February 2009 (UTC)
Graphist opinion:

Article(s): Sarajevo
Request: Update the map to make it more modern like [3], highlight rather than dim the four municipalities, and number the 4 municipalities. PRODUCER ( talk) 18:19, 21 February 2009 (UTC)
Graphist opinion:
-
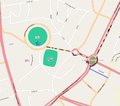 The liberty chowk/roundabout is the place where attack took place.The black/gray route is of the Team convoy and Blue is the route which terrorist used to run away.

Article(s): 2009 Lahore attack on Sri Lankan cricket team
Request: Improve the route and place a star at liberty chock User:Yousaf465 ( talk) 10:03, 8 March 2009 (UTC)
Graphist opinion:
-
 Districts of Karakalpakstan

Article(s): Districts of Uzbekistan
Request: Please correct district boundaries according this map. Note that Bo’zotov (III) and Kegeyli (IV) district was merged into one district in 2004. Anatoliy ( Talk) 13:56, 8 March 2009 (UTC)
Graphist opinion: We'd need a higher resolution source image, that one isn't good enough to digitize from, I can't make out the boundaries on it. I did a quick look to see if I could find GIS data for the district boundaries but came up empty. Kmusser ( talk) 19:52, 17 March 2009 (UTC)
-
 Blank map of world in equirectangular projection
 -
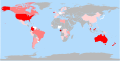 Same map, filled in with countries colored as to percentage of population using fluoridated water
 -
 Compact blank map, without Antarctica
 -
 Same map, with countries filled in according to per-capita calorie consumption, 2001–2003
 -
 Likewise, but for 1979–1981


Article(s): Water fluoridation, Obesity, Dietary energy supply
Request: This is a common problem. I have a map in which each country is colored according to the percentage of population that has some property. In the first colored example, it's the percentage of population that is using fluoridated water; in the second and third colored examples, it's per-capita calorie consumptions in different years.
In these maps, I want the countries' areas to be proportional to their populations, since I'm displaying information that is per-capita, and I want the overall display to have the right global focus (China's huge population, for example, should be weighted heavily, whereas Canada's relatively-small population should not consume much space on the screen). I would like a blank SVG cartogram of the world, which looks like blank maps in the galleries above, except that the countries have been stretched so that their areas are proportional to (say) the U.N. estimates for 2009 populations. You can see (copyrighted) examples of such cartograms elsewhere, [4] [5] but they aren't blank and they aren't SVG format and they aren't freely usable in Wikipedia. If I had a blank SVG world-population cartogram, I could easily color it in myself and then generate colored cartograms instead of these problematic colored maps. Eubulides ( talk) 06:01, 9 March 2009 (UTC)
Graphist opinion: Cartograms are very difficult to make, it might to worth asking the worldmapper folks if they'd give us permission to use theirs. Kmusser ( talk) 13:07, 9 March 2009 (UTC)
- Considering that they've picked cc-by-nc-nd I don't think they would agree to a more free license. Personally I'm not a big fan of these maps for the simple reason that they don't tell me anything at a first glance but that's beside the point. There are some skilled programmers mentioned on
commons:File_talk:BlankMap-World6.svg who might enjoy the challenge of turning the free
File:BlankMap-World6.svg into a cartogram. If nothing else it would be very useful for illustrating how such a representation would look compared to a "normal" one. /
Lokal
_
Profil 18:24, 9 March 2009 (UTC)
- Found File:Sweden.population.2008-11-01.cart.svg which has been created based on a Commons svg. Asked the creator to frop by the discussion here. / Lokal _ Profil 18:33, 9 March 2009 (UTC)
-
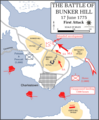 Bunker Hill attack map 1
 -
 Bunker Hill attack map 2
 -
 Bunker Hill attack map 3


Article(s): Battle of Bunker Hill
Request: I would like to have SVG versions of maps similar to these (or maps that at least look better when scaled down). The text on the images is not all needed, and I may want have some of it changed (e.g. to better label the force movements), or have other text (e.g. ship names and force commanders) added. There is also some data from a map in Robert Ketchum's Decisive Day that I would like to bring in (primarily detail on force locations and the nature of the American defenses), as well as some from historic maps providing better ship locations. Thanks for your help! Magic ♪piano 01:22, 14 March 2009 (UTC)
Graphist opinion:
-
![Ukrainian SSR in early 1939, after the Peace of Riga and the consolidation of USSR. (see also animated version with administrative divisions [1])](https://upload.wikimedia.org/wikipedia/commons/thumb/e/ee/NonFreeImageRemoved.svg/109px-NonFreeImageRemoved.svg.png) Ukrainian SSR in early 1939, after the Peace of Riga and the consolidation of USSR. (see also animated version with administrative divisions [1])
Ukrainian SSR in early 1939, after the Peace of Riga and the consolidation of USSR. (see also animated version with administrative divisions [1]) -
 Ukrainian SSR in 1940. This should be broken down into two maps. 1) Soviet Ukraine after the annexation of Polish Galicia and Volhynia. 2) Soviet Ukraine after the annexation Romanian Bukovina and Bessarabia
 -
 A map of Ukraine after WWII and the Paris Peace Treaties, 1947
 -
 Ukraine after the Crimean transfer
 -
 A map outlining all gained territories at once
![Ukrainian SSR in early 1939, after the Peace of Riga and the consolidation of USSR. (see also animated version with administrative divisions [1])](/info/en/?search=File:NonFreeImageRemoved.svg)


Article(s): Ukrainian Soviet Socialist Republic
Request: There are currently several different maps illustrating the territorial progression of Soviet Ukraine. Some are animated, others are scanned atlases, so all in all these images just look bad. But more importantly, they don't specifically show the gained territory in each time frame. Would it be possible to create a similar line maps to illustrate these changes properly? The prefered order would be:
- Prewar (early 1939)
- Annexation of Polish Galicia and Volhynia (late 1939)
- Annexation Romanian Bukovina and Bessarabia
- After WWII and the Paris Peace Treaties (1947)
- After Crimean transfer (1954)
Regards, Tavrian 04:35, 21 March 2009 (UTC)
Graphist opinion:
-
See the description for the images
Article(s): University of Valle#Campus
Request: Greetings. I'm completing the university article, and I would like to add the maps for the two largest campus, that are available in these websites as PDF files: Melendez Campus and San Fernando Campus. Both maps are in Spanish, and I'll be glad to help in the translation of the names. Regards, Andremun ( talk) 14:40, 22 March 2009 (UTC)
Graphist opinion:
-
 svg
svg

Article(s): List of Antarctic expeditions and many other
Request: As a split off of an archive request by Andeggs (and to try out the new map lab) I request a map showing the expeditions in Antarctica before the Heroic Age of Antarctic Exploration. bamse ( talk) 17:22, 10 February 2009 (UTC)
Graphist opinion: I translated and modified
Expeditions in Antarctica-fr.svg which is in French. The
map is supposed to show all successful expeditions (those that discovered new land for instance) south
of 60° S latitude the
Antarctic Convergence. Please check for completeness. I could not find the routes taken by the expeditions
in the box. It would be great if somebody could direct me to sources for these. At least for the Southern
Ocean Expedition there should exist such material I think. Looking for comments on completeness, correctness
and beauty. The svg-version renders terribly even though I used a supported font (DejaVu sans). How can
I fix this?
bamse (
talk) 17:22, 10 February 2009 (UTC)
- I think it looks good, I don't see anything I'd change other than making it more complete. I'll see if I can track down any of those missing expeditions next week, I think I have a couple of books on Antarctic exploration at home. As for getting SVG to render better, my solution is just to use PNG :-)
Kmusser (
talk) 17:44, 10 February 2009 (UTC)
- Thanks. Then I'll leave the svg if somebody wants to translate or change something later on. bamse ( talk) 17:50, 10 February 2009 (UTC)
- I just noticed that TimesNewRoman works much better in the svg. I only changed the font in the legend so far but will update all the text later. bamse ( talk) 10:51, 11 February 2009 (UTC)
- After a
discussion with
User:Apcbg I extended the scope to expeditions south of the
Antarctic Convergence and added the expedition of
Anthony de la Roché. Also changed (hopefully everywhere) to Times New Roman to get a better wiki-rendering of the svg. Still looking for routes of the expeditions in the box.
bamse (
talk) 21:18, 15 February 2009 (UTC)
- OK, it's going to be awhile longer before I can work more on this, in the meantime I have found some sources for you if you want to continue on your own. Most refer to the Southern Ocean and Jason expeditions by their captains, Biscoe and Larsen respectively. The Philip's Atlas of Exploration
ISBN
0540061913 has maps for Bransfield, Biscoe, Balleny, Larsen, and 2 that you don't have listed, Peter Kemp (1833-4), and T.E.L. Moore (1845). The October 1932 issue of National Geographic has a great map which is
also online shows Biscoe and Balleny in more detail than Philip's. It also looks like d'Urville should have a 2nd loop near the South Orkney and Shetland Islands. I couldn't find any evidence that Shelvocke should be included, his
own map doesn't show anything south of Cape Horn. I noticed that the NG map indicates Bull/Borchgrevink's 1895 landing with a point, you might do the same for him, Palmer, and Davis.
Kmusser (
talk) 04:28, 18 February 2009 (UTC)
- Great map, thanks a lot! Also the present
map should be checked for mistakes. At least the expedition of Ross (taken from the French map) sailing through the Ice shelf is wrongly indicated. Unfortunately I don't have access to Philip's Atlas. Maybe you could draw the respective routes? No need to rush with this, as I am also quite busy at the moment.
bamse (
talk) 09:24, 18 February 2009 (UTC)
- Yeah, when I get some time I can draw or scan in the routes from Philip's. Kmusser ( talk) 14:54, 18 February 2009 (UTC)
- Despite it being marked as stale I actually am still working on this one, just very slowly :-)
Kmusser (
talk) 12:37, 8 April 2009 (UTC)
- Just a little detail : there is blue blocks under some names (for example Weddell Sea) (maybe becauseof font ?) Bourrichon ( talk) 22:55, 8 April 2009 (UTC)
- Great map, thanks a lot! Also the present
map should be checked for mistakes. At least the expedition of Ross (taken from the French map) sailing through the Ice shelf is wrongly indicated. Unfortunately I don't have access to Philip's Atlas. Maybe you could draw the respective routes? No need to rush with this, as I am also quite busy at the moment.
bamse (
talk) 09:24, 18 February 2009 (UTC)
- OK, it's going to be awhile longer before I can work more on this, in the meantime I have found some sources for you if you want to continue on your own. Most refer to the Southern Ocean and Jason expeditions by their captains, Biscoe and Larsen respectively. The Philip's Atlas of Exploration
ISBN
0540061913 has maps for Bransfield, Biscoe, Balleny, Larsen, and 2 that you don't have listed, Peter Kemp (1833-4), and T.E.L. Moore (1845). The October 1932 issue of National Geographic has a great map which is
also online shows Biscoe and Balleny in more detail than Philip's. It also looks like d'Urville should have a 2nd loop near the South Orkney and Shetland Islands. I couldn't find any evidence that Shelvocke should be included, his
own map doesn't show anything south of Cape Horn. I noticed that the NG map indicates Bull/Borchgrevink's 1895 landing with a point, you might do the same for him, Palmer, and Davis.
Kmusser (
talk) 04:28, 18 February 2009 (UTC)
- I think it looks good, I don't see anything I'd change other than making it more complete. I'll see if I can track down any of those missing expeditions next week, I think I have a couple of books on Antarctic exploration at home. As for getting SVG to render better, my solution is just to use PNG :-)
Kmusser (
talk) 17:44, 10 February 2009 (UTC)
Hi, I'm editing an svg file using the arial font. I'd like to replace one supported by the commons svg engine to be able to control the final look better in inskcape. Which font resembles arial the most? Not only looks but also size because a lot of the supported fonts look stretched horizontally. Thanks, Richardprins ( talk) 19:15, 29 March 2009 (UTC)
- I don't know of any way to do this. There are two options: The first is to export the SVG as a png, using the png in articles and having the svg available only for translation. I recommend this one. The second is to convert the text into a path. This makes the file larger and makes translating the file more cumbersome but it will preserve your font choice. vıd ıoman 20:40, 29 March 2009 (UTC)
https://bugzilla.wikimedia.org/show_bug.cgi?id=8898 ¦ Reisio ( talk) 01:31, 30 March 2009 (UTC)

Article(s): Many
Request: Create a more detailed image by adding numbers that show where the assassins were like this [6], more detailed routes, and place a key in the bottom right corner that includes this key [7] and the key in this image [8]. Rename Frans Josef to France Joseph, Latiener bridge to Latin bridge, and RIver Miljacka to Miljacka river. PRODUCER ( talk) 17:40, 3 April 2009 (UTC)
Graphist opinion:
Article(s): Ethnic groups in Europe, Genetic history of Europe
Request: Create these maps: 1) News article: [9] Journal article: [10] 2) Gene Expression: [11] Journal article: [12] Phoenix of9 ( talk) 19:25, 3 April 2009 (UTC)
Graphist opinion:
Resolved Information

.svg)
Article(s): Somalia
Request: remove shading on wording, somehow make more legible... Chris (クリス • フィッチ) ( talk) 08:37, 2 February 2009 (UTC)
Graphist opinion:
- On it, but this will take a while.
Inductiveload (
talk) 10:54, 3 February 2009 (UTC)
- Ok, I've got a far as a good map of Somalia, with all the borders that are on that diagram. However I am not sure what borders are which (state, region, district), and they don't always seem to align to the borders on other maps (there are several regions which are named but I can't see in the WP articles. Since Somalia is in such turmoil, I don't know what goes where. Somone up-to-date with the sistuation/history would be better than me. I have also put a very few minor and major settlements on (they're in a hidden layer of the SVG currently), but I don't think it is useful to show these if this is intended to show the political situation rather than geography. Rivers are included, but roads are not. The image is also included in the SVG as a hidden layer, to make it easy to trace stuff on top. When this is all finished, that can be taken out. Inductiveload ( talk) 13:01, 3 February 2009 (UTC)
- Wow you're fast, and good with fine details! I like the color scheme you've chosen better, as well.
Chris (クリス • フィッチュ) (
talk) 13:45, 3 February 2009 (UTC)
- I've changed the colours to match the "standard" maps you see on WP, and added some cities and stuff. I'm going to leave it there for now, but the image is still in a hidden layer for reference. Ideally, this will be the map that is used for making future maps of the Somalia situation, as it should be relatively easy to change the boundaries. Also, the Wikimedia SVG engine seems to be struggling to render the text nicely at lower resolution.
Inductiveload (
talk) 14:54, 3 February 2009 (UTC)
- The text problem can be fixed by simply converting the text objects to path objects: in Inkscape, simply select all the text objects, then go Path -> Object to Path. The text objects are now path objects, which MediaWiki's SVG engine renders nicely, but beware: always backup the previous version of the image (with the text as text objects) so that you can change the text later if need be.
- I've changed the colours to match the "standard" maps you see on WP, and added some cities and stuff. I'm going to leave it there for now, but the image is still in a hidden layer for reference. Ideally, this will be the map that is used for making future maps of the Somalia situation, as it should be relatively easy to change the boundaries. Also, the Wikimedia SVG engine seems to be struggling to render the text nicely at lower resolution.
Inductiveload (
talk) 14:54, 3 February 2009 (UTC)
- Anyways, I can very well fix the text for you if you want, but please make sure no further text edits are performed, to make it easy on all of us.
- --[| Retro00064 | ( talk/ contribs) |] 07:08, 14 February 2009 (UTC)
- I don't understand any of that, but please, go ahead!
Chris (クリス • フィッチュ) (
talk) 08:51, 14 February 2009 (UTC)
- I know that, but I don't like doing it, as it means that no-one can ever edit the text again, and it makes the file size huge. I think it's better to leave it in and wait or the mediawiki renderer to improve! −
Inductiveload (
talk) 12:58, 14 February 2009 (UTC)
- Yes, it does increase the file size. But, as far as editing the text, that's why I saaid to back up the image! You can also use the old version saved in the "File history" section on the image description page. [|
Retro00064 | (
talk/
contribs) |] 07:37, 15 February 2009 (UTC)
- I have a similar problem with text-rendering in File:Expeditions in Antarctica before 1897.svg. The DejaVusans font I used first looked horribly as rendered by wikipedia. I now changed it to TimesNewRoman, which renders better, though I would prefer other fonts for maps. Maybe you can avoid converting text to paths by just changing to a different font. Another option would be to upload a png version of the map and link it in the image description to the svg for translation/modification purposes. bamse ( talk) 21:28, 15 February 2009 (UTC)
- Yes, it does increase the file size. But, as far as editing the text, that's why I saaid to back up the image! You can also use the old version saved in the "File history" section on the image description page. [|
Retro00064 | (
talk/
contribs) |] 07:37, 15 February 2009 (UTC)
- I know that, but I don't like doing it, as it means that no-one can ever edit the text again, and it makes the file size huge. I think it's better to leave it in and wait or the mediawiki renderer to improve! −
Inductiveload (
talk) 12:58, 14 February 2009 (UTC)
- One thing you can do in this situation is to convert texts to paths only in the final version, leaving a comment something like 'text converted to paths, use previous version for editing'. Then each revision needs two uploads (one for text version, one for converted paths), but it reduces the hassle of editing. gringer ( talk) 00:03, 16 February 2009 (UTC)
- A new more accurate map of all the administrative divisions can be found at File:Somalia Regions and Districts.png and File:Somalia Numbered Regions.png, please use this as a guideline to form this new map. The names of the regions can be found at: en:Regions and Districts of Somalia. - Wiz9999 ( talk) 21:46, 7 June 2009 (UTC)
-
 Version 1

Article(s): Waterway
Request: Wikipedia lacks a good map of the main European waterways (canals and navigable rivers), at least of large and medium size. The most reliable source of data that I have found is :
Baronnet ( talk) 07:18, 24 February 2009 (UTC)
- The request has also been posted on French ( Wikipédia:Atelier graphique/Cartes) and German ( Wikipedia:Kartenwerkstatt/Kartenwünsche) Wikipedias, but has not yet been answered on either. Baronnet ( talk) 08:02, 25 February 2009 (UTC)
Graphist opinion: OKay, I'm from the Russian Graphic Land and I'll try making this one for you, though it will take some time. Also what exactly do you want it to be? Should it be just a schematic presentation (like the pdf version) of rivers or detailed (each river traced?) In what language, or you want it just plain? -- Ahnode ( talk) 10:30, 8 March 2009 (UTC)
- Great news! Well, I think the best answer is: what is most convenient for you. A schematic presentation would be enough, except if a detailed map is easier. About the language, a blank map would be preferable at first. Then several language versions could be created from it. Thanks for undertaking this task.
Baronnet (
talk) 08:17, 13 March 2009 (UTC)
- Hello Baronnet, I started making the scheme and I'd like you to take a look at what has already been done. Do you have any comment or suggestions? Also if it is possible, could you find information on rivers for those parts of Europe that were left out on the map (Dnieper for example, a major river) and several other rivers on Russia's European territory? I would like to include that information as well, but I don't know where to look. --
Ahnode (
talk) 18:24, 14 March 2009 (UTC)
- This is a good start ! Thank you very much for the work you have put into this. I am very sorry: I do not have information about Russian waterways unfortunately. But probably some other Wikipedian will have. I suggest that from now on we continue the discussion about this map on the discussion page of the Wikimedia Commons file. Baronnet ( talk) 09:44, 16 March 2009 (UTC)
- Hello Baronnet, I started making the scheme and I'd like you to take a look at what has already been done. Do you have any comment or suggestions? Also if it is possible, could you find information on rivers for those parts of Europe that were left out on the map (Dnieper for example, a major river) and several other rivers on Russia's European territory? I would like to include that information as well, but I don't know where to look. --
Ahnode (
talk) 18:24, 14 March 2009 (UTC)
-
Description of map
Article(s): Eleanor cross
Request: Show the 12 locations, joined by a line showing the journey, on a map of either medieval or modern (but not too complicated) England, cut to the relevant area of the country. Johnbod ( talk) 13:57, 6 March 2009 (UTC)
Graphist opinion: Done via template.
-
 The only PD map currently available.
 -
 Done
Done


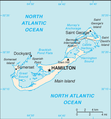
Article(s): Bermuda
Request: Please create an svg map like these: [13], [14] [15], since there isn't one made currently. Here are some example ones: [16] [17] 92.8.99.201 ( talk) 19:13, 3 April 2009 (UTC)
Graphist opinion:
- I'll make it. Sting-fr ( talk) 19:42, 9 April 2009 (UTC)
On 3/23/09, Atelerix wrote to Saravask:
Hello, Saravask,
I wonder if you would be interested in updating your excellent map of the Kashmir region at http://commons.wikipedia.org/wiki/File:Kashmir_map.svg by showing the names and boundaries of the now seven districts of the Northern Areas. The names and boundaries which you currently show within the Northern Areas, i.e., Gilgit Agency, Tribal Areas, and Chilas, ceased to be administrative dvisions of the Northern Areas a long time ago. The names and boundaries of the seven districts into which the Northern Areas is now divided may be viewed at the following website:
http://en.wikipedia.org/wiki/Northern_Areas
If you have any questions, please feel free to contact me.
Regards,
Atelerix
_____________________________________________________________________________________________
On 3/31/09, Saravask wrote to Atelerix:
Hi. Thanks for your request. I am unable to update it now because I am travelling. Please consider the Graphics Lab instead.
Regards
- How is this? Phizzy 02:00, 1 April 2009 (UTC)
-
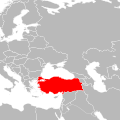 Location of Turkey
 -
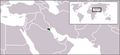 Location of Kuwait
 -
 example
 -
 example 2 of Iran Israeli relations


Article(s): Kuwait-Turkey relations
Request: Hi. I created this article, and is still needs a locater map. I have provided the locations of both countries, and an example of how other maps like that looked. However, while Turkey can be easily viewed on any map, Kuwait is harder to locate. So I was thinking that somebody could do it like the example map I provided, or the second one on Iran Israeli relations. But I'll leave that to the Graphist opinion. Deavenger ( talk) 00:34, 28 April 2009 (UTC)

Graphist opinion: I think one like Isreali-Iran one would work well with a little world locater thing. I should be ready in max 30 min. Chris DHDR 19:18, 28 April 2009 (UTC)
- I've made the map but it's too small and off centered. It's late so I'll come back and fix it tomorrow (unless someone does it before me). Chris DHDR 19:41, 28 April 2009 (UTC)
-
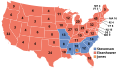 1956 Electoral College
 -
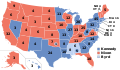 1960 Electoral College
 -
 1964 Electoral College
 -
 1968 Electoral College


Article(s): United States presidential election, 1956, United States presidential election, 1960, United States presidential election, 1964, United States presidential election, 1968
Request: The work needed on these are minor. The problem is a lot of these electoral maps are off, and my program, Photoplus, can't do proper fill-ins. I also do not know the font used for the electoral numbers and hope somebody can fix it. Here are the individual requests:
1956 map: Change Iowa from 9 electoral votes to 10. I made a version, but the font was different for Iowa's electoral votes than the rest of the states. Basically, if you can find the font, just change it from a 9 to a 10.
1960 map: Change New Mexico from Red to Blue (Kennedy won New Mexico).
1964 map: Change Virginia from 11 to 12.
1968 map: Change Virginia from 11 to 12.
Thanks! Frightwolf ( talk) 01:55, 1 May 2009 (UTC)
Graphist opinion: Not to hard to do - just changing "9" to "10" in the source code will fix it. By the way a quick look at the source code shows that the font is "normal". Chris DHDR 07:36, 1 May 2009 (UTC)
- Done. Did it easily with Inkscape. Though another issue remains - the appearance of that weird bar between Alaska and Hawaii. Anyone know how to fix it?
Chris
DHDR 10:27, 1 May 2009 (UTC)
- I'm not sure. Though I must ask you something -- when I tried to fix the map, I couldn't open it. I tried to open it in its biggest resolution, but it wouldn't let me. Very hard to explain; do you know what the problem might have been? Frightwolf ( talk) 15:01, 1 May 2009 (UTC)
-
 Example map of Turkey and Kuwait
 -
 Location of Bahrain
 -
 Location of Iran
 -
 Location of Morocco


Article(s): Bahrain–Turkey relations and Iran-Morocco relations
Request: I was figuring for Turkey-Baharain relations, someone could do something like the turkey kuwait relation map. For Iran and Morocco relation, I will let the artist doing the maps decide what is best. Thanks in advance. Deavenger ( talk) 18:10, 9 May 2009 (UTC)
Graphist opinion(s):

Article(s): List of National Treasures of Japan (ancient documents)
Request: A map like the one on the right which avoids the overcrowding of dots and labels in the middle. This could be a map showing Japan with an inset map showing a zoom into the critical region (Kyoto, Nara, etc.). bamse ( talk) 02:33, 12 May 2009 (UTC)
Graphist opinion(s):
-
 Current Middle Powers Map

![[2]](/info/en/?search=File:705x466-Suisse_topog_5%C2%B05_11%C2%B0_45%C2%B05_48%C2%B0.PNG)
![[4]](http://www.worldmapper.org/images/largepng/2.png)
![[5]](http://www-personal.umich.edu/~mejn/cartograms/population1024x512.png)
![[1]](https://commons.wikimedia.org/wiki/File:Ukraine_1937-1939.png)
![[6]](http://www.ww1-propaganda-cards.com/images/saramap.JPG)
![[7]](http://www.ww1-propaganda-cards.com/images/sarakey.JPG)
![[13]](https://commons.wikimedia.org/wiki/File:Falkland_Islands_topographic_map-en.svg)
![[14]](https://commons.wikimedia.org/wiki/File:Gibraltar_map-en.svg)
![[15]](https://commons.wikimedia.org/wiki/File:Isle_of_Man_topographic_map-en.svg)
![[16]](http://media.maps.com/magellan/Images/BERMUD-W1.gif)
![[17]](http://www.hwn.org/ftpshare/pub/bermuda.jpg)
Article(s): Middle Power
Request: Please add the countries of United Kingdom and France to the map, but please put them, and the countries of Germany and Japan in a different color. As those countries are considered great powers and middle powers, and it is to show that there is no unanimous agreement between academics with what they are. Deavenger ( talk) 16:44, 24 May 2009 (UTC)
Graphist opinion(s):
![]() Request taken by ChrisDHDR. -- Ok, it'll be up shortly.
Request taken by ChrisDHDR. -- Ok, it'll be up shortly.
 Done. They're now in dark red. Plus I removed the lines between islands.
Chris
DHDR 18:42, 24 May 2009 (UTC)
Done. They're now in dark red. Plus I removed the lines between islands.
Chris
DHDR 18:42, 24 May 2009 (UTC)
- Something happened. The coloring you did for the UK, France, Germany and Japan didn't show up at all. Deavenger ( talk) 19:01, 24 May 2009 (UTC)