| This is an archive of past discussions. Do not edit the contents of this page. If you wish to start a new discussion or revive an old one, please do so on the current talk page. |
| Archive 10 | ← | Archive 14 | Archive 15 | Archive 16 | Archive 17 |
IHME projections for the U.S.
There is the following, already in the article:
Of remarkable interest in the above pdf is Fig 14, which shows multiple forecasts. In my inexpert view, the Continued SD mandate easing forecast is very inlikely and has nothing to do with science; it projects daily new confirmed cases would reach 1,000,000 per day in December. Yes, a million.
For calibration of IMHE model performance, it would be worthwhile to collect pdfs for their previous projections; if anyone knows the pdfs, please post.
A more recent pdf of a "briefing" containing similar content as the above is this:
-
http://www.healthdata.org/sites/default/files/files/Projects/COVID/briefing_US_09.03.2020.pdf
- "If a herd immunity strategy is pursued, namely no further government intervention is taken from now to January 1, then the death toll could increase to 620,000 by January 1."
- Comment: What does "could" mean above? Could in the parallel universe? Could but does not have to? The sentence means close to nothing, as far as I can tell: It is not exposed to refutation even if a herd immunity strategy is pursued, since the consequent is still guarded by "could" rather than using the reasonably bold "will", "is predicted to" or "is projected to".
-- Dan Polansky ( talk) 15:57, 5 September 2020 (UTC)
- I'm not sure that "daily COVID-19 infections" is the same as "new confirmed cases". Whatever it represents, the prediction for several months from now is less about the big round number and more about the possibility that the number of sick people will be five or six times the current number, which is not an unreasonable prediction for what could happen if we stop trying to prevent transmission.
WhatamIdoing (
talk) 18:37, 6 September 2020 (UTC)
- If "infections" does not mean "confirmed cases"--and I admit that it really does not have to--how is that projection to be verified/testes, given that no-one knows the actual number of infections? Is it then another example of non-falsifiable pseudo-science? --
Dan Polansky (
talk) 12:23, 7 September 2020 (UTC)
- The key point is "new", not "confirmed". You could have a million sick people on December 1st without having a million new people get diagnosed on December 1st. If, e.g., it takes people an average of 20 days to recover, then a million sick people only requires an average of 50,000 new cases each day.
WhatamIdoing (
talk) 23:28, 7 September 2020 (UTC)
- Given the numbers seen in the curve in Fig 14., it's hard to tell what they really mean. The curve does not match new confirmed cases. In the Fig 14 .curve, the July peak is lower than the April peak. Whatever it means, it does not seem to mean anything directly falsifiable by future observation. -- Dan Polansky ( talk) 10:18, 8 September 2020 (UTC)
- The key point is "new", not "confirmed". You could have a million sick people on December 1st without having a million new people get diagnosed on December 1st. If, e.g., it takes people an average of 20 days to recover, then a million sick people only requires an average of 50,000 new cases each day.
WhatamIdoing (
talk) 23:28, 7 September 2020 (UTC)
- If "infections" does not mean "confirmed cases"--and I admit that it really does not have to--how is that projection to be verified/testes, given that no-one knows the actual number of infections? Is it then another example of non-falsifiable pseudo-science? --
Dan Polansky (
talk) 12:23, 7 September 2020 (UTC)
Here's more pdfs:
- http://www.healthdata.org/sites/default/files/files/Projects/COVID/RA_COVID-forecasting-USA-EEA_042120.pdf
- http://www.healthdata.org/sites/default/files/files/Projects/COVID/IHME_covid_briefing_USA_080520_0.pdf
- http://www.healthdata.org/sites/default/files/files/Projects/COVID/covid_briefing_USA_081020-1_0.pdf
-- Dan Polansky ( talk) 15:45, 5 September 2020 (UTC)
- IHME has been criticized at least
since April and was again
yesterday. Who hasn't been. -
SusanLesch (
talk) 22:47, 5 September 2020 (UTC)
- I am about to remove the IHME projections: they are not peer-reviewed science, appear outlandish on the face of it, and I see no evidence that IHME is a reliable sources. -- Dan Polansky ( talk) 06:42, 6 September 2020 (UTC)
- IHME has been criticized at least
since April and was again
yesterday. Who hasn't been. -
SusanLesch (
talk) 22:47, 5 September 2020 (UTC)
IHME has a twitter account: https://twitter.com/IHME_UW.
Some Europe pdfs:
- http://www.healthdata.org/sites/default/files/files/Projects/COVID/Estimation-update_EURO_08.27.2020.pdf
-
http://www.healthdata.org/sites/default/files/files/Projects/COVID/briefing_EURO_09.03.2020-2.pdf
- Figure 12 has projections of cumulative deaths until January; Figure 13 has projections of daily deaths. The report lacks a clickable list of figures.
-- Dan Polansky ( talk) 08:38, 6 September 2020 (UTC)
Institute for Health Metrics and Evaluation was founded by Bill & Melinda Gates Foundation. In 2017, the Gates Foundation provided IHME with another $279 million grant, says a source referenced from Wikipedia. A key activity of Bill & Melinda Gates Foundation is promotion of vaccines. It follows that IHME is in financial conflict of interest and cannot be assumed to independently report on and model issues that impact use or disuse of vaccines. -- Dan Polansky ( talk) 08:46, 6 September 2020 (UTC)
- Don't you think you are being too harsh? Why not give us the model that you DO like instead of taking one away? Certainly IHME has been criticized, in my opinion explained most notably by
Sharon Begley
in April. I think you have to give
Dr. Murray credit for sticking his neck out, and for changing the model, which are both honorable traits in science. I also find your critique based on the Gates Foundation to be specious. Clearly the far right would like to see
Gates blamed for the US economy shutting down. Here is a list of maybe two dozen models in use to choose from from the
CDC with deaths as of August 31. -
SusanLesch (
talk) 14:58, 6 September 2020 (UTC)
- I am reporting a detected confict of interest, no more and no less. Please show that IHME is a reliable source so that we can reinstate its projections. Please explain why we should include non-peer-reviewed material from an organization that has a conflict of interest. -- Dan Polansky ( talk) 15:43, 6 September 2020 (UTC)
- As for "model that you DO like", the article should not include material that editors like; it should include material that is reliable. If there are no reliable models, the article does not need to contain or use any models. As it stands, the article still includes CDC projections. --
Dan Polansky (
talk) 16:08, 6 September 2020 (UTC)
- ...the CDC projections, which are themselves only the output of statistical models such as this one.
WhatamIdoing (
talk) 18:40, 6 September 2020 (UTC)
- Is there any evidence suggesting that CDC produced outlandish unreliable projections? Or is there evidence that CDC has a financial conflict of interest through its funding? If so, removing projections by CDC would be indicated; otherwise, they can stay. --
Dan Polansky (
talk) 12:12, 7 September 2020 (UTC)
- Outlandish? Looking at your user page, I think you know enough about exponential math to know what's possible if you have 150,000 sick people at the start of September, and they each go out and infect just two others during that month, and those 300,000 go out and infect just two more people during October, and those 600,000 infect only two more during November.
WhatamIdoing (
talk) 20:00, 10 September 2020 (UTC)
- There can be no sustained exponential growth of cases and deaths. The initial appearance of rapid exponential growth was caused by rapid increase of daily new tests, as confirmed by test positivity ratio charts. The exponential scare has been a key part of this cognitive fiasco. -- Dan Polansky ( talk) 07:10, 13 September 2020 (UTC)
- Outlandish? Looking at your user page, I think you know enough about exponential math to know what's possible if you have 150,000 sick people at the start of September, and they each go out and infect just two others during that month, and those 300,000 go out and infect just two more people during October, and those 600,000 infect only two more during November.
WhatamIdoing (
talk) 20:00, 10 September 2020 (UTC)
- Is there any evidence suggesting that CDC produced outlandish unreliable projections? Or is there evidence that CDC has a financial conflict of interest through its funding? If so, removing projections by CDC would be indicated; otherwise, they can stay. --
Dan Polansky (
talk) 12:12, 7 September 2020 (UTC)
- ...the CDC projections, which are themselves only the output of statistical models such as this one.
WhatamIdoing (
talk) 18:40, 6 September 2020 (UTC)
- Being a non-profit organization that was founded by a billionaire who thinks that vaccines save lives does not constitute a conflict of interest. You might call them "biased", as in "biased in favor of reality", but that's not a conflict of interest, and you will find a similar bias in every reputable scientific organization.
WhatamIdoing (
talk) 18:39, 6 September 2020 (UTC)
- Let me articulate the obvious in more detail: 1) organization A promotes vaccines; 2) organization B received substantial funding from organization A in 2017; 3) researches and projections in area C impact the acceptability of use of vaccines; vaccines, like other pharmaceutical interventions, are not 100% free from adverse effects, which may impact their acceptability; 4) organization A has interest that organization B produces research outcomes and speculative projections that improve the acceptance of vaccines; 5) we get: organization B has a financial conflict of interest as far as results in area C. -- Dan Polansky ( talk) 12:06, 7 September 2020 (UTC)
- @ MrX: You wrote: "IHME is a frequently cited source by numerous other reliable sources": can you please substantiate that and thus provide some example reliable sources on science that cite IHME, ideally that cite IHME in capacity of a reliable source? (A reliable source could cite IHME projection to show that it was wrong, and that's a different case.) -- Dan Polansky ( talk) 12:20, 7 September 2020 (UTC)
- IHME projections suggest efficacy of non-pharmaceutical interventions: mask-wearing. Would non-peer-reviewed IHME projection be sufficient for Wikipedia to report on efficacy of a pharmaceutical intervention, i.e. a pharmaceutical drug? Does Wikipedia accept non-peer-reviewed math-aided speculation to support efficacy claims of medical interventions? --
Dan Polansky (
talk) 12:35, 7 September 2020 (UTC)
- Let me work backwards. First, IHME projections do not suggest efficacy of non-pharmaceutical interventions, so please let's not start a discussion with a false premise. IHME show projections based on statistical data modeling. That is where their expertise lies. Second, the material that you keep removing is already cited to two secondary sources. Here are some more reliable sources that cite IHME COVID-19 models:
NPR,
Reuters,
The Washington Post,
CNBC,
CNN,
Denver Post,
Forbes,
The Hill,
Live Science "highly-cited",
The New York Times,
Fox News,
Wired,
ABC News, and
The New England Journal of Medecine. Masks are being touted (by anyone, as far as I know) as a cure, a treatment, or a drug. -
MrX
🖋 13:24, 7 September 2020 (UTC)
- Can you give us reliable sources on science? Mainstream media are not reliable on science and do not establish reliability of IHME.
- On another note, I was once more reverted using "reverted third removal in a day by same editor [...]", which is inaccurate: I only removed the material two times on this day, each time with a different rationale; the last reversion of my removal is weak on process and completely silent on substance. -- Dan Polansky ( talk) 14:09, 7 September 2020 (UTC)
- On efficacy: The article says "The Institute for Health Metrics and Evaluation (IHME) predicted that universal wearing of face masks could prevent 17,000–28,000 deaths between June 26 and October 1, 2020"; that is a clear efficacy claim, a claim that mask weaking saves so and so many lives. It traces to material that is not peer-reviewed science. --
Dan Polansky (
talk) 14:12, 7 September 2020 (UTC)
- Mainstream sources are generally reliable, and certainly usable for statistical modeling properly attributed to IHME. I disagree that there is a medical efficacy claim at play. -
MrX
🖋 14:46, 7 September 2020 (UTC)
- As for "Mainstream sources are generally reliable": please substantiate; Ben Goldacre's book Bad Science showed that they are not, at least as for claims on science; "on science" is what is omitted in the above response, and yet is key. Mainstream media can be reasonably well relied on for a claim "X projects Y" (even that has to be double checked on a case-to-case basis), but that does not establish reliability of X itself and of Y. Medical efficacy is at play since intervention X is indicated to save the number Y of lives; I don't see why efficacy of such an intervention should be held to such low referencing requirements while for drugs even a proper RCT is alone not enough and meta-analysis is required. -- Dan Polansky ( talk) 15:35, 7 September 2020 (UTC)
- And we're talking mainstream media such as NPR, not mainstream sources; scientific journals are mainstream sources. --
Dan Polansky (
talk) 15:37, 7 September 2020 (UTC)
- We do not need to restrict ourselves to peer reviewed science journals for a properly attributed projection from a reputable university. I dispute that general mainstream sources are incapable of science-related reporting. Wearings masks are not drugs, treatments, or cures, as I said before. Efficacy is not a consideration in this matter. -
MrX
🖋 16:01, 7 September 2020 (UTC)
- "I dispute" is not an argument or subtantiation. Please substantiate that mainstream media are generally reliable on science. -- Dan Polansky ( talk) 16:21, 7 September 2020 (UTC)
- And once you've done substantiating that, please explain why
Wikipedia:MEDRS rejects mainstream media for medical claims; if they are generally reliable, why reject them? --
Dan Polansky (
talk) 16:27, 7 September 2020 (UTC)
- WP:NEWSORG says " News reporting from well-established news outlets is generally considered to be reliable for statements of fact." From WP:MEDRS: "... all biomedical information must be based on reliable, third-party published secondary sources, and must accurately reflect current knowledge." The sources that have cited the IHME's models do accurately reflect the current knowledge that wearing masks helps reduce the spread of COVID-19. WP:USEBYOTHERS strongly indicates IHME is a reliable source for information about their data model.
- Now it's your turn: Kindly substantiate that a statistical data model is an expression of medical efficacy. Substantiate that IHME's qualified projections of possible outcomes are claims of medical efficacy. -
MrX
🖋 17:30, 7 September 2020 (UTC
- May I suggest you read what you linked to?
wp:MEDPOP i.e.? AND
wp:RS/MC?
--TMCk (
talk) 18:00, 7 September 2020 (UTC)
- No, because the snarky implication is that I haven't already. I've previously rebutted the claim that
WP:RS/MC applies, above. Among other things,
WP:MEDPOP advises "As the quality of press coverage of medicine ranges from excellent to irresponsible, use common sense, and see how well the source fits the verifiability policy and general reliable sources guidelines." The vast majority of this article is based on so-called popular sources. I think we're good here. -
MrX
🖋 18:16, 7 September 2020 (UTC)
- Your quoting a paragraph that starts with "Conversely, the high-quality popular press can be a good source for social, biographical, current-affairs, financial, and historical information in a medical article." I won't respond to further selective quoting or personal claims .
--TMCk (
talk) 18:33, 7 September 2020 (UTC)
- Technically, a claim that someone said something isn't Wikipedia:Biomedical information, but we have to be careful not to imply biomedical information in the process.
- I believe that the original (30 March 2020) paper is at
https://www.medrxiv.org/content/10.1101/2020.03.27.20043752v1 and the April paper is at
https://www.medrxiv.org/content/10.1101/2020.04.21.20074732v1
WhatamIdoing (
talk) 23:46,: 7 September 2020 (UTC)
- Thank you for the above links to IHME preprints. Let me note that they are preprints, not peer-reviewed science. -- Dan Polansky ( talk) 10:38, 8 September 2020 (UTC)
- Your quoting a paragraph that starts with "Conversely, the high-quality popular press can be a good source for social, biographical, current-affairs, financial, and historical information in a medical article." I won't respond to further selective quoting or personal claims .
--TMCk (
talk) 18:33, 7 September 2020 (UTC)
- No, because the snarky implication is that I haven't already. I've previously rebutted the claim that
WP:RS/MC applies, above. Among other things,
WP:MEDPOP advises "As the quality of press coverage of medicine ranges from excellent to irresponsible, use common sense, and see how well the source fits the verifiability policy and general reliable sources guidelines." The vast majority of this article is based on so-called popular sources. I think we're good here. -
MrX
🖋 18:16, 7 September 2020 (UTC)
- May I suggest you read what you linked to?
wp:MEDPOP i.e.? AND
wp:RS/MC?
--TMCk (
talk) 18:00, 7 September 2020 (UTC)
- We do not need to restrict ourselves to peer reviewed science journals for a properly attributed projection from a reputable university. I dispute that general mainstream sources are incapable of science-related reporting. Wearings masks are not drugs, treatments, or cures, as I said before. Efficacy is not a consideration in this matter. -
MrX
🖋 16:01, 7 September 2020 (UTC)
- Mainstream sources are generally reliable, and certainly usable for statistical modeling properly attributed to IHME. I disagree that there is a medical efficacy claim at play. -
MrX
🖋 14:46, 7 September 2020 (UTC)
- Let me work backwards. First, IHME projections do not suggest efficacy of non-pharmaceutical interventions, so please let's not start a discussion with a false premise. IHME show projections based on statistical data modeling. That is where their expertise lies. Second, the material that you keep removing is already cited to two secondary sources. Here are some more reliable sources that cite IHME COVID-19 models:
NPR,
Reuters,
The Washington Post,
CNBC,
CNN,
Denver Post,
Forbes,
The Hill,
Live Science "highly-cited",
The New York Times,
Fox News,
Wired,
ABC News, and
The New England Journal of Medecine. Masks are being touted (by anyone, as far as I know) as a cure, a treatment, or a drug. -
MrX
🖋 13:24, 7 September 2020 (UTC)
- (Outdent) "Impact of face coverings" section contains text that suggests efficacy by suggesting lives saved via a certain intervention. Let us remove "Impact of face coverings" section again as liable to mislead the reader and I ask other editors for support. As to whether claims about efficacy of mask wearing are medical, here is
an example preprint that appears in category "preprints.org > medicine & pharmacology > general medical research > doi: 10.20944/preprints202004.0203.v2". We must not mislead and I request "Impact of face coverings" to be removed as long as it is only traced to math-aided speculation such as IHME projections. I note that the claim that "mainstream media are generally reliable on science" has not been substantiated so far. --
Dan Polansky (
talk) 09:34, 8 September 2020 (UTC)
- I think that is a bad idea, and I oppose removing that section. WhatamIdoing ( talk) 21:23, 8 September 2020 (UTC)
- I would oppose removing this section for reasons already stated. The claim that this material suggests efficacy has not been substantiated. -
MrX
🖋 11:46, 9 September 2020 (UTC)
- There is nothing to substantiate for me: from looking at COVID-19_pandemic_in_the_United_States#Impact_of_face_coverings, it is obvious the section suggests that mask wearing saves lives. Obvious. The section contains IHME projections and nothing else. The section does not warn the reader that IHME projections are fundamentally unreliable and can be easily off by factor 10 or more. Mainstream media have not substantiated the claim that IHME projections are reliable and in fact do not even claim as much; they merely report IHME projections. I ask for substantiation of the notion that IHME projections are reliable, which can be done by comparing their past projections against the actuals; this comparison could have been published by the mainstream media and if so, a link to such a comparison would be sufficient. -- Dan Polansky ( talk) 07:08, 13 September 2020 (UTC)
On Trump downplaying the virus
In the recently-published interview of Trump with Bob Woodward, he admitted that he "play[ed] it down", where "it" refers to COVID-19: Guardian, NYT (opinion), ABC, USA Today, Global News, Reuters, and, finally, CNN. Since "Meanwhile, President Donald Trump downplayed the threat posed by the virus and claimed the outbreak was under control" is already in the article, I think it's probably a good idea to add this, too. Ahmad talk 00:50, 10 September 2020 (UTC)
- I agree. – Muboshgu ( talk) 00:54, 10 September 2020 (UTC)
- On a somewhat related note, I am unclear about why Trump is singled out as the sole person downplaying the virus. The reason could be that he is the U.S. president. On the other hand, other key public figures made statements that downplayed the virus. If the question is what key public officials downplayed the virus, the answer cannot possibly be, Trump. (Trump did downplay the virus, to the point of absurdity, but he is far from alone.) -- Dan Polansky ( talk) 08:30, 13 September 2020 (UTC)
COVID-19 cases in the United States chart location
I've moved the "COVID-19 cases in the United States" chart back up to the timeline section near the top of the article. (I also tweaked it with a slight width reduction.) This placement was previously discussed [1] and the resulting consensus at that time was to leave the chart at the top.
Personally, this chart is the first thing I look for when visiting this and other COVID-19 in Country articles. I expect many others do the same. This is high value content and placing it consistently near the top as in other country articles is desirable. -- Tom N talk/ contrib 07:31, 15 September 2020 (UTC)
Should we also restore the state table back to the top? -- Tom N talk/ contrib 07:49, 15 September 2020 (UTC)
- The table does not really belong to "Timeline" since it does not show timeline or any time-dependent development. I does belong to Statistics as per section heading. The table is not very informative, showing absolute numbers only and showing no time development of new or current cases, hospitalizations or deaths; it cannot be ruled out that many readers come for the table, though. A transparent reference to the previous discussion: Talk:COVID-19 pandemic in the United States/Archive 10#RfC on placement of cumulative cases bar chart and US cases by state, April. -- Dan Polansky ( talk) 09:54, 15 September 2020 (UTC)
- Literally everyone I know who visits this page (~8 people) comes here for the table. It's one of the best presentations of the state cases available since it's compact and easy to read. I'd support it going back to the top, even into the intro. JoelleJay ( talk) 18:26, 15 September 2020 (UTC)
COVID Timeline Chart
Can we make the COVID Timeline chart include New Deaths by the day, and New Cases by the day, (perhaps as something you click to expand, if necessary), instead of just Total # Of Cases, and Total # Of Deaths. — Preceding unsigned comment added by 2600:8801:d900:2530:4dbe:3d10:c946:208c ( talk) 04:41, 18 September 2020 (UTC)
COVID Tracking Project data released under CC-BY 4.0
The COVID Tracking Project, which is focused on U.S. COVID statistics, has just released all of their data under a CC-BY 4.0 license: https://covidtracking.com/about-data/license. Kaldari ( talk) 20:27, 15 September 2020 (UTC)
Figures extrapolated from 1-15 July (for 20 Sep)
I've posted a couple of times about this, now archived off. I made a least-squares fit of the coefficients a and b of an exponential function
deaths = a × exp(b × days)
to the data tabulated in the Wikipedia article from 1 to 15 July 2020, where deaths is the number of deaths reported on a day, and days is the number of days, with 1 July 2020 as day 1. The result was
deaths = 116.7645323 × exp(5.178324329×10⁻³ ×days)
Using the Johns Hopkins data instead of what was reported in the article gives significantly higher figures.
This was a pure mathematical exercise, making no assumptions whatsoever about reality, pure least-squares fit without weighting or fiddling. At the time I evaluated the result for dates up to mid-November (extrapolation), making no claims that this was realistic (in fact, as I said at the time, I thought that the numbers were pessimistic, and the real statistics would be better.)
Anyway, I have gone back to my July spreadsheet and read the value of deaths for 20 September: it is 178,535 (extrapolated from the figures for 1-15 July, as stated).
I also, later, did a calculation, again purely mathematical, with no assumptions about reality, that if the number of deaths increased by 0.5% per day, starting with the extrapolated figure for 2 September (which is just the day I did the calculation, not a special date), the figure for 20 September would be 177,922.
I report these figures with no comment. If anyone wants the spreadsheet they are welcome to it.
Pol098 ( talk) 18:51, 20 September 2020 (UTC)
Media misreporting
@
Evergreen: re your
revert of my edit as NOR: The 3rd cite I listed is
this Cambridge journal article which states: In Figure 1, 4 cases grouped in the dotted-line box are also included among 7 infections, illustrating that all cases are infections but not all infections are cases, a potential point of confusion in media reports of COVID-19. For example, a high number of coronavirus infections were discovered in US meat-packing plants in Iowa,19 but these infections were reported as cases in the media,20 potentially causing a type of information bias known as misclassification.21
Cites
19 and
20 from the Cambridge article are the first two cites in my edit. Kindly undo your revert.
Humanengr (
talk) 06:41, 2 October 2020 (UTC)
- @ Humanengr: Thank you for explaining. I see what you meant now. I've reverted myself. EvergreenFir (talk) 16:19, 2 October 2020 (UTC)
Article for White House COVID-19 cluster
Good afternoon, I was wondering if there is an article that covers specifically the infection of the president and the related infections by people associated with the White House? If not I propose we might split that off to an article named White House COVID-19 cluster or similar so that the timeline and list of associated cases can be expanded to article length. William Graham talk 16:03, 3 October 2020 (UTC)
- Nevermind it's at White House outbreak of COVID-19. William Graham talk 16:05, 3 October 2020 (UTC)
Predictions and preparations
Storing a copy here for the archive. This edit removed 16,000 characters that we already had in the article Pandemic_predictions_and_preparations_prior_to_the_COVID-19_pandemic#United_States. - SusanLesch ( talk) 23:28, 29 September 2020 (UTC)
To add to article
Important information to add to this article: by mid-January 2020, about 4,000 people had already entered the U.S. directly from Wuhan, and in January alone, about 381,000 travelers flew directly from China to the U.S. I didn't see either of these statistics mentioned in the article as it currently stands. 173.88.246.138 ( talk) 05:11, 30 September 2020 (UTC)
- Greetings, 173.88.246.138. Can you make a specific request per WP:EDITREQ? Then you are more likely to see results. - SusanLesch ( talk) 19:18, 2 October 2020 (UTC)
RFC on mortality
- The following discussion is an archived record of a request for comment. Please do not modify it. No further edits should be made to this discussion. A summary of the conclusions reached follows.
Should the lead inform the reader that the United States has more than 20% of the world's mortality from COVID-19?
- One view prefers deaths per capita as a measure of severity.
- The other view is that the context of the US fraction is important for understanding.
Yes or No. Previous discussion. -16:40, 4 September 2020 (UTC)
Poll
Yes. According to Dan Polansky: "the true indicator of severity" is "deaths per capita". So I looked up reliable sources. Last semester I got an A in epidemiology but it did not prepare me to sort through these options.
- The U.S. Pandemic Severity Assessment Framework (2017) uses 7 indicators of transmissibility plus 3 main but a total of 8 severity indicators in its clinical dimension: case fatality rate, case-hospitalization ratio, deaths-hospitalization ratio, a few more, and excess deaths.
- Wu et al. in Nature sort of agrees: "The clinical severity of infectious diseases is typically measured in terms of infection fatality risk (IFR), symptomatic case fatality risk (sCFR) and hospitalization fatality risk (HFR)."
- The World Health Organization (WHO) says: "The true severity of a disease can be described by the Infection Fatality Ratio."
Wikipedia should be written for the widest possible general audience per WP:TECHNICAL, specifically WP:ONEDOWN and the guide WP:AUDIENCE. The Hemingway app says this article is post graduate level. I suggest that people who wish to do so put their thoughts into Statistics of the COVID-19 pandemic in the United States, like Statistics of COVID-19 pandemic in India and Statistics of the COVID-19 pandemic in Poland. - SusanLesch ( talk) 22:11, 4 September 2020 (UTC)
- Could you phrase the proposal in a more complete sentence? This clearly stands or falls with formulation.
effeiets
anders 05:37, 5 September 2020 (UTC)
- Surely, I am happy to try. Should the lead state the number of deaths in the US given as a proportion of the number of deaths worldwide? The US population is
about 4% of the world. Should we say here that the US death toll is about 20% of the world death toll from COVID-19? Corrections welcome. -
SusanLesch (
talk) 15:35, 5 September 2020 (UTC)
- The question of the poll is clearly stated: "Should the lead inform the reader that the United States has more than 20% of the world's mortality from COVID-19?" Should it or should it not? -- Dan Polansky ( talk) 16:01, 5 September 2020 (UTC)
- Surely, I am happy to try. Should the lead state the number of deaths in the US given as a proportion of the number of deaths worldwide? The US population is
about 4% of the world. Should we say here that the US death toll is about 20% of the world death toll from COVID-19? Corrections welcome. -
SusanLesch (
talk) 15:35, 5 September 2020 (UTC)
- Stringing together sentences not supporting the proposal as is done above does not do the matter much good. Sure, for comparing one epidemic to another, IFR is a prime candidate for severity indicator. But for intercountry comparisons, death rate per million is fine and we do not know IFR on country level. Certainly none of the above sources indicate that absolute death count is the meaningful severity indicator. On another note, excess deaths mentioned above would also be meaningful but only when adjusted for population size, so again excess death rate per million. ("Last semester I got an A in epidemiology": I wonder what SusanLesch is studying and what the qualifications and degrees are, if we are to play this game. Maybe better stick with discussing the substance.) -- Dan Polansky ( talk) 06:48, 5 September 2020 (UTC)
- No. Mark D Worthen PsyD (talk) [he/his/him] 14:46, 5 September 2020 (UTC)
- However, we should provide the U.S. per-capita death rate and nation rank, plus the
case fatality ratio and nation rank in the first paragraph,
like this example in my sandbox.
Mark D Worthen PsyD
(talk) [he/his/him] 20:20, 17 September 2020 (UTC)
- Comment. A consensus is developing here to include more than one measure in the lead. My preference is to place statistics in the lead's final paragraph (and we can include the notes you suggested today) and not overload the first paragraph with more numbers. Michelangelo1992 and effeietsanders propose a version below. We'll see when this RfC closes. Thank you. -
SusanLesch (
talk) 22:06, 17 September 2020 (UTC)
- Sure. Thank you for letting me know. I'll stay tuned for a new RfC. :-) Mark D Worthen PsyD (talk) [he/his/him] 22:25, 17 September 2020 (UTC)
- Comment. A consensus is developing here to include more than one measure in the lead. My preference is to place statistics in the lead's final paragraph (and we can include the notes you suggested today) and not overload the first paragraph with more numbers. Michelangelo1992 and effeietsanders propose a version below. We'll see when this RfC closes. Thank you. -
SusanLesch (
talk) 22:06, 17 September 2020 (UTC)
- However, we should provide the U.S. per-capita death rate and nation rank, plus the
case fatality ratio and nation rank in the first paragraph,
like this example in my sandbox.
Mark D Worthen PsyD
(talk) [he/his/him] 20:20, 17 September 2020 (UTC)
- No. Real figures for the world will probably never be known, per article. For instance, in April China revised its case totals much higher and increased its death toll estimate by 50%. -- Light show ( talk) 17:37, 5 September 2020 (UTC)
- Note that due to "both funeral urns distribution and continuous full capacity operation of cremation services," some sources estimated 10 times China's official death toll by the end of March, per a Yale preprint. -- Light show ( talk) 19:59, 5 September 2020 (UTC)
- Yes. Population count is of no significance to viral spread. Population density matters a great deal. The fact that the US has such a high death count yet one of the lowest population densities among severely affected countries is highly significant.
2A02:6B61:214E:0:709D:2876:6011:2950 (
talk) 08:32, 8 September 2020 (UTC)
- I strike out the above yes as coming from an anonymous account that has zero other edits. As for the substance: Population density could play a role but there are highly dense regions in the U.S. so this is an inconclusive argument. Even if one would like to take population density into account, comparing absolute death counts would still be inappropriate, and another method would need to be invented. --
Dan Polansky (
talk) 09:56, 8 September 2020 (UTC)
- Un-struck as the striking out was illegitimately justified and came from an account owner who, per his edit history, is clearly intent on adding political bias to scientific subject matter. The phrase "population density could play a role," key word "could," further demonstrates that said owner has no understanding of virology.
2A02:6B61:214E:0:8DFB:C745:38F4:E3D9 (
talk) 10:25, 8 September 2020 (UTC)
- I don't believe a vote by an anon with zero other edits can count; this cannot be possibly free-for-all for anyone on the internet with zero Wikipedia editing history. On the substance: I saw a chart of population density vs. death rate that showed no correlation so we get could rather than certitude; I do not have a link to the chart, though. I leave comments on my person without response and shall continue to focus the discussion on substance and subject matter. --
Dan Polansky (
talk) 10:47, 8 September 2020 (UTC)
- It wasn't a comment on your person, it was a comment on your competence w.r.t. this particular subject. You demonstrated your lack of the latter via your second-to-last post in this thread. Your latest demonstrates yet more misunderstanding: a lack of correlation between countries' population densities and Covid-19 death rates does not counter the fact that the proximity of potential hosts is the single most important factor determining the ability of a virus to spread.
2A02:6B61:214E:0:8DFB:C745:38F4:E3D9 (
talk) 11:09, 8 September 2020 (UTC)
- Trying to stick to substance, I'll try to rephrase: low population density in the U.S. as a whole could contribute to U.S. death rate being lower than it might have been otherwise, but one has to take into account that U.S. has considerable area of highly densely populated regions, so it remains a could. If someone sees through this complication of the population density being highly heterogeneous and draws a stronger conclusion, that's up to them and they may be right. The conclusion surely isn't that comparing countries on the basis of absolute death counts is meaningful. Let us add that User:Light show pointed out above that we have no solid data from the highly populous China, which the anon voting "yes" left without a note in their !vote. To me, comparing countries on absolute deaths is obviously meaningless, and I wonder whether I am spending my time in the right discussion. --
Dan Polansky (
talk) 12:04, 8 September 2020 (UTC)
- You continue to conflate correlation with causation. The purpose of this proposal is not to compare between particular countries' death counts, but rather to specifically highlight the US' deaths figure, which is disproportionately high given its density and (particularly economic) means to combat the virus. To counter your oft-repeated mention of China, India is almost as populous as China but has approximately a third of the US' death count, despite being significantly more densely populated and far less wealthy. I suspect that you have no confidence in Indian statistics either, though. 2A02:6B61:214E:0:8DFB:C745:38F4:E3D9 ( talk) 12:34, 8 September 2020 (UTC)
- Trying to stick to substance, I'll try to rephrase: low population density in the U.S. as a whole could contribute to U.S. death rate being lower than it might have been otherwise, but one has to take into account that U.S. has considerable area of highly densely populated regions, so it remains a could. If someone sees through this complication of the population density being highly heterogeneous and draws a stronger conclusion, that's up to them and they may be right. The conclusion surely isn't that comparing countries on the basis of absolute death counts is meaningful. Let us add that User:Light show pointed out above that we have no solid data from the highly populous China, which the anon voting "yes" left without a note in their !vote. To me, comparing countries on absolute deaths is obviously meaningless, and I wonder whether I am spending my time in the right discussion. --
Dan Polansky (
talk) 12:04, 8 September 2020 (UTC)
- It wasn't a comment on your person, it was a comment on your competence w.r.t. this particular subject. You demonstrated your lack of the latter via your second-to-last post in this thread. Your latest demonstrates yet more misunderstanding: a lack of correlation between countries' population densities and Covid-19 death rates does not counter the fact that the proximity of potential hosts is the single most important factor determining the ability of a virus to spread.
2A02:6B61:214E:0:8DFB:C745:38F4:E3D9 (
talk) 11:09, 8 September 2020 (UTC)
- I don't believe a vote by an anon with zero other edits can count; this cannot be possibly free-for-all for anyone on the internet with zero Wikipedia editing history. On the substance: I saw a chart of population density vs. death rate that showed no correlation so we get could rather than certitude; I do not have a link to the chart, though. I leave comments on my person without response and shall continue to focus the discussion on substance and subject matter. --
Dan Polansky (
talk) 10:47, 8 September 2020 (UTC)
- Un-struck as the striking out was illegitimately justified and came from an account owner who, per his edit history, is clearly intent on adding political bias to scientific subject matter. The phrase "population density could play a role," key word "could," further demonstrates that said owner has no understanding of virology.
2A02:6B61:214E:0:8DFB:C745:38F4:E3D9 (
talk) 10:25, 8 September 2020 (UTC)
- I strike out the above yes as coming from an anonymous account that has zero other edits. As for the substance: Population density could play a role but there are highly dense regions in the U.S. so this is an inconclusive argument. Even if one would like to take population density into account, comparing absolute death counts would still be inappropriate, and another method would need to be invented. --
Dan Polansky (
talk) 09:56, 8 September 2020 (UTC)
- Yes, with modifications. The RFC states: "Should the lead inform the reader that the United States has more than 20% of the world's mortality from COVID-19?" I believe that percentages are an easy way for general readers to understand large numbers. Because it is true that many nations do not have robust health systems, the true number of COVID-19 deaths is unknown. I would therefore suggest the following language, or something similar depending on actual placement in the lede. "As of (DATE) the United States has (APPROXIMATE NUMBER) COVID-19 deaths. This represents (PERCENT) of the world's known COVID-19 deaths.[1]." [1] can be a footnote with more detail about the difficulty of counting deaths, and this should also be discussed further in the article body (which it currently is).
Michelangelo1992 (
talk) 12:11, 8 September 2020 (UTC)
- What is the rationale for the above? How do you address the reservations raised? --
Dan Polansky (
talk) 12:16, 8 September 2020 (UTC)
- Frankly, I am not quite sure I understand your reservations about my wording. It seems to address your concerns (by including the fact that not all COVID-19 deaths can be known). It is clear and accurate. Perhaps you can explain why you disagree with the wording I have suggested? Michelangelo1992 ( talk) 16:31, 11 September 2020 (UTC)
- What is the rationale for the above? How do you address the reservations raised? --
Dan Polansky (
talk) 12:16, 8 September 2020 (UTC)
- No, in part per #Mortality in the United States. The percentage proposed gives the impression that U.S. is doing very bad while in fact the percentage is very much contributed to by 1) U.S. being very populous, and 2) the very populous China, which does not even report test counts, probably reporting bogus death data. U.S. is in the first league of the countries with death rate per million in the range of 500-1000 and such is already indicated in the article; that paints a fair picture of how U.S. is doing. -- Dan Polansky ( talk) 12:23, 8 September 2020 (UTC)
- Agree. And from the now known fact that about half or more of deaths in the U.S. and Europe have occurred at nursing homes, and that the U.S. was possibly the first country to become ie. aware of that reality, its death counts began including those figures much before other countries. And with the wide variation in medical capacity throughout the world, the total number of cases and deaths are less trustworthy. In fact, the entire rationale for this obsessive focus on whether "The lead ought to say that the total number of deaths in the U.S. is the world's highest," seems to have aspects of a contest.-- Light show ( talk) 20:06, 11 September 2020 (UTC)
- More generally, meaningful comparison of per capita death rates can only begin by considering the recognized risk factors for death from the illness such as age, sex, race demographics, and pre-existing medical conditions in the compared populations. [1]
DisCogniz ( talk) 05:46, 21 September 2020 (UTC)
- Yes because it is standard encyclopedic information and to not include it is clear censorship. Per capita rates can be said as well. -- Investigatory ( talk) 11:02, 17 September 2020 (UTC) Also if you look at Dan Polanskys comment above "gives the impression that U.S. is doing very bad" - I dont think it does it is just standard statistics, that there is a lot of death in the US from this virus. The article should be apolitical -- Investigatory ( talk) 11:05, 17 September 2020 (UTC)
- Yes, mostly echoing the IP. While per capita figures are usually the most relevant ones for most global statistics, in this case they really aren't, at least until the virus starts getting near saturation. Before then, a country with 300 million people and a country with a million people would be expected to have the same number of cases all else being equal, because the virus spreads at the same constant rate in the absence of countermeasures, and the countermeasures aren't per capita either. As a more concrete example, currently the US has more total cases than India, a country with four times its population, and only three ranks down the list of most cases is Peru, a country with a tenth the US's population. (On the other hand, the countries with the most cases per capita are countries with tiny populations like Qatar, Bahrain, and Aruba.) Loki ( talk) 03:13, 20 September 2020 (UTC)
- Yes per supporting parties. ~ HAL 333 03:15, 29 September 2020 (UTC)
CDC ref for US deaths
Currently the article has CDC ref for US deaths as https://www.cdc.gov/coronavirus/2019-ncov/cases-updates/cases-in-us.html , which forwards to a MUCH longer CDC URL, which seems unnecessarily long as CDC covid-tracker webpage has much shorter URL of https://covid.cdc.gov/covid-data-tracker/#cases_totaldeaths . I was going to update the URL, but the ref also says "Updated, one day after other sources." which seems confusing (what other sources? Johns Hopkins University is the only other death reference in the infobox). I'm guessing "Updated, one day after other sources." means that CDC posts their numbers one day after JHU. (Initially i though "Updated, one day after other sources." meant that article death number from the CDC should be updated one day after article updated with death number from JHU). And why not include date in ref?? (ie. I had to go through articles edit history to find out article's number of death (via CDC) of 210,232 deaths dated "03:47, 8 October 2020") -- EarthFurst ( talk) 07:09, 9 October 2020 (UTC)
All fake
This is all part of the NWO. I will never be fooled by their fear monger and fabricated data. Covid is a hoax ( talk) 13:11, 15 October 2020 (UTC)
- @ Covid is a hoax: Could you provide some reliable sources to back up your point? Thanks, EDG 543 ( message me) 13:14, 15 October 2020 (UTC)
Please consider incorporating material from the above draft submission into this article. Drafts are eligible for deletion after 6 months of inactivity. ~ Kvng ( talk) 17:03, 21 October 2020 (UTC)
- I don't think the material there is useful to this article, as it was written very much with a smaller scope in mind during the early part of the outbreak, but I've posted on the talk page there about potentially using it for an article on notable early cases in the US.-- ERAGON ( talk) 18:58, 24 October 2020 (UTC)
Infection Fatality Ratio
I'm trying to do as little Wikipedia editing as possible these days, but this article is in need of up-to-date content on Covid-19's estimated Infection Fatality Ratio (IFR). The current scientific consensus appears to be that the IFR is about 0.6%-0.7%. [2] [3] [4] [5] Currently our article's only info about IFR estimates is a Fauci NEJM editorial from February saying that the IFR "may ultimately be more akin to those of a severe seasonal influenza (which has a case fatality rate of approximately 0.1%)." That's from an unreliable opinion source; but perhaps more importantly it's now out of date and misleading. We have a lot more statistics now than we did back in February. R2 ( bleep) 17:37, 5 October 2020 (UTC)
I removed the offending material, along with the paragraph that followed, which said that (at that time) there were no cases in children. That content is of course woefully outdated, and Fauci has revised his position on these things. To be clear, I'm not necessarily opposed to Fauci's February statements being restored as long as they're put in neutral historical context, and the article clearly articulates the current scientific consensus with due weight. R2 ( bleep) 16:42, 8 October 2020 (UTC)
- Up to 100 million suspected cases of COVID-19 out of 350 million people in the USA, thus the estimated 200-300,000 deaths can lead us to have a 0.3% infection fatality rate (300,000 out of 100 million). The WHO announced up to 780 million suspected cases of COVID-19 worldwide instead of going by 37 million confirmed cases and over 2 million deaths instead of one million. The article should mention the number of suspected cases in the USA and the world. Adinneli ( talk) 21:25, 9 October 2020 (UTC)
- @ Ahrtoodeetoo: The Fauci Feb 28 material was the topic of a peer-reviewed (not opinion) article in August. It is part of the historical record and so is appropriate for the monthly diary. What about the text was NPOV? Open to suggestions. Re 780 million that Adinneli mentioned, I see this CNN cite and the original WHO statement. Humanengr ( talk) 21:41, 19 October 2020 (UTC)
- The problem is that Fauci was speculating that the IFR might end up at 0.1%, "more akin to those of a severe seasonal influenza," while Fauci and the scientific consensus now believe the IFR is 0.6-0.7%. Sure the Fauci quote is historically accurate, but it's misleading without additional context. The claim that Covid-19 is equivalent to the seasonal flu in particular has been rejected by tons of reliable sources since it continues to be pushed by DJT and his supporters. R2 ( bleep) 00:17, 20 October 2020 (UTC)
- Reworking:
On February 28, Dr. Anthony Fauci and others from the National Institute of Allergy and Infectious Diseases (NIAID) and the CDC wrote, in an editorial published in the New England Journal of Medicine that “...the overall clinical consequences of COVID–19 may ultimately be more akin to those of a severe seasonal influenza (which has a case fatality rate of approximately 0.1%).” [1] (An independent researcher later noted that the 0.1% figure was not the case fatality rate (CFR) for influenza but rather than the Infection fatality rate (IFR), and that the CDC had not historically used IFR as a metric.) On March 11, as noted below, Fauci testified before Congress that coronavirus has a mortality of 10 times that of influenza. On July 10, the CDC adopted IFR “as a new parameter value for disease severity”, when it published a value of 0.65% as a 'best estimate' for planning purposes. [2] [3]
- Thoughts? Humanengr ( talk) 07:10, 20 October 2020 (UTC)
References
- ^ Fauci, Anthony S.; Lane, H. Clifford; Redfield, Robert R. (2020-03-26). "Covid-19 — Navigating the Uncharted". New England Journal of Medicine. 382 (13): 1268–1269. doi: 10.1056/NEJMe2002387. ISSN 0028-4793. PMC 7121221. PMID 32109011.
- ^ Brown, Ronald B. (August 12, 2020). "Public Health Lessons Learned From Biases in Coronavirus Mortality Overestimation". Disaster Medicine and Public Health Preparedness: 1–8. doi: 10.1017/dmp.2020.298. ISSN 1935-7893.
-
^
"Coronavirus disease 2019 (COVID-19) Situation Report – 46" (PDF). World Health Organization. March 6, 2020. Retrieved October 3, 2020.
{{
cite web}}
: CS1 maint: url-status ( link)
- It's an improvement, but I think it makes more sense to leave it out altogether. I don't see the encyclopedic value of this information. This was a prediction of the future that ended up being proven incorrect. If it has some historical significance then there should be later reliable sources that refer back to it. The IFR-vs-CFR bit also seems like a nonsequitur.
R2 (
bleep) 07:43, 20 October 2020 (UTC)
- I changed the percentage deaths by age group column to mortality rate per 100,000 population. This is the number the CDC reports for influenza and nearly all other causes of death, which allows for direct comparison to those values. More importantly, because it includes community prevalence, it's more meaningful that IFR (which addresses the concern above regarding that estimate). I also added the source data, which has the cases and population in the age group. Regarding the comparison to influenza (namely, the 2017-2018 severe flu season), mortality rates of COVID to date are lower for children, and higher for adults. Bakkster Man ( talk) 21:06, 26 October 2020 (UTC)
- It's an improvement, but I think it makes more sense to leave it out altogether. I don't see the encyclopedic value of this information. This was a prediction of the future that ended up being proven incorrect. If it has some historical significance then there should be later reliable sources that refer back to it. The IFR-vs-CFR bit also seems like a nonsequitur.
R2 (
bleep) 07:43, 20 October 2020 (UTC)
Infected county map
I think it might be worth removing the "by county" map, as it is basically just a map of America shaded red. By my count there are only two counties that do not have the virus (plus a few islands), and it doesn't really add any information to the article any more. -- ERAGON ( talk) 21:26, 19 October 2020 (UTC)

-
 Comment: The article on the
United Nations has a world map where members of the UN are colored blue. Virtually everything is colored blue, but the map is still kept in the infobox.
FunnyMath (
talk) 23:53, 19 October 2020 (UTC)
Comment: The article on the
United Nations has a world map where members of the UN are colored blue. Virtually everything is colored blue, but the map is still kept in the infobox.
FunnyMath (
talk) 23:53, 19 October 2020 (UTC)  Suggestion: Perhaps we can repurpose the "by county" map with some more criteria? I'm thinking of counties being displayed by shades of red by number of cases. For example, a light pink can designate a county falls in the range of X1–X2, while another is redder because it is in range Y1–Y2. —
Tenryuu 🐲 (
💬 •
📝 ) 00:35, 20 October 2020 (UTC)
Suggestion: Perhaps we can repurpose the "by county" map with some more criteria? I'm thinking of counties being displayed by shades of red by number of cases. For example, a light pink can designate a county falls in the range of X1–X2, while another is redder because it is in range Y1–Y2. —
Tenryuu 🐲 (
💬 •
📝 ) 00:35, 20 October 2020 (UTC)- Agree with Eragon, the map is currently useless.
United Nations isn't an appropriate comparator. That's part of {{
Infobox geopolitical organization}} and is intended to provide some uniformity across infoboxes. I support removal now regardless of the merits of Tenryuu's suggestion.
R2 (
bleep) 00:39, 20 October 2020 (UTC)
- Having a simple list of counties not infected would be more informative than the red shaded map. We did have a more detailed map that showed per capita cases on a county level, though it is out of date now. I would support removing the red map for now, and replacing with a per capita map if we have one that is not three months out of date.-- ERAGON ( talk) 09:16, 20 October 2020 (UTC)

Semi-protected edit request on 14 November 2020
This
edit request to
COVID-19 pandemic in the United States has been answered. Set the |answered= or |ans= parameter to no to reactivate your request. |
"As of November 2020, there were more than 10,700,000 confirmed cases and 244,000 COVID-19-related deaths in the U.S., representing nearly one-fifth of the world's known COVID-19 cases and deaths, and the most cases and deaths of any country except Colombia.[6]"
Please remove the statement about Colombia. This is not true and can be easily fact-checked. 2601:645:8100:1230:D456:EC3D:81:FF4F ( talk) 03:46, 14 November 2020 (UTC)
 Done.
Aoi (青い) (
talk) 04:01, 14 November 2020 (UTC)
Done.
Aoi (青い) (
talk) 04:01, 14 November 2020 (UTC)
- Thank you to the IP. - SusanLesch ( talk) 17:51, 15 November 2020 (UTC)
Blooper
@ Aoi: thank you for fixing this. ArcGIS made a typo yesterday in their Johns Hopkins data (saying that Colombia had 11,000,000+ cases) which I duly copied. Glad you were able to make a sanity check. Best wishes. - SusanLesch ( talk) 14:29, 14 November 2020 (UTC)
- @ SusanLesch: thank you for this note – I noticed this only when I was responding to the edit request above from IP 2601:645:8100:1230:D456:EC3D:81:FF4F. I've seen your edits in COVID-19 articles in passing on my watchlist so I know you do great work – so I figured you had a good reason for putting that edit in! Thanks to you (and others) for helping to keep the data in these articles up-to-date -- I understand from experience how much hard work it takes. Aoi (青い) ( talk) 02:11, 15 November 2020 (UTC)
Semi-protected edit request on 14 November 2020 (2)
This
edit request to
COVID-19 pandemic in the United States has been answered. Set the |answered= or |ans= parameter to no to reactivate your request. |
Anthony Fauci has "Doctor" before his name three times: one "Dr. Fauci", one "Doctor Fauci", and one "Doctor Anthony Fauci". Please remove this title on the grounds of MOS:DOC, and please add "Anthony" in place of "Dr." because otherwise it's just "Fauci of the NIAID", which doesn't sound right. 2601:5C6:8081:35C0:2C8A:AB39:C6BE:2DEB ( talk) 22:41, 14 November 2020 (UTC)
There's still one "Dr. Anthony Fauci" and one "Doctor Anthony Fauci" to fix. 2601:5C6:8081:35C0:2C8A:AB39:C6BE:2DEB ( talk) 16:55, 15 November 2020 (UTC)
Semi-protected edit request on 24 November 2020
This
edit request to
COVID-19 pandemic in the United States has been answered. Set the |answered= or |ans= parameter to no to reactivate your request. |
Please remove
According to Robert Redfield, the director of the CDC, the CDC was ready to send
and add
According to CDC director Robert Redfield, the CDC was ready to send
This is shorter, and it avoids the awkward phrase "the CDC the CDC" 108.39.223.134 ( talk) 02:42, 24 November 2020 (UTC)
- Done. Good suggestion!
A. Randomdude0000 (
talk) 02:56, 24 November 2020 (UTC)
Semi-protected edit request on 19 October 2020
This
edit request to
COVID-19 pandemic in the United States has been answered. Set the |answered= or |ans= parameter to no to reactivate your request. |
Please remove this sentence:
Conversely, deaths of people who had underlying conditions may lead to overcounting.
The source it's based on, [6], is just a news report from a news website. It's clearly not a good scientific source, especially in terms of Wikipedia:Identifying reliable sources (medicine). 2601:5C6:8081:35C0:A057:7C05:B0B9:456 ( talk) 00:43, 19 October 2020 (UTC) 2601:5C6:8081:35C0:A057:7C05:B0B9:456 ( talk) 00:43, 19 October 2020 (UTC)
- Done I don't think
WP:MEDRS applies here, I don't know. But the source didn't expressly verify the content; it was out of date; and it wasn't even about U.S. statistics. And even if a source could have been found to support that content, there are far more sources talking about undercounting, so
WP:WEIGHT would apply.
R2 (
bleep) 00:27, 20 October 2020 (UTC)
- Agreed. Even if we discuss underlying conditions, that's very different from 'overcounting'. That's not how death certificates work, we don't dismiss deaths just because someone had a contributing condition.
- If we want to quantify underlying conditions, there are sources from the
COVID-19 pandemic article:
[7] 96% of death certificates list at least one additional cause of death, not all are pre-existing conditions],
COVID is the underlying cause of death in 92% of death certificates it is listed on. Both are somewhat clunky numbers that take a while to explain, though.
Bakkster Man (
talk) 21:33, 26 October 2020 (UTC)
- The removed para should be viewed in light of
On 24 March 2020 …
para as that’s how they decided to -actually do- death certificates for COVID—19. For who knows how many of the likely or probable were actually COVID–19? Humanengr ( talk) 22:09, 26 October 2020 (UTC)- The removed sentence doesn't really fit in that context either, since the existence of underlying conditions is orthogonal to confirmed/likely/probably COVID. It's a bit more meaningfully related to the following paragraph about using excess deaths as a proxy for the actual burden of COVID, but even there those excess deaths aren't really 'underlying conditions' which implies they contributed to a COVID death. They're more accurately described as the total disease burden, which includes statistically significant confirmed COVID deaths (above the random variation expected in any given week), unconfirmed COVID deaths (perhaps listed as pneumonia), and deaths as a result of outbreak mitigation (from reduced hospital availability to depression). I think there's room to improve the latter paragraph, but not with the removed wording or source. Bakkster Man ( talk) 22:31, 26 October 2020 (UTC)
- The removed para should be viewed in light of
Where to locate Misinformation
Where should this article discuss misinformation? I added a link to " Misinformation related to the COVID-19 pandemic" under "Partisan divide" but that seems not quite right. - SusanLesch ( talk) 20:17, 20 November 2020 (UTC)
- Done This needs to be a section pointing to the Misinformation article. It has been added at
COVID-19_pandemic_in_the_United_States#Misinformation. -
SusanLesch (
talk) 14:41, 22 November 2020 (UTC)
Counties, Buroughs and Parishes
The United States has 3,143 counties or county-equivalents. It would be a big job, but we need a click-over map so people could find theirs. E.g. I grew up in Santa Cruz County (the smallest in California) and I currently reside in Ada County, Idaho (by far its most populous). They're easy for me to find, but I was born in DuPage County, Illinois and I have no clue, and I have relatives back there! Texas has the most counties: 254. Georgia is... Georgia. Etc. kencf0618 ( talk) 19:41, 22 November 2020 (UTC)
Hello Wikipedia Editors, while browsing I saw that this article didn't have proper navboxes on the bottom. I cannot edit this page, but I'm posting here in the event that someone will fix it. All I see is a blue link "Template Navboxes". Thanks 162.245.178.141 ( talk) 01:28, 24 November 2020 (UTC)
Deaths
Are there more deaths in 2020 in the US than in the last years or does the China-Virus have no impact on the annual death toll? — Preceding unsigned comment added by 2003:E6:1F0A:A401:451F:6CF7:7764:363D ( talk) 07:26, 26 November 2020 (UTC)
- https://www.cdc.gov/mmwr/volumes/69/wr/mm6942e2.htm says "As of October 15, 216,025 deaths from COVID-19 have been reported in the United States; however, this might underestimate the total impact of the pandemic on mortality. Overall, an estimated 299,028 excess deaths occurred from late January through October 3, 2020, with 198,081 (66%) excess deaths attributed to COVID-19." So it has had a huge impact on the annual death toll. In 2018, there were 2,839,205 deaths in the United States, so even if there were zero excess deaths from October 4 through December 31, the death toll would be more than 10% higher in 2020. 108.39.223.134 ( talk) 13:14, 26 November 2020 (UTC)
- Could someone use one or both of these sources to add something about excess deaths to the article? 108.39.223.134 ( talk) 13:17, 26 November 2020 (UTC)
Concerns about splitting off the statistics page
![]() You are invited to join the discussion at
Wikipedia talk:WikiProject COVID-19 § Article splitting. {{u|
Sdkb}}
talk 00:38, 30 November 2020 (UTC)
You are invited to join the discussion at
Wikipedia talk:WikiProject COVID-19 § Article splitting. {{u|
Sdkb}}
talk 00:38, 30 November 2020 (UTC)
Addressing PEIS concerns
An IP editor has pointed out above that {{ navboxes}} is not being transcluded. This is because the post-expand include size limit for this page has been reached, and I have, for the time being, added {{ Citations broken from PEIS limit}} to the top of the page. If more templates are added or more information is added to existing templates, more templates furthest down the article will fail to render. Without doing a PEIS analysis the most likely culprits are the graphs in the "Statistics" section, which means that some (or all) of them will need to be split off into another page. — Tenryuu 🐲 ( 💬 • 📝 ) 05:02, 24 November 2020 (UTC)
- I removed a section and am trying to remove a bit here and there. "Medical supply shortages" under Medical response might be another target for trimming/removal, but these are all just prose. - SusanLesch ( talk) 18:09, 24 November 2020 (UTC)
- Done I'm going to make a new article in this series (Wikipedia has a lot of them). Everything moved here:
Statistics of the COVID-19 pandemic in the United States. -
SusanLesch (
talk) 22:22, 24 November 2020 (UTC)
- Should/could we have a LIST page "Statistics of the COVID-19 pandemic" or maybe better named: "COVID-19 statistics" ? I'd be happy to create it, if others feel it would be appropriate. ---
Avatar317
(talk) 22:24, 24 November 2020 (UTC)
- That would be great. I noticed some are named "Statistics of the COVID-19 pandemic in..." and some are named "Statistics of COVID-19 pandemic in..." (and maybe other variations I don't know). - SusanLesch ( talk) 23:12, 24 November 2020 (UTC)
- Should/could we have a LIST page "Statistics of the COVID-19 pandemic" or maybe better named: "COVID-19 statistics" ? I'd be happy to create it, if others feel it would be appropriate. ---
Avatar317
(talk) 22:24, 24 November 2020 (UTC)
- Good solution .....an approach other countries are also doing. Clearly the best way to make all the sources accessible and no loss of data...good job.-- Moxy 🍁 21:26, 30 November 2020 (UTC)
Request for comment - cases change metrics
Please take part in discussion here: Project COVID-19, Medical cases charts - change type — Preceding unsigned comment added by Kohraa Mondel ( talk • contribs) 22:47, 5 December 2020 (UTC)
RFC for Vaccination section
As vaccines are starting to arrive, I think in the coming days we would see more news concerning the vaccines. I propose creating a new section dedicated for the vaccines, maybe under Response sections. SunDawn ( talk) 09:21, 8 December 2020 (UTC)
- Sounds reasonable. It could overlap with the main article which has some more recent cites. -- Light show ( talk) 21:08, 8 December 2020 (UTC)
Semi-protected edit request on 28 November 2020
This
edit request to
COVID-19 pandemic in the United States has been answered. Set the |answered= or |ans= parameter to no to reactivate your request. |
Please remove
A testing team in Charleston, West Virginia responds to a confirmed case in a nursing home
and add
A testing team responds to a confirmed case in a nursing home in Charleston, West Virginia
It just sounds a little better if we put the prepositional phrases together, and "in Charleston WV" fits both the team and the nursing home. 69.174.157.89 ( talk) 12:32, 28 November 2020 (UTC)
Timeline redundancy
Since there is already a detailed Timeline main article, the details in this 2,700-word timeline section can be trimmed. -- Light show ( talk) 05:09, 9 December 2020 (UTC)
- Done and then some. I don't think some of the details in that section matter in the scope of its overall context. Love of Corey ( talk) 06:33, 9 December 2020 (UTC)
- Agreed. However, can you do a manageable section at a time, since there's no easy way to see what got changed. I'll need to revert your deletion so you can hopefully do that. Thanks. -- Light show ( talk) 06:44, 9 December 2020 (UTC)
- I'm pretty sure section-by-section editing is not allowed... Love of Corey ( talk) 07:14, 9 December 2020 (UTC)
- If you're having trouble reading what got changed, I'm pretty sure someone else can take care of that. I pretty much just summarized everything, merged some sections, and removed details that seem way too specific and/or belonged to other specialty articles, anyway. Love of Corey ( talk) 07:19, 9 December 2020 (UTC)
- The guidelines recommend making edits so others can more easily review them for accuracy. Hence, mass deletions covering numerous sections from a large article are unnecessary time-savers for an editor. Just do a section at a time. If you don't understand that suggestion, simply review my recent edits to a section at a time. There's no reason to do mass multi-section edits at one click.-- Light show ( talk) 07:26, 9 December 2020 (UTC)
- Which guidelines are those?
Love of Corey (
talk) 07:33, 9 December 2020 (UTC)
- The same ones that require edit summaries and civility. -- Light show ( talk) 07:59, 9 December 2020 (UTC)
- Which guidelines are those?
Love of Corey (
talk) 07:33, 9 December 2020 (UTC)
- No, and I doubt anyone will be impressed by your shotgun blitz editing with no summaries, besides your rudeness. -- Light show ( talk) 07:59, 9 December 2020 (UTC)
- >:( Love of Corey ( talk) 09:59, 9 December 2020 (UTC)
- Per consensus from previous discussions (
[18]) and for consistency with nearly every other major country article, I restored the timeline chart to the top of the article (effectively undoing
this edit). --
Tom N
talk/
contrib 02:04, 10 December 2020 (UTC)
- I just wanted to add that Light show did some excellent editing. Thank you. I only disagreed once and made that small change. - SusanLesch ( talk) 20:34, 10 December 2020 (UTC)
Rural section and obesity
The section Rural communities contains the following: "Factors contributing to the spread of COVID-19 in these communities are high rates of obesity" while the article cited as a reference makes no reference to weight or to obesity. While I suspect obesity contributes to the death rate rather than the spread, the sentence does not say that, nor does the cited article. Thisisnotatest ( talk) 07:05, 6 December 2020 (UTC)
- I added a citation to the CDC webpage on the subject. It mentions that "Obesity is linked to impaired immune function" and quite a bit on obesity increasing the severity of the illness. It would seem then that it does contribute to the spread of the pandemic, but it seems indirect. No doubt if I fished around enough I could find a citation that specifically says obesity contributes to the spread of COVID-19, but that does not mean we should include it. Perhaps the paragraph should say "Factors contributing to the spread and severity of COVID-19 in these communities are high rates of obesity . . ." (without bolding). Richard-of-Earth ( talk) 18:37, 13 December 2020 (UTC)
USA Today
@ Love of Corey: USA Today has a conservative owner (Gannett) and has reputably reported the news since the 1980s. I believe their follow up report is important. I heard all kinds of warning stories in the press (for example, before Trump rallies). These people actually took the time to write a complete follow up!
USA Today was originally removed by Light show, I restored it, Love of Corey removed it saying that "I agree that this doesn't really belong here. It should ideally go to Impact of the COVID-19 pandemic on politics#United States." I restored it saying "Undid. Politics impact on Covid in Bemidji. Not about Covid impact on politics." Clearly, this was the OPPOSITE of the reason you gave for removing it. Then you removed it again with a new reason, "Unnecessary."
However, this reporting directly follows up other news with the results, which is pretty rare today. - SusanLesch ( talk) 01:29, 11 December 2020 (UTC)
- I'm simply following
Light show's lead.
Love of Corey (
talk) 01:30, 11 December 2020 (UTC)
- All right. I can't follow your reasoning so another RFC is in our near future. - SusanLesch ( talk) 04:20, 11 December 2020 (UTC)
- Changed my mind; don't have the bandwidth for an RFC. I will try to reword that again. - SusanLesch ( talk) 16:29, 11 December 2020 (UTC)
- Pinging @ Light show: for participation. Love of Corey ( talk) 22:16, 11 December 2020 (UTC)
- IMO, citing a non-expert middle-market newspaper like USA Today, just to post at best, a pure innuendo, is again finding a single event and blowing it up out of all proportion. Unnecessary. -- Light show ( talk) 01:04, 12 December 2020 (UTC)
- This clearly belongs here. USAToday is a gold standard RS and there is no "innuendo" -- the paper found significantly higher COVID rates in places visited by Trump compared to those he did not visit and they say as much. Feoffer ( talk) 01:18, 12 December 2020 (UTC)
- Adding speculation by some newspaper which admitted that ("recognizing that causation was impossible to determine",) to innuendo, didn't really help. In fact it's simply adding OR, and "original research in the form of extrapolation, speculation, and 'future history' are inappropriate". -- Light show ( talk) 01:53, 12 December 2020 (UTC)
- That didn't really help either, since it now includes an erroneous statement about what it "concluded," when in fact they admitted: "there’s no way to determine definitively if cases originated at Trump’s rallies..." --
Light show (
talk) 02:28, 12 December 2020 (UTC)
- The article doesn't allege that the cases originated at Trump's rallies, it reports that USAToday concluded that places Trump visited had significantly higher rates of COVID. That's no innuendo, them's just the facts. If you want to protect our readers from thinking the article implies direct causation, we could certainly look into generate consensus for a caveat language, but obviously the statistical link between COVID rates and almost a million people were gathering during a pandemic is going to merit inclusion.
Feoffer (
talk) 02:49, 12 December 2020 (UTC)
- It's a perfect example of using innuendo and speculation to include
OR, which states, "Do not...imply a conclusion not explicitly stated by any of the sources." Your personal opinion of what the facts are is not usable, ie. your feeling that "obviously the statistical link..." makes them so is not relevant. This isn't a blog.--
Light show (
talk) 03:26, 12 December 2020 (UTC)
- Not hearing alternative verbiage, so sounds like your issue is less with any particular language and more with covering USAToday's reporting in this article at all? Its certainly not original research to summarize the USAToday piece -- it's a relevant RS.
Feoffer (
talk) 04:30, 12 December 2020 (UTC)
- It's simply not accurate to state that "They concluded that Trump 'left a trail of coronavirus cases in his wake.'" It's not what they concluded, but implied or speculated. But the article does include facts which makes that clear: "Health experts say it’s impossible to pinpoint the rallies as the direct source of infection or community spread without an intensive outbreak investigation. The contact tracing done by most health departments following new cases can show only that someone who later developed COVID-19 was at the event – but not that the event caused it." To add that would be proper, but to ignore it violates
OR by posting a
synthesis. Obviously, the entire paragraph is not encyclopedic. --
Light show (
talk) 06:18, 12 December 2020 (UTC)
- Light show, I already tried wording to include what you say is proper and have restored that. USA Today clearly marks its opinion columns as such. This was not an opinion or blog it was straight reporting. Then several other reliable sources reported on USA Today's report:
The Independent,
Newsweek,
Vox, and there are others. Maybe it drew attention because a majority of Americans disapproved of Mr. Trump's decision to hold rallies. -
SusanLesch (
talk) 14:42, 12 December 2020 (UTC)
- WP should not cite some daily because it decided to create a news story from their own investigation. Any medical subject like this should only come from reliable medical sources, not a few newspaper reporters told to dig up and create a story to help their paper sell ads and undermine Trump.
- It's ironic that in another discussion on an important topic, the trade war, editors
successfully fought to exclude and censor high quality
reliable sources and replace them with so-called "peer reviewed" Chinese sources. In this article, however, the very opposite seems to be the case, which will accept any story so long as it supports "disapproval" of Mr. Trump. --
Light show (
talk) 19:04, 12 December 2020 (UTC)
- Impugning a source like you do is not fair to the profession.-
SusanLesch (
talk) 19:15, 12 December 2020 (UTC)
- If you mean that, considering there are a million doctors and sixteen million medical professionals in the U.S., it is unfair to them to allow some newsroom reporters' story to get the same recognition as a RS by WP, I agree. --
Light show (
talk) 19:53, 12 December 2020 (UTC)
- Better to use secondary sources
than these. Add them if you like. -
SusanLesch (
talk) 20:01, 12 December 2020 (UTC)
- So what's the status of this conversation?
Love of Corey (
talk) 02:14, 14 December 2020 (UTC)
- Hi, Love of Corey. Feoffer focused the paragraph, making edits that I agreed with but to which Light show objected. Light show gave an indication of what he considered missing information so I edited the paragraph down to elevate that phrasing. So I think we're good thanks. -
SusanLesch (
talk) 14:28, 14 December 2020 (UTC)
- You're welcome. Love of Corey ( talk) 22:40, 14 December 2020 (UTC)
- Hi, Love of Corey. Feoffer focused the paragraph, making edits that I agreed with but to which Light show objected. Light show gave an indication of what he considered missing information so I edited the paragraph down to elevate that phrasing. So I think we're good thanks. -
SusanLesch (
talk) 14:28, 14 December 2020 (UTC)
- So what's the status of this conversation?
Love of Corey (
talk) 02:14, 14 December 2020 (UTC)
- Better to use secondary sources
than these. Add them if you like. -
SusanLesch (
talk) 20:01, 12 December 2020 (UTC)
- If you mean that, considering there are a million doctors and sixteen million medical professionals in the U.S., it is unfair to them to allow some newsroom reporters' story to get the same recognition as a RS by WP, I agree. --
Light show (
talk) 19:53, 12 December 2020 (UTC)
- Impugning a source like you do is not fair to the profession.-
SusanLesch (
talk) 19:15, 12 December 2020 (UTC)
- Light show, I already tried wording to include what you say is proper and have restored that. USA Today clearly marks its opinion columns as such. This was not an opinion or blog it was straight reporting. Then several other reliable sources reported on USA Today's report:
The Independent,
Newsweek,
Vox, and there are others. Maybe it drew attention because a majority of Americans disapproved of Mr. Trump's decision to hold rallies. -
SusanLesch (
talk) 14:42, 12 December 2020 (UTC)
- It's simply not accurate to state that "They concluded that Trump 'left a trail of coronavirus cases in his wake.'" It's not what they concluded, but implied or speculated. But the article does include facts which makes that clear: "Health experts say it’s impossible to pinpoint the rallies as the direct source of infection or community spread without an intensive outbreak investigation. The contact tracing done by most health departments following new cases can show only that someone who later developed COVID-19 was at the event – but not that the event caused it." To add that would be proper, but to ignore it violates
OR by posting a
synthesis. Obviously, the entire paragraph is not encyclopedic. --
Light show (
talk) 06:18, 12 December 2020 (UTC)
- Not hearing alternative verbiage, so sounds like your issue is less with any particular language and more with covering USAToday's reporting in this article at all? Its certainly not original research to summarize the USAToday piece -- it's a relevant RS.
Feoffer (
talk) 04:30, 12 December 2020 (UTC)
- It's a perfect example of using innuendo and speculation to include
OR, which states, "Do not...imply a conclusion not explicitly stated by any of the sources." Your personal opinion of what the facts are is not usable, ie. your feeling that "obviously the statistical link..." makes them so is not relevant. This isn't a blog.--
Light show (
talk) 03:26, 12 December 2020 (UTC)
- The article doesn't allege that the cases originated at Trump's rallies, it reports that USAToday concluded that places Trump visited had significantly higher rates of COVID. That's no innuendo, them's just the facts. If you want to protect our readers from thinking the article implies direct causation, we could certainly look into generate consensus for a caveat language, but obviously the statistical link between COVID rates and almost a million people were gathering during a pandemic is going to merit inclusion.
Feoffer (
talk) 02:49, 12 December 2020 (UTC)
- That didn't really help either, since it now includes an erroneous statement about what it "concluded," when in fact they admitted: "there’s no way to determine definitively if cases originated at Trump’s rallies..." --
Light show (
talk) 02:28, 12 December 2020 (UTC)
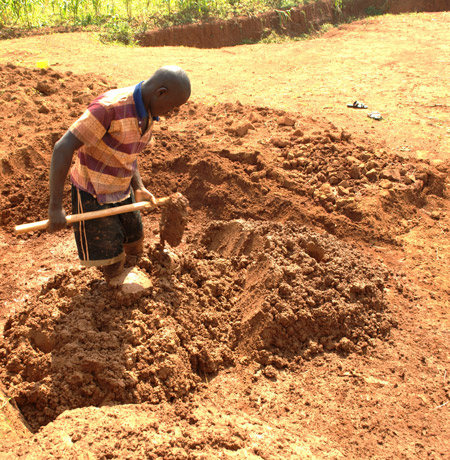
new cases map
The map of the rate of new cases has saturated (i.e. nearly every county is plotted in black, representing a rolling average of over 500 cases per 100k population), which makes it uninformative as to where the pandemic is running hotter. Should it be rescaled? Lavateraguy ( talk) 12:24, 15 December 2020 (UTC)
Yeah, I agree that it should be rescaled. Anyone else? Snowmaninblack ( talk) 18:21, 16 December 2020 (UTC)
- I agree, it's not very useful if it's mostly black with just a few purple areas.— Naddruf ( talk ~ contribs) 09:00, 19 December 2020 (UTC)
Failed verification
This good faith edit has thrown the first paragraph of the lead backwards into an unverifiable statement. The stats I add every day are no longer correct because the "as of" date must also change (something I don't do). I don't know how to ascertain the stats for deaths per million, but can see that without a date that information is incorrect. We need somebody to restore working dates. - SusanLesch ( talk) 17:39, 17 December 2020 (UTC)
- For example, today our article says, "The U.S. death rate had reached 940 per million people, the thirteenth-highest rate among nations." But Johns Hopkins says we are about 12th (and about 4th by another measure). By the way, I removed the day from the date in "As of December 2020, there have been more than..." so that part is fine now. -
SusanLesch (
talk) 15:15, 18 December 2020 (UTC)
- I would fix if someone could please tell me exactly what number to copy? -
SusanLesch (
talk) 19:45, 18 December 2020 (UTC)
- The JH data we should use is "Deaths per 100,000 population", multiplying that number by 10 to get the same number as the second source (Statista). The two (in this case, conflicting) data sources is definitely a potential issue. The JHU data is two days newer, but their bar chart on the top of the page is only for larger countries (excluding Peru's 32.5M poplation, while they rank 2nd on Statista's page). I'd suggest using the newest data for the mortality rate (in this case, JHU at 949.7 today) and the Statista ranking for the approximate worldwide rank for mortality (10th as of today).
Bakkster Man (
talk) 20:51, 18 December 2020 (UTC)
- All right, thank you,
User:Bakkster Man. Statista says USA has 921.31 deaths per million, in 11th place. JH says 949.7 per million in 12th place. How shall I round those numbers? (I could easily say 949.7 ≈ 950.) Why would you want to use part of one with the other part of the other source? In any case, the article is wrong as it stands. -
SusanLesch (
talk) 23:18, 18 December 2020 (UTC)
- The JHU data is more timely, and a better source for the mortality rate itself (and regarding rounding, I don't think we need to go any more than whole numbers so 950 as of today). The Statista data includes the rankings of all countries, not just those above a certain size. And, just to make it a bit more confusing, the wikilinked text for the rate is even more out of date. I updated the values, and moved the citations after the value the citation was used as a source for. If the decision is made to use the
COVID-19 pandemic death rates by country article ranking instead, the Statista citation should be removed (since that article does not use Statista).
Bakkster Man (
talk) 00:12, 19 December 2020 (UTC)
- Fixed now. Restored "as of" date, removed Statista. - SusanLesch ( talk) 14:43, 19 December 2020 (UTC)
- The JHU data is more timely, and a better source for the mortality rate itself (and regarding rounding, I don't think we need to go any more than whole numbers so 950 as of today). The Statista data includes the rankings of all countries, not just those above a certain size. And, just to make it a bit more confusing, the wikilinked text for the rate is even more out of date. I updated the values, and moved the citations after the value the citation was used as a source for. If the decision is made to use the
COVID-19 pandemic death rates by country article ranking instead, the Statista citation should be removed (since that article does not use Statista).
Bakkster Man (
talk) 00:12, 19 December 2020 (UTC)
- All right, thank you,
User:Bakkster Man. Statista says USA has 921.31 deaths per million, in 11th place. JH says 949.7 per million in 12th place. How shall I round those numbers? (I could easily say 949.7 ≈ 950.) Why would you want to use part of one with the other part of the other source? In any case, the article is wrong as it stands. -
SusanLesch (
talk) 23:18, 18 December 2020 (UTC)
- The JH data we should use is "Deaths per 100,000 population", multiplying that number by 10 to get the same number as the second source (Statista). The two (in this case, conflicting) data sources is definitely a potential issue. The JHU data is two days newer, but their bar chart on the top of the page is only for larger countries (excluding Peru's 32.5M poplation, while they rank 2nd on Statista's page). I'd suggest using the newest data for the mortality rate (in this case, JHU at 949.7 today) and the Statista ranking for the approximate worldwide rank for mortality (10th as of today).
Bakkster Man (
talk) 20:51, 18 December 2020 (UTC)
- I would fix if someone could please tell me exactly what number to copy? -
SusanLesch (
talk) 19:45, 18 December 2020 (UTC)
Medical supply shortages
This section seems overlong: Medical supply shortages. Is there anything se can do to tighten up that section? - SusanLesch ( talk) 17:31, 22 December 2020 (UTC)
Vaccine Distribution and Administration Tracking
Using data from the CDC ( https://covid.cdc.gov/covid-data-tracker/#vaccinations https://public.tableau.com/profile/benjamin.renton#!/vizhome/COVID-19VaccineAllocationDashboard/DosesAdministeredDashboard) can we start tracking the number of vaccines distributed and administered in the USA on a chart on this page? Edwyth ( talk) 21:18, 8 January 2021 (UTC)
- There is also this (see the map). Yes, I think we should include this info. But we must provide two numbers, the amount distributed to the states and the amount actually administrated to patients. There is a big disparity here: only ~25-30% of vaccine delivered to the states have been administrated. Why? Actually, local hospitals in the area I live have used already all vaccine delivered to them, and there are no more deliveries. Where the remaining 75% of vaccine to the state is sitting? With providers/local pharmacies who can not make a shot? I have no idea after looking at sources. But this has significant policy implications. For example, the Biden administration plans to quickly distribute 2nd doses which are currently set aside. But this may be meaningless or even harmful if 75% vaccine is sitting idle and rot at the state level. My very best wishes ( talk) 14:55, 9 January 2021 (UTC)
Table functionality
This issue probably affects all the COVID-by-country articles, but I don't know where to ask (template talk pages aren't generally very popular), so I might as well come to one of the highest traffic by-country articles.
If I request just the January dates from the "COVID-19 cases in the United States" template in COVID-19 pandemic in the United States#Timeline, it gives me January 2020 and January 2021. Is there a way to modify the table (either by editing {{ COVID-19 pandemic data}} or by tweaking something here) so that I can pick by year, as well as by month? Nyttend ( talk) 21:31, 13 January 2021 (UTC)
- Looks like this is fixed on the Italian Wikipedia. Logic was added added to make the filter buttons both year- and month-aware. They also adjusted the filter button layout and included year labels. Someone likely needs to port that change over to this and the other wikipedia language sites. I'd take a stab at it, but I am not skilled with the particular programming language used. -- Tom N talk/ contrib 03:43, 15 January 2021 (UTC)
Add vaccination statistics to timeline graph?
Now that we are getting reliable and regularly updated statistics on US vaccination, could this information be added to the Timeline graph alongside the cases and deaths information? — Preceding unsigned comment added by 107.77.193.47 ( talk) 17:06, 15 January 2021 (UTC)
- Yes, certainly. And we need both numbers, i.e. the amount distributed to the states and the amount actually administrated to the patients. This is a disaster. Only around 1/3 of the distributed vaccine was actually used. The remainder is apparently either discarded or kept without use. At the same time, many hospitals stopped new vaccinations, because they spent everything and received too little new shipments. My very best wishes ( talk) 19:10, 15 January 2021 (UTC)
- But it appears that the official numbers of vaccine released by the federal government could be fake [19] (!!!). That's why could be such significant gap, at least in part. My very best wishes ( talk) 03:55, 20 January 2021 (UTC)
Can we add the year to the image captions?
The image captions state:
> COVID-19 cases per 100,000 people by state, as of January 18
and
> Map of the outbreak in the United States by confirmed new infections per 100,000 people (14 days preceding January 20)
Based on real-world context I'm assuming these refer to the current year, 2021, but from reading the article it is a bit confusing since it also references dates in January 2020.
Would it reduce ambiguity to add the year in to these image captions? 75.37.68.59 ( talk) 11:30, 21 January 2021 (UTC)
New draft article
I started Draft:501.V2 variant outbreak for the outbreak of the new variant. Elijahandskip ( talk) 05:22, 31 January 2021 (UTC)