| Developer(s) | University of Ljubljana |
|---|---|
| Initial release | 10 October 1996 [1] |
| Stable release | 3.36.2
[2]
/ 31 October 2023 |
| Repository | Orange Repository |
| Written in | Python, Cython, C++, C |
| Operating system | Cross-platform |
| Type | Machine learning, Data mining, Data visualization, Data analysis |
| License | GPLv3 or later [3] [4] |
| Website |
orangedatamining |

Orange is an open-source data visualization, machine learning and data mining toolkit. It features a visual programming front-end for explorative qualitative data analysis and interactive data visualization.

Description
Orange is a component-based visual programming software package for data visualization, machine learning, data mining, and data analysis.
Orange components are called widgets. They range from simple data visualization, subset selection, and preprocessing to empirical evaluation of learning algorithms and predictive modeling.
Visual programming is implemented through an interface in which workflows are created by linking predefined or user-designed widgets, while advanced users can use Orange as a Python library for data manipulation and widget alteration. [5]
Software
Orange is an open-source software package released under GPL and hosted on GitHub. Versions up to 3.0 include core components in C++ with wrappers in Python. From version 3.0 onwards, Orange uses common Python open-source libraries for scientific computing, such as numpy, scipy and scikit-learn, while its graphical user interface operates within the cross-platform Qt framework.
The default installation includes a number of machine learning, preprocessing and data visualization algorithms in 6 widget sets (data, transform, visualize, model, evaluate and unsupervised). Additional functionalities are available as add-ons (text-mining, image analytics, bioinformatics, etc.).
Orange is supported on macOS, Windows and Linux and can also be installed from the Python Package Index repository (pip install Orange3).
Features
Orange consists of a canvas interface onto which the user places widgets and creates a data analysis workflow. Widgets offer basic functionalities such as reading the data, showing a data table, selecting features, training predictors, comparing learning algorithms, visualizing data elements, etc. The user can interactively explore visualizations or feed the selected subset into other widgets.

- Canvas: graphical front-end for data analysis
- Widgets:
- Data: widgets for data input, data filtering, sampling, imputation, feature manipulation and feature selection
- Visualize: widgets for common visualization (box plot, histograms, scatter plot) and multivariate visualization (mosaic display, sieve diagram).
- Classify: a set of supervised machine learning algorithms for classification
- Regression: a set of supervised machine learning algorithms for regression
- Evaluate: cross-validation, sampling-based procedures, reliability estimation and scoring of prediction methods
- Unsupervised: unsupervised learning algorithms for clustering (k-means, hierarchical clustering) and data projection techniques (multidimensional scaling, principal component analysis, correspondence analysis).
Add-ons
Orange users can extend their core set of components with components in the add-ons. Supported add-ons include:
- Associate: components for mining frequent itemsets and association rule learning.
- Bioinformatics: components for gene expression analysis, enrichment, and access to expression databases (e.g., Gene Expression Omnibus) and pathway libraries.
- Data fusion: components for fusing different data sets, collective matrix factorization, and exploration of latent factors.
- Educational: components for teaching machine learning concepts, such as k-means clustering, polynomial regression, stochastic gradient descent, ...
- Explain: provides an extension with components for the model explanation, including Shapley value analysis
- Geo: components for working with geospatial data.
- Image analytics: components for working with images and ImageNet embeddings
- Network: components for graph and network analysis.
- Text mining: components for natural language processing and text mining.
- Time series: widget components for time series analysis and modeling.
- Single-cell: support for single-cell gene expression analysis, including components for loading single-cell data, filtering and
batch effect removal, marker genes discovery, scoring of cells and genes, and cell type prediction.
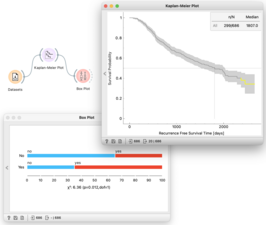
Kaplan-Meier Plot from Survival Analysis data plots survival curves and supports interactive selection of cases. - Spectroscopy: components for analyzing and visualization of (hyper)spectral datasets. [6]
- Survival analysis: add-on for data analysis dealing with survival data. It includes widgets for standard survival analysis techniques, such as the Kaplan-Meier plot, the Cox regression model, and several derivative widgets.
- World Happiness: support for downloading socioeconomic data from a database, including OECD and World Development Indicators. Provides access to thousands of country indicators from various economic databases.

Objectives
The program provides a platform for experiment selection, recommendation systems, and predictive modelling and is used in biomedicine, bioinformatics, genomic research, and teaching. In science, it is used as a platform for testing new machine learning algorithms and for implementing new techniques in genetics and bioinformatics. In education, it was used for teaching machine learning and data mining methods to students of biology, biomedicine, and informatics.
Extensions
Various projects build on Orange either by extending the core components with add-ons or using only the Orange Canvas to exploit the implemented visual programming features and GUI.
- OASYS — ORange SYnchrotron Suite [7]
- scOrange — single cell biostatistics
- Quasar — data analysis in natural sciences
History
In 1996, the University of Ljubljana and Jožef Stefan Institute started development of ML*, a machine learning framework in C++, and Python bindings were developed for this framework in 1997, which, together with emerging Python modules, formed a joint framework called Orange. Over the following years, most contemporary major algorithms for data mining and machine learning were implemented in C++ (Orange's core) or Python modules.
- In 2002, first prototypes to create a flexible graphical user interface were designed using Pmw Python megawidgets.
- In 2003, the graphical user interface was redesigned and re-developed for Qt framework using PyQt Python bindings. The visual programming framework was defined, and the development of widgets (graphical components of the data analysis pipeline) began.
- In 2005, extensions for data analysis in bioinformatics was created.
- In 2008, Mac OS X DMG and Fink-based installation packages were developed.
- In 2009, over 100 widgets were created and maintained.
- Since 2009, Orange is in 2.0 beta, and web site offers installation packages based on the daily compiling cycle.
- In 2012, a new object hierarchy was imposed, replacing the old module-based structure.
- In 2013, a significant redesign of the graphical user interface included a new toolbox and depiction of workflows.
- In 2015, Orange 3.0 was released. Orange stores the data in the NumPy arrays; machine learning algorithms mostly use scikit-learn.
- In 2015, a text analysis add-on for Orange3 was released.
- In 2016, Orange is in version 3.3. The development uses a monthly stable release cycle.
- In 2016, Start of development and release of Image Analytics add-on, with server-site deep neural networks for image embedding [8]
- In 2017, Spectroscopy add-on for the analysis of spectral data was introduced. [9]
- In 2017, Geo, an add-on for dealing with geo-location data and visualisation of geo maps was introduced [10]
- In 2018, the development and release of add-on for single-cell data analysis was started. [11]
- In 2019, Orange's graphical interface is developed as a separate project, orange-canvas-core [12]
- In 2020, Explain add-on with widgets for explaining classification or regression model is introduced. It explains which features contribute the most and how they contribute towards predicting a specific class.
- In 2022 World Happiness, an add-on for the Orange3 data mining suite, is introduced. It provides widgets for accessing socioeconomic data from various databases such as World Happiness Report, World Development Indicators, OECD.
- In 2022, Explain add-on is extended with an Individual Conditional Expectation plot and the Permutation Feature Importance technique.
References
- ^ "orange3/CHANGELOG.md at master . biolab/orange3 . GitHub". GitHub.
- ^ "Release 3.36.2". 31 October 2023. Retrieved 19 November 2023.
- ^ "Orange - License".
- ^ "orange3/LICENSE at master . biolab/orange3 . GitHub". GitHub.
- ^ Janez Demšar; Tomaž Curk; Aleš Erjavec; Črt Gorup; Tomaž Hočevar; Mitar Milutinovič; Martin Možina; Matija Polajnar; Marko Toplak; Anže Starič; Miha Stajdohar; Lan Umek; Lan Žagar; Jure Žbontar; Marinka Žitnik; Blaž Zupan (2013). "Orange: data mining toolbox in Python" (PDF). Journal of Machine Learning Research. 14 (1): 2349–2353.
- ^ Toplak, M.; Birarda, G.; Read, S.; Sandt, C.; Rosendahl, S. M.; Vaccari, L.; Demšar, J.; Borondics, F. (2017). "Infrared Orange: Connecting Hyperspectral Data with Machine Learning". Synchrotron Radiation News. 30 (4): 40–45. Bibcode: 2017SRNew..30...40T. doi: 10.1080/08940886.2017.1338424. S2CID 125273654.
- ^ Sanchez Del Rio, Manuel; Rebuffi, Luca (2017). "OASYS (Or Ange SYnchrotron Suite): An open-source graphical environment for x-ray virtual experiments". In Chubar, Oleg; Sawhney, Kawal (eds.). Advances in Computational Methods for X-Ray Optics IV. p. 28. doi: 10.1117/12.2274263. ISBN 9781510612334. S2CID 117118973.
- ^ Primož Godec; Matjaž Pančur; Nejc Ilenič; Andrej Čopar; Martin Stražar; Aleš Erjavec; Ajda Pretnar; Janez Demšar; Marko Toplak; Anže Starič; Lan Žagar; Jan Hartman; Hamilton Wang; Riccardo Bellazzi; Uroš Petrovič; Silvia Garagna; Maurizio Zuccotti; Dongsu Park; Gad Shaulsky; Blaž Zupan (2019). "Democratized image analytics by visual programming through integration of deep models and small-scale machine learning". Nature Communications. 10 (1): 4551. Bibcode: 2019NatCo..10.4551G. doi: 10.1038/s41467-019-12397-x. PMC 6779910. PMID 31591416. S2CID 203782491.
- ^ Marko Toplak; Stuart T. Read; Christophe Sandt; Ferenc Borondics (2021). "Quasar: Easy Machine Learning for Biospectroscopy". Cells. 10 (9): 2300. doi: 10.3390/cells10092300. PMC 8466383. PMID 34571947.
- ^ "Orange3-Geo Documentation — Orange3-Geo documentation".
- ^ Martin Stražar; Lan Žagar; Jaka Kokošar; Vesna Tanko; Aleš Erjavec; Pavlin G. Poličar; Anže Starič; Janez Demšar; Gad Shaulsky; Vilas Menon; Andrew Lemire; Anup Parikh; Blaž Zupan (2021). "scOrange—a tool for hands-on training of concepts from single-cell data analytics". Bioinformatics. 35 (14): i4–i12. doi: 10.1093/bioinformatics/btz348. PMC 6612816. PMID 31510695.
- ^ "Orange Canvas Core". GitHub.
Further reading
- Demšar, Janez and Blaž Zupan, Data Mining Fruitful and Fun - A Historical Perspective, Informatica 37, pgs. 55–60, (2013).
External links
- Applications of artificial intelligence
- Cross-platform free software
- Data mining and machine learning software
- Data visualization software
- Free plotting software
- Free science software
- Free software programmed in Python
- Numerical software
- Science software that uses Qt
- Software using the GPL license
- Time series software