Size of this preview:
800 × 536 pixels. Other resolutions:
320 × 215 pixels |
640 × 429 pixels |
1,024 × 686 pixels |
1,280 × 858 pixels |
2,008 × 1,346 pixels.
Original file (2,008 × 1,346 pixels, file size: 68 KB, MIME type: image/png)
| This is a file from the
Wikimedia Commons. Information from its
description page there is shown below. Commons is a freely licensed media file repository. You can help. |
.png)
Summary
| Description |
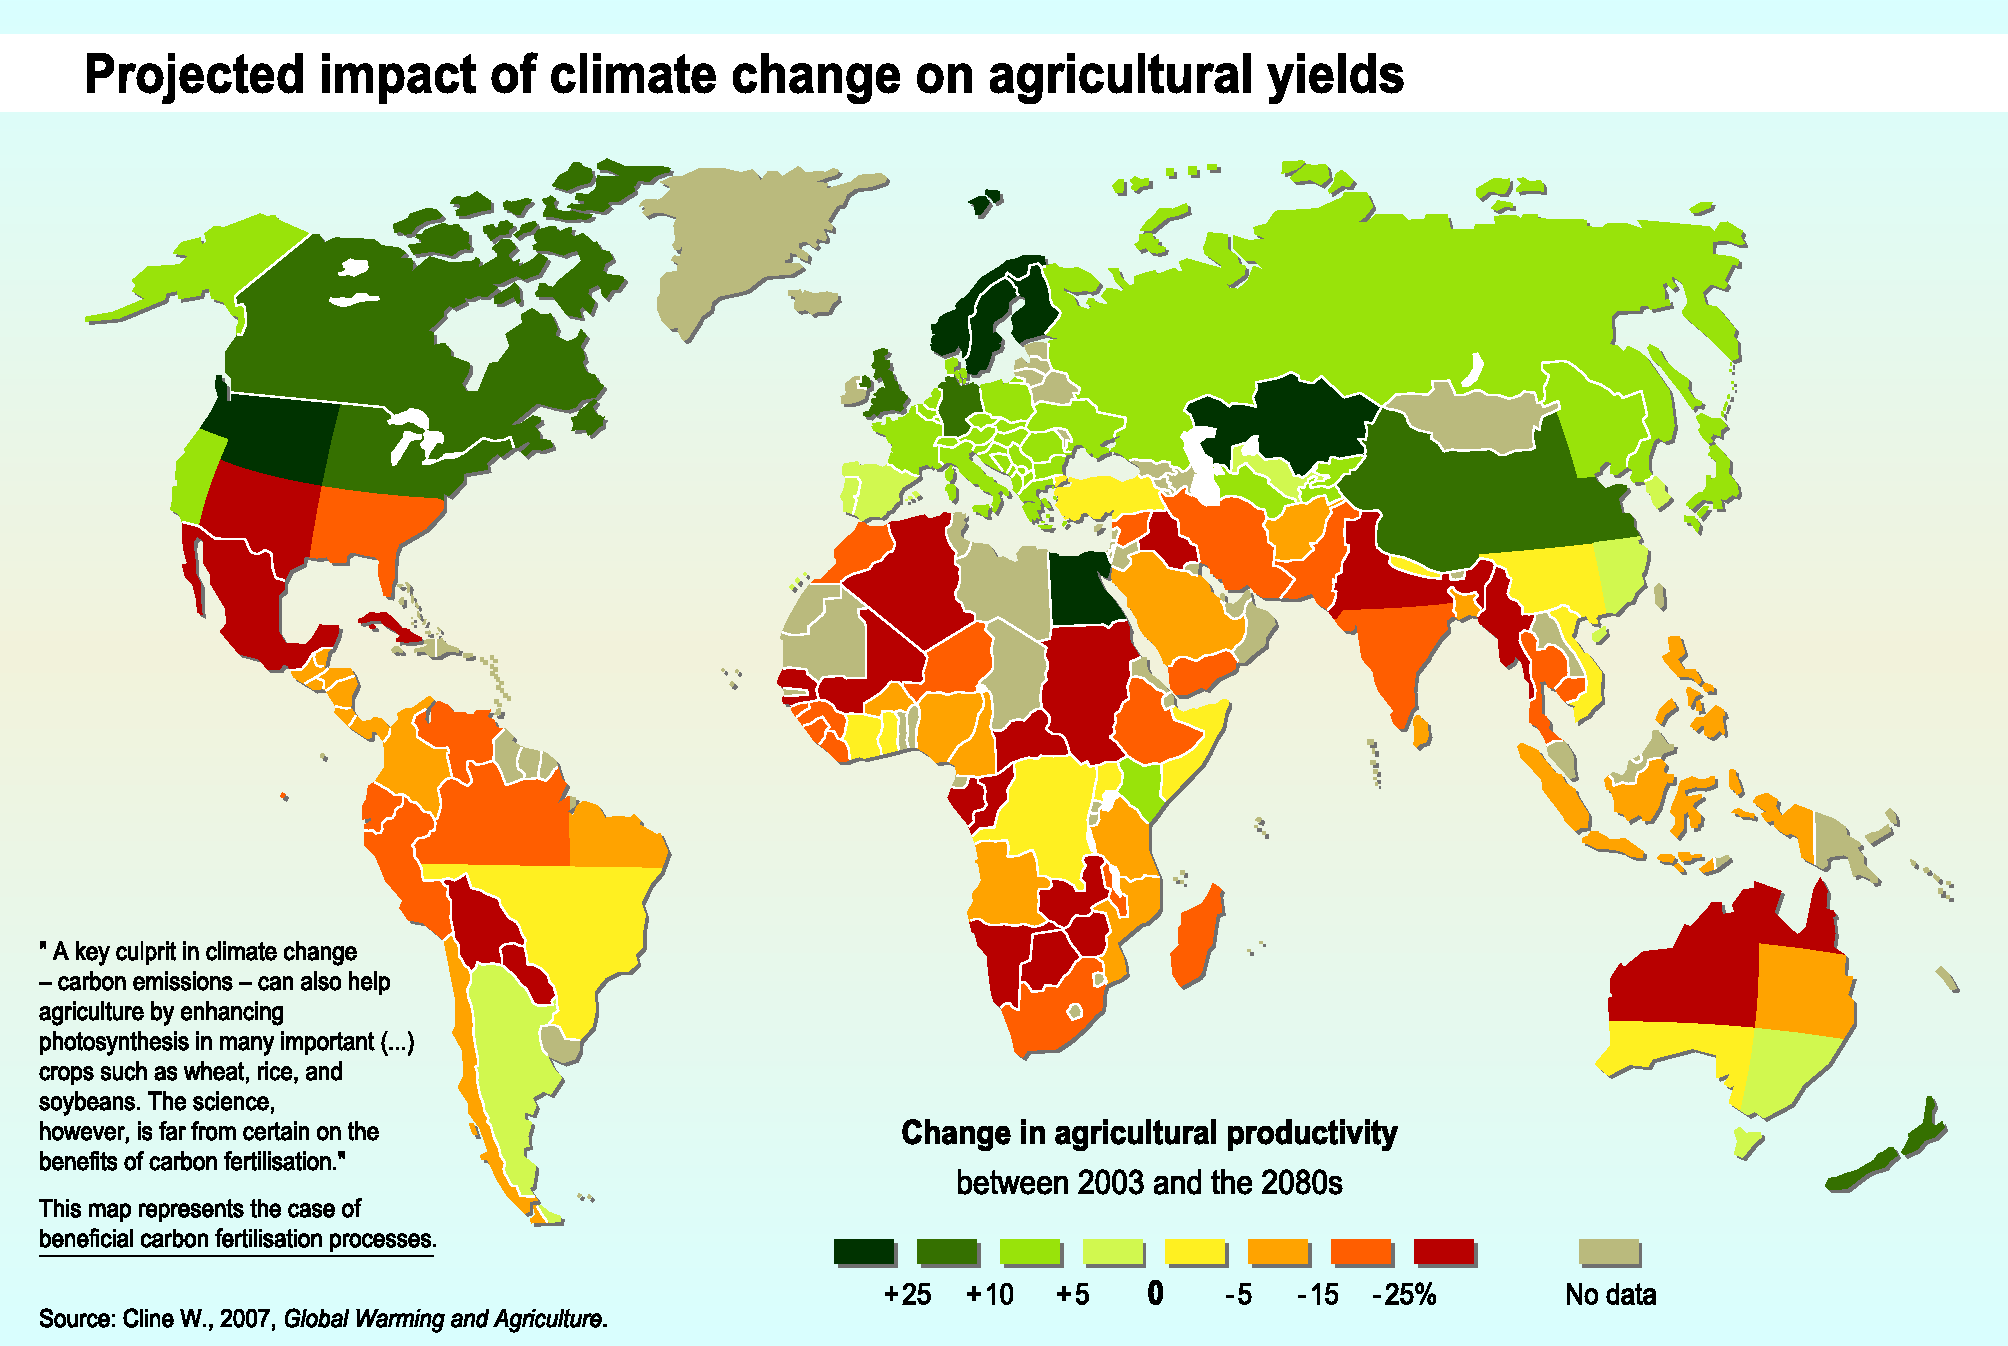
English: This map shows the projected impact of climate change in the 2080s on agricultural productivity across the world. Impacts are measured as a percentage change in agricultural productivity compared to 2003 levels. It is based on work by Cline (2007) (referred to by the European Environment Agency (EEA), 2011, pp.74-75). Cline (2008) also provides details of the study and can be freely downloaded. According to the EEA (2011, p.74): "Although global production may increase initially (before 2030), global warming is projected to have negative effects in the long run. While production at high latitudes will generally benefit from climate change, in many African countries and Latin America it is projected to be severely compromised [...]." The map represents a "business-as-usual" scenario, i.e., the world adopts no new measures to reduce greenhouse gas emissions (EEA, 2011, p.75). It takes into account the assumed benefits of increases in carbon fertilization (EEA, 2011, p.75). Calculations are based on the average output of six general circulation models (GCMs) of the Earth's climate system (EEA, 2011, p.75). Raw data on which the map is based can be downloaded as an Excel spreadsheet from the source website (EEA, 2010). References: Cline, W.R., (2007): Global Warming and Agriculture: Impact Estimates by Country. Center for Global Development, Washington DC ,USA; Cline, W.R., (March 2008):
Global Warming and Agriculture. Finance and Development, vol 45, no. 1. International Monetary Fund, Washington DC, USA; EEA, (2011):
The European environment — state and outlook 2010: assessment of global megatrends. European Environment Agency, Copenhagen, Denmark. |
| Date | |
| Source | EEA (14 December 2010): Projected impact of climate change on agricultural yields. European Environment Agency, Copenhagen, Denmark. Last modified September 5, 2011. |
| Author | European Environment Agency, Copenhagen, Denmark |
| Permission ( Reusing this file) |
From original source: "EEA standard re-use policy: unless otherwise indicated, re-use of content on the EEA website for commercial or non-commercial purposes is permitted free of charge, provided that the source is acknowledged ( http://www.eea.europa.eu/legal/copyright). Copyright holder: European Environment Agency." |
Licensing
This image is in the
public domain because it is extracted from the
European Environment Agency Website, whose material is in the public domain unless otherwise stated (see the
copyright notice). Online access:
www.eea.eu.int
This is valid despite the copyright notice at the bottom of each page, see this
confirmation e-mail. | |

|
This map image could be re-created using
vector graphics as an
SVG file. This has several advantages; see
Commons:Media for cleanup for more information. If an SVG form of this image is available, please upload it and afterwards replace this template with
{{
vector version available|new image name}}
.
It is recommended to name the SVG file “Projected impact of climate change on agricultural yields by the 2080s, compared to 2003 levels (Cline, 2007).svg”—then the template Vector version available (or Vva) does not need the new image name parameter. |
File history
Click on a date/time to view the file as it appeared at that time.
| Date/Time | Thumbnail | Dimensions | User | Comment | |
|---|---|---|---|---|---|
| current | 22:00, 25 September 2016 |
| 2,008 × 1,346 (68 KB) | SteinsplitterBot | Bot: Image rotated by 180° |
| 00:00, 9 September 2016 |
 | 2,008 × 1,346 (69 KB) | SteinsplitterBot | Bot: Image rotated by 180° | |
| 21:26, 16 July 2012 |
 | 2,008 × 1,346 (106 KB) | Enescot | {{Information |Description ={{en|1=This map shows the projected impact of climate change in the 2080s on agricultural productivity across the world. Impacts are measured as a percentage change in agricultural productivity compared to 2003 levels. It... |
File usage
The following pages on the English Wikipedia use this file (pages on other projects are not listed):
Global file usage
The following other wikis use this file:
- Usage on bn.wikipedia.org
- Usage on ca.wikipedia.org
- Usage on cs.wikipedia.org
- Usage on cy.wikipedia.org
- Usage on el.wikipedia.org
- Usage on es.wikipedia.org
- Usage on eu.wikipedia.org
- Usage on fr.wikipedia.org
- Usage on hy.wikipedia.org
- Usage on it.wikipedia.org
- Usage on rw.wikipedia.org
- Usage on www.wikidata.org
- Usage on yo.wikipedia.org
- Usage on zh.wikipedia.org
.png)