
At the end of 2015, the installed capacity of wind power in Washington was 3,075 megawatts (MW) with wind power accounting for 7,101 GWh. [1] In 2016, it reached a generation of 8,041 GWh, comprising 7.1% of the electricity generated in the state. [2] In 2023, it had a capacity of 3,407 MW (with another 600MW under construction), responsible for 7.75% of generation. [3]
State legislative support

Initiative 937 requires electric utilities with 25,000 or more customers to have 15 percent of their power supply generated from new renewable resources – excluding existing hydropower – by 2020. Washington has sales tax exemptions for wind energy. Washington provides utility grants, loans and rebates for wind power. [4]
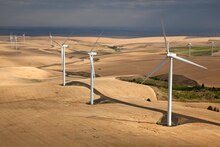
Notable projects
| Name | Location | Capacity ( MW) | Ref |
|---|---|---|---|
| Windy Point Wind Farm | Klickitat County | 400 | [5] |
| Wild Horse Wind Farm | Kittitas County | 273 | [5] |
| Marengo Wind Farm | Columbia County | 211 | [5] |
| White Creek Wind Farm | Klickitat County | 205 | [5] |
| Big Horn Wind Farm | Klickitat County | 200 | [5] |
| Stateline Wind Farm | Walla Walla County | 177 | [5] |
| Hopkins Ridge Wind Farm | Columbia County | 157 | [6] |
| Lower Snake River Wind Project | Garfield County | 344.7 | [5] |
| Tucannon River Wind Farm | Columbia County | 267 | [7] |
| Palouse Wind Farm | Whitman County | 100 | [8] |
| Nine Canyon Wind Project | Benton County | 95.9 | [9] |
Potential capacity
The National Renewable Energy Laboratory estimates that Washington has potential to install over 18,000 megawatts of onshore wind power. [10] Washington ranks 24th in its potential for onshore wind generation, [11] and also has the potential to install 120,964 MW of offshore wind generation which could generate 488,025 GWh/year. [12]
Installed
Installed wind power capacity in Washington has seen strong growth in recent years and Washington now ranks among the top ten states with the most wind power installed. Wind power accounted for 5.3% of total electricity generated in Washington during 2011. [13]
The table below shows the growth in wind power installed nameplate capacity in MW for Washington from 1999 to 2011. [14]
 |
Statistics
| Wind power in Washington | |||||
|---|---|---|---|---|---|
| Year | Capacity (MW) [15] [16] [17] |
Generation (GWh) |
Capacity Factor
[18] (%) |
Generation (% of total) | |
| 2000 | 0 | ||||
| 2001 | 180.2 | ||||
| 2002 | 228.3 | 418 | 21.9 | ||
| 2003 | 243.9 | 602 | 28.2 | ||
| 2004 | 240.6 | 737 | 35 | ||
| 2005 | 390 | 498 | 15.6 | ||
| 2006 | 818.1 | 1,038 | 14.5 | ||
| 2007 | 1,163.2 | 2,439 | 23.9 | ||
| 2008 | 1,375 | 3,658 | 30.4 | ||
| 2009 | 1,848.9 | 3,571 | 22 | ||
| 2010 [19] | 2,104.4 | 4,475 | 24.3 | 4.6% | |
| 2011 [20] | 2,573 | 6,261 | 27.8 | 5.3% | |
| 2012 [21] | 2,808 | 6,600 | 26.8 | 5.8% | |
| 2013 [22] | 2,808 | 7,003 | 24.5 | 6.2% | |
| 2014 [23] | 3,075 | 7,269 | 26 | 6.3% | |
| 2015 [24] [25] | 3,075 | 7,077 | 26.3 | 6.5% | |
| 2016 | 3,075 | 8,043 | 29.9 | 7.1% | |
| 2017 | 3,075 | 6,925 | 25.7 | ||
| 2018 | 3,075 | 7,899 | 29.3 | ||
| 2019 | 3,085 | 6,679 | 24.7 | 7.33% | |
| 2020 [3] | 3,395 | 9,265 | 28 | ||
| 2021 | 9,458 | ||||
| Washington Wind Generation (GWh, Million kWh) | |||||||||||||
|---|---|---|---|---|---|---|---|---|---|---|---|---|---|
| Year | Total | Jan | Feb | Mar | Apr | May | Jun | Jul | Aug | Sep | Oct | Nov | Dec |
| 2002 | 418 | 48 | 21 | 51 | 35 | 28 | 33 | 36 | 31 | 34 | 26 | 33 | 42 |
| 2003 | 602 | 28 | 35 | 71 | 76 | 42 | 74 | 61 | 55 | 33 | 42 | 52 | 33 |
| 2004 | 737 | 70 | 59 | 85 | 62 | 72 | 48 | 39 | 47 | 57 | 65 | 58 | 75 |
| 2005 | 498 | 30 | 23 | 56 | 42 | 48 | 63 | 34 | 38 | 40 | 44 | 49 | 31 |
| 2006 | 1,038 | 151 | 81 | 85 | 77 | 73 | 59 | 81 | 53 | 49 | 63 | 184 | 82 |
| 2007 | 2,439 | 151 | 155 | 211 | 197 | 183 | 211 | 156 | 200 | 201 | 206 | 196 | 372 |
| 2008 | 3,658 | 314 | 297 | 361 | 375 | 330 | 397 | 307 | 297 | 170 | 238 | 253 | 319 |
| 2009 | 3,571 | 316 | 144 | 435 | 322 | 330 | 356 | 239 | 345 | 282 | 307 | 334 | 161 |
| 2010 | 4,475 | 221 | 130 | 401 | 619 | 522 | 519 | 422 | 471 | 361 | 348 | 402 | 329 |
| 2011 | 6,261 | 519 | 484 | 513 | 745 | 557 | 637 | 529 | 572 | 367 | 497 | 499 | 342 |
| 2012 | 6,600 | 531 | 511 | 777 | 607 | 682 | 724 | 469 | 484 | 316 | 516 | 345 | 638 |
| 2013 | 7,003 | 502 | 672 | 649 | 890 | 610 | 537 | 568 | 456 | 587 | 350 | 505 | 677 |
| 2014 | 7,269 | 448 | 540 | 754 | 770 | 723 | 783 | 552 | 491 | 517 | 480 | 679 | 532 |
| 2015 | 7,077 | 304 | 492 | 573 | 681 | 524 | 567 | 772 | 717 | 554 | 578 | 608 | 707 |
| 2016 | 8,043 | 438 | 631 | 819 | 699 | 797 | 780 | 735 | 575 | 684 | 606 | 606 | 673 |
| 2017 | 6,925 | 282 | 441 | 650 | 806 | 567 | 772 | 827 | 611 | 528 | 664 | 498 | 279 |
| 2018 | 7,899 | 447 | 863 | 708 | 793 | 751 | 836 | 756 | 819 | 559 | 394 | 516 | 457 |
| 2019 | 6,679 | 315 | 385 | 366 | 764 | 720 | 884 | 819 | 688 | 641 | 519 | 325 | 253 |
| 2020 | 9,265 | 931 | 972 | 915 | 800 | 784 | 745 | 725 | 627 | 501 | 876 | 775 | 614 |
| 2021 | 9,298 | 553 | 1,028 | 798 | 911 | 803 | 703 | 584 | 709 | 673 | 738 | 920 | 887 |
| 2022 | 8,061 | 521 | 792 | 849 | 902 | 941 | 675 | 484 | 579 | 555 | 648 | 590 | 525 |
| 2023 | 631 | 873 | 846 | 780 | 568 | 509 | 478 | 539 | 544 | 547 | 666 | ||
Source: [16]
See also
- Solar power in Washington (state)
- Wind power in the United States
- Renewable energy in the United States
References
- ^ 2016 State of the Interconnection page 23. WECC, 2016. Archive
- ^ "Washington Wind Energy" (PDF). U.S. Wind Energy State Facts. American Wind Energy Association. Retrieved 27 December 2017.
- ^ a b Wind Energy in Washington
- ^ "Washington Incentives for Renewables and Efficiency". Database of State incentives for renewable energy. Retrieved 2009-01-04.
- ^ a b c d e f g Staff (July 2010). "U.S. Wind Energy Projects - Washington". American Wind Energy Association. Retrieved 2010-07-28.
- ^ PSE Hopkins Ridge Wind Facility
- ^ Tucanon River Wind Farm
- ^ http://www.firstwind.com/wp-content/uploads/2014/01/Palouse-Fact-Sheet.pdf [ dead link]
- ^ "Nine Canyon Wind Project". Archived from the original on 2018-10-09. Retrieved 2019-11-15.
- ^ National Renewable Energy Laboratory (2010-02-04). "State wind energy potential (2010)". U.S. Department of Energy. Archived from the original on 2013-05-30. Retrieved 2010-07-31.
- ^ "Wind Energy Facts - Washington" (PDF). AWEA. August 2011. Retrieved 2012-01-23.
- ^ Renewable Energy Technical Potential
- ^ "AWEA Annual Report 2011". American Wind Energy Association. April 12, 2012. Retrieved April 14, 2012.
- ^ "Wind Powering America: Installed U.S. Wind Capacity and Wind Project Locations". U.S. Department of Energy. April 2011. Retrieved 2011-05-30.
- ^ Office of Energy Efficiency and Renewable Energy (2015-06-30). "Installed Wind Capacity By State". United States Department of Energy. Retrieved 2015-11-16.
- ^ a b "Electricity Data Browser". U.S. Department of Energy. March 28, 2018. Retrieved August 15, 2021.
- ^ WINDExchange: U.S. Installed and Potential Wind Power Capacity and Generation
- ^ "Capacity factor", Wikipedia, 2021-08-22, retrieved 2021-08-25
- ^ "Electric Power Monthly with Data for December 2010" (PDF). U.S. Energy Information Administration. March 2011. Retrieved 2015-11-16.
- ^ "Electric Power Monthly with Data for December 2011" (PDF). U.S. Energy Information Administration. February 2012. Retrieved 2015-11-16.
- ^ "Electric Power Monthly with Data for December 2012" (PDF). U.S. Energy Information Administration. February 2013. Retrieved 2015-11-16.
- ^ "Electric Power Monthly with Data for December 2013" (PDF). U.S. Energy Information Administration. February 2014. Retrieved 2015-11-16.
- ^ "Electric Power Monthly with Data for December 2014" (PDF). U.S. Energy Information Administration. February 2015. Retrieved 2015-11-16.
- ^ "Electric Power Monthly with Data for December 2015" (PDF). U.S. Energy Information Administration. February 2016. Retrieved 2016-04-03.
- ^ windexchange
External links
| Wind power by state |
| |
|---|---|---|
| Large wind farms | ||
| Offshore wind farms |
| |
| Wind power companies | ||