Types of periodic tables
.svg)
Since Dimitri Mendeleev formulated the periodic law in 1871, and published an associated periodic table of chemical elements, authors have experimented with varying types of periodic tables including for teaching, aesthetic or philosophical purposes.
Earlier, in 1869, Mendeleev had mentioned different layouts including short, medium, and even cubic forms. It appeared to him that the latter (three-dimensional) form would be the most natural approach but that "attempts at such a construction have not led to any real results." [2] On spiral periodic tables, "Mendeleev...steadfastly refused to depict the system as [such]...His objection was that he could not express this function mathematically." [3]
Typology
In 1934, George Quam, a chemistry professor at Long Island University, New York, and Mary Quam, a librarian at the New York Public Library complied and published a bibliography of 133 periodic tables using a five-fold typology: I. short; II. long (including triangular); III. spiral; IV. helical, and V. miscellaneous.
In 1974 Edward Mazurs, a professor of chemistry, published a survey and analysis of about seven hundred periodic tables that had been published in the preceding one hundred years; he recognized short, medium, long, helical, spiral, series tables, and tables not classified.
In 1999 Mark Leach, a chemist, inaugurated the INTERNET database of Periodic Tables, currently with over 1200 entries. While the database is a chronological compilation, specific types of periodic tables that can be searched for are spiral and helical, 3-dimensional, and miscellaneous.
For convenience, periodic tables may be typified as either: 1. short; 2. triangular; 3. medium; 4. long; 5. continuous (circular, spiral, lemniscate, or helical); 6. folding; or 7. spatial. Tables that defy easy classification are counted as type 8. unclassified.
Short


Short tables have around eight columns. This form became popular following the publication of Mendeleev's eight-column periodic table in 1871.
Also shown in this section is a modernized version of the same table.
Mendeleev and others who discovered chemical periodicity in the 1860s had noticed that when the elements were arranged in order of their atomic weights there was as an approximate repetition of physiochemical properties after every eight elements. Consequently, Mendeleev organized the elements known at that time into a table with eight columns. He used the table to predict the properties of then unknown elements. While his hit rate was less than 50% it was his successes that propelled the widespread acceptance of the idea of a periodic table of the chemical elements. [4] The eight-column style remains popular to this day, most notably in Russia, Mendeleev's country of birth.
An earlier attempt by Newlands, an English chemist, to present the nub of the same idea to the London Chemical Society, in 1866, was unsuccessful; [5] members were less than receptive to theoretical ideas, as was the British tendency at the time. [6] He referred to his idea as the Law of Octaves, at one point drawing an analogy with an eight-key musical scale.
John Gladstone, a fellow chemist, objected on the basis that Newland's table presumed no elements remained to be discovered. "The last few years had brought forth thallium, indium, caesium, and rubidium, and now the finding of one more would throw out the whole system." [5] He believed there was as close an analogy between the metals named in the last vertical column as in any of the elements standing on the same horizontal line.
Fellow English chemist Carey Foster humorously inquired of Newlands whether he had ever examined the elements according to the order of their initial letters. Foster believed that any arrangement would present occasional coincidences, but he condemned one which placed so far apart manganese and chromium, or iron from nickel and cobalt.
The advantages of the short form of periodic table are its compact size and that it shows the relationships between main group elements and transition metal groups; its disadvantages are that it fails to accomodate the electron configuration arrangements of the elements and that it appears to group dissimilar elements such as chorine and manganese together.
Some other notable short periodic tables include:
| 1862 | Meyer's system: 28 elements in 6 columns [7] |
| 1895 | Retger's Periodic Table: Intraperiodic accommodation of the rare earths (a) [8] |
| 1902 | Brauner’s table: Intraperiodic accommodation of the rare earths (b) [9] |
| 1906 | Mendeleev’s table: with six supposedly missing elements between H and He [10] |
| 1923 | Deming’s other table: Mendeleev style with dividing line between metals and nonmetals [11] |
| 1924 | Hubbard chart of atoms: American classic [12] |
| 1935 | Rysselberghe’s table: Separated blocks [13] |
| 1945 | Krafft’s table: Ten groups [14] |
| 1950 | Sidgwick’s classification (Mendeleeff): Lanthanides collocated; actinides fragmented [15] |
| 1960 | International Rectifier Corporation table: Rainbow style [16] |
| 1975 | Shukarev’s system: Transition metals turn back on themselves [17] |
| 2011 | Tresvyatskii's table: Assignment of lanthanides and actinides to groups [18] |
Triangular


Triangular tables have column widths of 2-8-18-32 or thereabouts. An early example, appearing in 1882, was provided by Bayley. [20]
Through the use of connecting lines, such tables make it easier to indicate analogous properties among the elements.
In some ways they represent a form intermediate between the short and medium tables, since the average width of the fully mature version (with widths of 2+8+18+32 = 60) is 15 columns.
An early drawback of this form was to make predictions for missing elements based on considerations of symmetry. For example, Bayely considered the rare earth metals to be indirect analogues of other elements such as, for example, zirconium and niobium, a presumption which turned out to be largely unfounded. [21]
Advantages of this form are its aesthetic appeal, and relatively compact size; disadvantages are its width, the fact that it is harder to draw, and interpreting certain periodic trends or relationships may be more challenging compared to the traditional rectangular format.
Some other notable triangular periodic tables include:
| 1895 | Thomsen’s systematic arrangement: Electropositive and electronegative elements labelled [22] |
| 1911 | Adam's table: Separation of lanthanides (left) and radioactives (right) [23] |
| 1922 | Bohr's system: Based on modern atomic theory [24] |
| 1935 | Zmaczynski’s table: Period 0 above H-He [25] |
| 1949 | Antropoff’s representation revised by Fritz Scheele: Lanthanides and actinides included in main body [26] |
| 1952 | Coryell’s table: Bifurcating groups limited to 3 and 13 [27] |
| 1967 | Sanderson's table: 2-8-10-14 stacked periods [28] |
| 1987 | Step-pyramid form of the periodic chart: Modernised version of 1882 Bayley [29] |
| 1989 | Seaborg’s electron shell table: Up to Z = 168 [30] |
| 1995 | Klein's table: Breaks at the start of each new block [31] |
Medium


Medium tables have around 18 columns. The popularity of this form is thought to be a result of it having a good balance of features in terms of ease of construction and size, and its depiction of atomic order and periodic trends. [35]
Deming's version of a medium table, which appeared in the first edition of his 1923 textbook "General Chemistry: An Elementary Survey Emphasizing Industrial Applications of Fundamental Principles", has been credited with popularizing the 18-column form. [36] [n 2]
LeRoy [37] referred to Deming's table, "this...being better known as the 'eighteen columns'-form" as representing "a very marked improvement over the original Mendeleef type as far as presentation to beginning classes is concerned."
Merck and Company prepared a handout form of Deming's table, in 1928, which was widely circulated in American schools. By the 1930s his table was appearing in handbooks and encyclopedias of chemistry. It was also distributed for many years by the Sargent-Welch Scientific Company. [38] [39] [40]
The advantages of the medium form are that it correlates the positions of the elements with their electronic structures, accommodates the vertical, horizontal and diagonal trends that characterise the elements;, and separates the metals and nonmetals; its disadvantages are that it obscures the relationships between main group elements and transition metals.
Some other notable medium tables include:
| 1920 | Stewart’s arrangement: The lanthanides accommodated in its 18 columns [41] |
| 1945 | Seaborg's table: Suggested an actinide series to complement the lanthanides [42] |
| 1956 | Remy’s “long” period form: Uranides competing with Seaborg’s actinides [43] |
| 1976 | Seaborg’s futuristic table: Elements up to Z = 168 [44] |
| 1980 | Jodogne’s tableau: Upside down [45] |
| 1990 | IUPAC Red Book table: 15-wide f-block [46] |
| 2002 | Inorganic chemist’s table: Major and minor patterns indicated. [47] |
| 2006 | Scerri’s table: Symmetrical [48] |
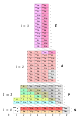
Long

.svg)
Long tables have around 32 columns. Early examples are given by Bassett (1892), [49] with 37 columns arranged albeit vertically rather than horizontally; Gooch & Walker (1905), [50] with 25 columns; and by Werner (1905), [51] with 33 columns.
In the first image in this section, of a so-called left step table:
- Groups 1 and 2 (the s-block) have been moved to the right side of the table.
- The s-block is shifted up one row, thus all elements not in the s-block are now one row lower than in the standard table. For example, most of the fourth row in the standard table is the fifth row in this table.
- Helium is placed in group 2 (not in group 18).
The elements remain positioned in order of atomic number (Z).
The left step table was developed by Charles Janet, in 1928, originally for aesthetic purposes. That being said it shows a reasonable correspondence with the Madelung energy ordering rule this being a notional sequence in which the electron shells of the neutral atoms in their ground states are filled.
A more conventional long form of periodic table is included for comparison.
The advantage of the long form is that shows where the lanthanides and actinides fit into the periodic table; its disadvantage is its width.
Some other notable long tables include:
| 1892 | Bassett’s vertical arrangement: 37 columns sideways [52] |
| 1905 | Gooch & Walker’s system: 25 columns [53] |
| 1905 | Werner’s arrangement: 33 groups [54] |
| 1927 | LeRoy’s table: Left step precursor; three sets of transition elements [55] |
| 1928 | Corbino’s right-step table: No gaps between elements [56] |
| 1934 | Romanoff's system: First long form with actinides under lanthanides (including a split d-block) [57] |
| 1964 | Ternstrom’s A periodic table: A triple-combo table drawing on the advantages of the complete block system according to Werner (1905) and a horizontal Bohr line-system; the outcome resembles the left step form of Janet (1928) [58] |
| 1982 | Periodiska systems rätta form: Left step variation with novel placement of H-He [59] |
| 2002 | Tabla Periódica de Los Elementos Químicos-Forma Armonica - Sistema A-2 (Periodic Table of Chemical Elements-Harmonic Form): Left step variation in which groups 1 and 2 are redistributed [60] |
| 2018 | Beylkin’s table: Symmetrical table with lanthanides and actinides incorporated [61] |
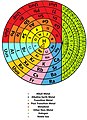
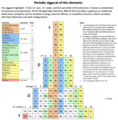
Continuous

Encompassing circular, spiral, lemniscate, or helical tables.
The Crookes' lemniscate periodic table shown in this section has the following elements falling under one another:
| H | He | Li | Gl | B | C | N | O | F | Na | Mg | Al | Si | P | S |
| Cl | Ar | K | Ca | Sc | Ti | V | Cr | Mn·Fe·Ni·Co | Cu | Zn | Ga | Ge | As | Se |
| Br | Kr | Rb | Sr | Yt | Zr | Nb | Mo | Rh·Ru·Pd | Ag | Cd | In | Sn | Sb | Te |
| I | – | Cs | Ba | La | Ce | ( ) | ( ) | ( ) | ( ) | ( ) | ( ) | ( ) | ( ) | ( ) |
| ( ) | – | ( ) | ( ) | ( ) | ( ) | Ta | W | Ir·Pt·Os | ( ) | ( ) | ( ) | ( ) | ( ) | ( ) |
| – | – | – | – | – | Th | – | Ur | – | – | – | – | – | – | – |
The collocation of manganese with iron, nickel and cobalt is later seen in the modernised version of von Bichowsky's table of 1918, in the unclassified section of this article.
 |
 |
 |
The French geologist, Alexandre-Émile Béguyer de Chancourtois was the first person to make use of atomic weights to produce a classification of periodicity. He drew the elements as a continuous spiral around a metal cylinder divided into 16 parts. [64] The atomic weight of oxygen was taken as 16 and was used as the standard against which all the other elements were compared. Tellurium was situated at the centre, prompting vis tellurique, or telluric screw.
The advantage of this form is that it emphasizes, to a greater or lesser degree, that the elements form a continuous sequence; that said, continuous tables are harder to construct, read and memorize than the traditional rectangular form of periodic table.
Some other notable forms of continuous periodic tables include:
| 1867 | Hinrichs’ programme of atomechanics: Captures many of the primary periodic relationships seen in the modern table while not being cluttered by attempts to show secondary relationships [65] |
| 1886 | Shepard’s natural classification: A spiral form with instructions for turning it into a tube [66] |
| 1905 | Gooch & Walker's primary, secondary, and tertiary series of elements: An early depiction of double periodicity among the Ln [67] |
| 1914 | Hackh’s periodic table: First spiral to take account of Mosley's atomic numbers, and the first to show successively larger pairs of coils. Also interesting as H stands alone in the centre [68] |
| 1925 | Courtines’ a model of the periodic table: A helix with the appearance of a submarine [69] |
| 1939 | Irwin’s periodic tableExtensive analysis of periodicity patterns [70] |
| 1940 | Gamow [first] ribbon periodic table Noble gases as Group 0 [71] |
| 1965 | Alexander arrangement of elements: Designed to complement the point at which education on the arrangement of atoms into a chart begins, much as the world globe establishes the reality, and to emphasise the vital and convenient nature of flat printed projections or maps [72] |
| 1999 | Moran’s spiral periodic table: In hexagonal form [73] |
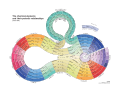
| 2003 | Chemical galaxy II: Starry pathway to link the elements, express the astronomical reach of chemistry, stimulate the imagination and evoke wonder at the order underlying the universe [74] |
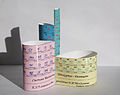
Folding

Such tables, which incorporate a folding mechanism, are relatively uncommon:
| 1895 | An early example is the 'Flap’ Model of the periodic table by David Orme Masson. [76] |
| 1915 | William Ramsay, in his book The Gases of The Atmosphere, included a periodic table with a fold (or flap) that can be moved from page 220 to 221. [77] [78] |
| 1950 | McCutchon published a short table in which the d- and f-blocks were depicted as folding flaps positioned on top of the s- and p-blocks. [75] |
| 2015 | Quantum Fold Periodic Table. [79] |
| 2016 | A left step periodic table in the traditional Japanese " byobu" style. [80] |
| 2022 | A hexaflexagon periodic table. [81] |
The advantages of such tables are their novelty and that they can depict relationships that ordinarily require spatial periodic tables, yet retain the portability and convenience of two-dimensional tables. A disadvantage is that they require marginally more effort to construct.
Spatial
.jpg)
Spatial tables pass through three or more dimensions (helical tables are instead classed as continuous tables). Such tables are relatively niche and not as commonly used as traditional tables. While they offer unique advantages, their complexity and customization requirements make them more suitable for specialized research, advanced education, or specific areas of study where a deeper understanding of multidimensional relationships is desired.
Advantages of periodic tables of three or more dimensions include:
- Enhanced visualization. Such tables provide a unique and enhanced visualization of the elements and their properties. By incorporating additional dimensions, such as depth or multiple axes, these tables offer a more comprehensive representation of the periodic trends and relationships among the elements. They can provide a richer understanding of complex patterns and interactions.
- Inclusion of extra properties: Traditional periodic tables typically focus on a few key properties, such as atomic number and atomic weight. However, periodic tables of three or more dimensions have the potential to include additional properties, such as electronegativity, ionization energy, electron affinity, or physical properties like boiling point or melting point. This expanded information can offer a more complete picture of the elements and their characteristics.
- Exploration of higher-level trends: Such tables can facilitate the exploration of higher-level trends and relationships that may not be apparent in traditional two-dimensional tables. They allow for the visualization of complex patterns that emerge when multiple properties or variables are considered simultaneously. This can aid in uncovering hidden connections and correlations among the elements.
- Flexibility and customization: Periodic tables of three or more dimensions offer flexibility in terms of their design and customization. Researchers, educators, or scientists can adapt the dimensions and properties represented based on their specific needs and objectives. This adaptability allows for tailoring the table to focus on specific areas of interest or research.
Disadvantages are:
- Complexity: As the number of dimensions increases, the complexity of interpreting and understanding the table also increases. It can become more challenging for individuals to grasp and visualize the relationships between elements, especially when multiple properties are incorporated. The intricate nature of these tables may require additional effort and familiarity to navigate and interpret effectively.
- Difficulty in representation: Depicting periodic trends and relationships in three or more dimensions can be technically challenging. Designing and visualizing the table in a clear and coherent manner may require specialized software or tools. The complexity of these tables can make them less accessible for individuals who are not familiar with the specific representation or visualization techniques used.
- Information overload: The inclusion of multiple dimensions and properties can lead to information overload, especially if the table is not designed in a user-friendly and organized manner. It becomes crucial to effectively organize and present the data to avoid overwhelming users with excessive details. Striking a balance between comprehensive information and clarity can be a significant challenge.
- Lack of standardization: Periodic tables of three or more dimensions are not as standardized or widely recognized as traditional two-dimensional tables. This lack of standardization can create confusion and inconsistency across different representations. It can also make it more difficult to compare and communicate information between different periodic table formats.
Some other notable spatial periodic tables include:
| 1920 | Kohlweiler’s system: First spatial system—Parallel planes connected by pillars of transition group and lanthanide element [83] |
| 1925 | Friend’s periodic sphere: First spherical form [84] |
| 1945 | Talpain’s gnomonic classification of the elements: Diagram in space having the form of a double pyramid [85] |
| 1949 | Wringley's Lamina System: First 2D/3D hybrid [86] |
| 1954 | Sabo & Lakatosh’s volumetric model of the periodic table: Modular apartment building complex form [87] |
| 1965 | Giguère’s periodic table: Weather vane form [88] |
| 1972 | Octagonal prismatic periodic table: Like it says [89] |
| 1982 | Cement chemist’s periodic cube: Say no more [90] |
| 1983 | Periodic pyramid: Like it says. [91] |
| 1989 | Stowe’s A physicist’s periodic table: 4-dimensional [92] |
| 1990 | Dufour’s periodic tree: Like it says [93] |
| 1992 | Magarshak & Malinsky’s three-dimensional periodic table: Quantum mechanics-based table with group 3 as Sc-Y-La-Ac [94] |
| 2003 | Graphic representations of the periodic system: As a building [95] |
| 2003 | Two-amphitheatre pyramid periodic table: Like it says [96] |
| 2011 | Aldersley 3D periodic table:As four apartments [97] |
| 2014 | ADOMAH Periodic table glass cube: A separated table inside a tetrahedron inside a cube [98] |
| 2019 | Grainger’s elemental periodicity with “concentric spheres intersecting orthogonal planes” formulation: A table in or on the corner of a room or table [99] |
Unclassified

Unclassified periodic tables defy easy classification:
| 1891 | Wendt’s generation-tree of the elements: You have to see it to understand it [101] |
| 1893 | Nechaev’s truncated cones: Like it says [102] |
| 1907 | Grouping of the elements to illustrate refractivity: Runs from group 12 on the left to group 13 on the right [103] |
| 1918 | Cherkesov: Two periodic tables: Mn in group 8 rather than group 7 [104] |
| 1920 | Stewart’s arrangement of the elements: With 14 lanthanides incorporated [105] |
| 1934 | Romanoff's system: Combined spiral-lemniscate [106] |
| 1944 | Müller’s tree system: Like it says [107] |
| 1950 | Clark’s updated periodic table: Arena system [108] |
| 1971 | Clark, John O. E. periodic table: Inspired by the trippy 60s? [109] |
| 2005 | Rich’s periodic chart exposing diagonal relationships: Non-metals of the left; metals on the right [110] |
| 2018 | Beylkin’s periodic table of the elements:4n2 periods, where n = 2,3..., and shows symmetry, regularity, and elegance, more so than Janet’s left step table [111] |
| 2019 | Alexander arrangement unwrapped... and rewrapped: p, d and f blocks moving away from the s block in 3-dimensional space [112] |
Gallery
-
 ADOMAH (long)
 -
 Curled ribbon (continuous)
 -
 Four loops (continuous)
 -
 Discoid (circular)
 -
 Spiral
 -
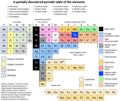 Partially disordered (unclassified)
 -
 Ziggurat (unclassified)
 -
 Ziggurat notes, cont.
.svg)


.SVG)


Notes
- ^ These elements are generally regarded as being too diverse to merit a collective classification and, in this context, have been referred to as other nonmetals or, more plainly, as nonmetals, located between the metalloids and the halogens.
- ^ An antecedent of Deming's 18-column table may be seen in Adams' 16-column Periodic Table of 1911. Adams omits the rare earths and the "radioactive elements" (i.e. the actinides) from the main body of his table and instead shows them as being " careted in only to save space" (rare earths between Ba and eka-Yt; radioactive elements between eka-Te and eka-I). See: Elliot Q. A. (1911). "A modification of the periodic table". Journal of the American Chemical Society. 33(5): 684–88 [687].
References
- ^ Benfey, Theodor (2009). "The Biography of a Periodic Spiral: from Chemistry magazine, via Industry, to a Foucault Pendulum" (PDF). Bulletin for the History of Chemistry. 34 (2): 141–145. Retrieved 20 January 2018.
- ^ Mendeleev, DI (1869). "On the correlation between the properties of the elements and their atomic weight". Zhurnal Russkoe Fiziko-Khimicheskoe Obshchestvo. 1: 60–77 (note 2).
- ^ Stewart, PJ (2018). "Chapter 3: Amateurs and professionals in chemistry: The case of the periodic system". In Scerri, E; Restrepo, G (eds.). Mendeleev to Oganesson: A Multidisciplinary Perspective on the Periodic Table. Proceedings of the 3rd International Conference on the Periodic Table, Cuzco, Peru 14–16 August 2012. Oxford: Oxford University Press. pp. 66–79 (68). ISBN 978-0-86380-292-8.
- ^ Stewart, PJ (2019). "Mendeleev's predictions: success and failure,". Foundations of Chemistry. 21: 3–9. doi: 10.1007/s10698-018-9312-0.
- ^ a b Giunta C (2002). "An unsystematic foreshadowing: J. A. R. Newlands, in Elements and Atoms: Case Studies in the Development of Chemistry". Le Moyne College, Department of Chemistry. Retrieved November 27, 2021.
- ^ Scerri, E (2020). The Periodic Table: Its Story and Significance (2 ed.). New York: Oxford University Press. p. 87. ISBN 978-0-19-091436-3.
- ^ "Meyer's Periodic System". The INTERNET Database of Periodic Tables. 1862. Retrieved June 6, 2023.
- ^ "Retger's Periodic Table". The INTERNET Database of Periodic Tables. 1862. Retrieved June 6, 2023.
- ^ "Brauner's Periodic System". The INTERNET Database of Periodic Tables. 1862. Retrieved June 6, 2023.
- ^ "Mendeleev's 1906 Periodic Table". The INTERNET Database of Periodic Tables. 1906. Retrieved June 6, 2023.
- ^ "Deming's other 1923 table: Mendeleev style". The INTERNET Database of Periodic Tables. 1902. Retrieved June 6, 2023.
- ^ "Hubbard Periodic Chart Of The Atoms". The INTERNET Database of Periodic Tables. 1924. Retrieved June 6, 2023.
- ^ "Rysselberghe's Periodic Table". The INTERNET Database of Periodic Tables. 1902. Retrieved June 6, 2023.
- ^ "Krafft's table". The INTERNET Database of Periodic Tables. 1902. Retrieved June 6, 2023.
- ^ "Sidgwick's classification (Mendeleeff)". The INTERNET Database of Periodic Tables. 1902. Retrieved June 6, 2023.
- ^ "International Rectifier Corporation table". The INTERNET Database of Periodic Tables. 1902. Retrieved June 6, 2023.
- ^ "Shukarev's Periodic System". The INTERNET Database of Periodic Tables. 1975. Retrieved June 6, 2023.
- ^ "Tresvyatskii's Periodic Table". The INTERNET Database of Periodic Tables. 2011. Retrieved June 6, 2023.
- ^ Lee, E (1908). A Text-book of Experimental Chemistry (with Descriptive Notes) for Students of General Inorganic Chemistry. Philadelphia: P. Blakiston's Son & Co. p. 173.
- ^ Bayley, T (1882). "III. On the connexion between the atomic weight and the chemical and physical properties of elements". The London, Edinburgh, and Dublin Philosophical Magazine and Journal of Science. 13 (78): 26–37. doi: 10.1080/14786448208627140.; Quam & Quam (1934). "Bayley's Periodic System". The INTERNET Database of Periodic Tables. Mark Leach. Retrieved June 6, 2023.
- ^ van Spronsen, JW (1969). The Periodic System of Chemical Elements: A History of the First Hundred Years. Amsterdam: Elsevier. p. 148. ISBN 978-0-444-40776-4.
- ^ "Thomsen's Systematic Arrangement of the Chemical Elements". The INTERNET Database of Periodic Tables. 1895. Retrieved June 6, 2023.
- ^ "Adams' Periodic Table". The INTERNET Database of Periodic Tables. 1911. Retrieved June 6, 2023.
- ^ "Bohr's System". The INTERNET Database of Periodic Tables. 1922. Retrieved June 6, 2023.
- ^ "Zmaczynski's Triangular Periodic Table". The INTERNET Database of Periodic Tables. 1935. Retrieved June 6, 2023.
- ^ "Antropoff's Representation of the Periodic System Revised by Fritz Scheele". The INTERNET Database of Periodic Tables. 1949. Retrieved June 6, 2023.
- ^ "Coryell's Periodic Table in Long Form". The INTERNET Database of Periodic Tables. 1952. Retrieved June 6, 2023.
- ^ "Sanderson's Periodic Table of the Chemical Elements". The INTERNET Database of Periodic Tables. 1967. Retrieved June 6, 2023.
- ^ "Step-Pyramid Form of the Periodic Chart". The INTERNET Database of Periodic Tables. 1987. Retrieved June 6, 2023.
- ^ "Electron Shell Periodic Table". The INTERNET Database of Periodic Tables. 1989. Retrieved June 6, 2023.
- ^ "Klein's Periodic Table of The Elements". The INTERNET Database of Periodic Tables. 1995. Retrieved June 6, 2023.
- ^ Deming, H. G. (1923). General chemistry: An elementary survey. New York: J. Wiley & Sons. p. 165.
- ^ "Periodic Table of Chemical Elements". www.acs.org. American Chemical Society. 2021. Archived from the original on 3 February 2021. Retrieved 27 March 2021.
- ^ Jensen, William B. (2000). "The Periodic Law and Table" (PDF). Archived from the original (PDF) on 2020-11-10. Retrieved 10 December 2022.
- ^ Scerri, E. (2011). The periodic table: A very short introduction. Oxford: Oxford University Press. ISBN 978-0-19-958249-5.; Francl, M. (May 2009). "Table manners" (PDF). Nature Chemistry. 1 (2): 97–98. Bibcode: 2009NatCh...1...97F. doi: 10.1038/nchem.183. PMID 21378810. Archived (PDF) from the original on 25 October 2012.
- ^ Robinson, R (2018), Creating a Symbol of Science: The Development of a Standard Periodic Table of the Elements (Doctoral thesis), p. 258–263; 268–269, 275, retrieved June 6, 2023
- ^ LeRoy, RH (1927). "Teaching the periodic classification of elements". School Science and Mathematics. 27 (8): 793–799 (793). doi: 10.1111/j.1949-8594.1927.tb05776.x.
- ^ Abraham, M.; Coshow, D.; Fix, W. Periodicity:A source book module, version 1.0 (PDF). New York: Chemsource, Inc. p. 3. Archived from the original (PDF) on 14 May 2012.
- ^ Emsley, J. (7 March 1985). "Mendeleyev's dream table". New Scientist: 32–36 [36].
- ^ Fluck, E. (1988). "New notations in the period table". Pure and Applied Chemistry. 60 (3): 431–36 [432]. doi: 10.1351/pac198860030431.
- ^ "Stewart's Arrangement of The Elements". The INTERNET Database of Periodic Tables. 1920. Retrieved June 6, 2023.
- ^ "Seaborg's Periodic Table of 1945". The INTERNET Database of Periodic Tables. 1945. Retrieved June 6, 2023.
- ^ "Remy's Long Period Form Periodic Table". The INTERNET Database of Periodic Tables. 1956. Retrieved June 6, 2023.
- ^ "Seaborg's Futuristic Periodic Table". The INTERNET Database of Periodic Tables. 1976. Retrieved June 6, 2023.
- ^ "Jodogne's Tableau des Éléments". The INTERNET Database of Periodic Tables. 1980. Retrieved June 6, 2023.
- ^ "Nomenclature of inorganic chemistry : recommendations 1990". Internet Archive. 1990. Retrieved June 6, 2023.
- ^ "Inorganic Chemist's Periodic Table". The INTERNET Database of Periodic Tables. 2002. Retrieved June 6, 2023.
- ^ "Eric Scerri's Triad Periodic Table". The INTERNET Database of Periodic Tables. 2006. Retrieved June 6, 2023.
- ^ Mark Leach (1892). "Bassett's Vertical Arrangement". The INTERNET Database of Periodic Tables. Mark Leach. Retrieved June 6, 2023.
- ^ Mark Leach (1905). "Gooch & Walker's Periodic System of The Elemens". The INTERNET Database of Periodic Tables. Mark Leach. Retrieved June 6, 2023.
- ^ Mark Leach (1905). "Werner's Arrangement". The INTERNET Database of Periodic Tables. Mark Leach. Retrieved June 6, 2023.
- ^ "Bassett's Vertical Arrangement". The INTERNET Database of Periodic Tables. 1892. Retrieved June 6, 2023.
- ^ "Gooch & Walker's Periodic System of The Elements". The INTERNET Database of Periodic Tables. 1905. Retrieved June 6, 2023.
- ^ "Werner's Arrangement". The INTERNET Database of Periodic Tables. 1905. Retrieved June 6, 2023.
- ^ "LeRoy's Periodic Table". The INTERNET Database of Periodic Tables. 1927. Retrieved June 6, 2023.
- ^ "Corbino's Right-Step Periodic Table". The INTERNET Database of Periodic Tables. 1928. Retrieved June 6, 2023.
- ^ "Romanoff's System". The INTERNET Database of Periodic Tables. 1934. Retrieved June 6, 2023.
- ^ "Ternström's Periodic Table". The INTERNET Database of Periodic Tables. 1964. Retrieved June 6, 2023.
- ^ "Periodiska Systems Rätta Form". The INTERNET Database of Periodic Tables. 1982. Retrieved June 6, 2023.
- ^ "Sistema Periódico Armonico de Gutierrez-Samanez". The INTERNET Database of Periodic Tables. 2002. Retrieved June 6, 2023.
- ^ "Beylkin's Periodic Table of The Elements". The INTERNET Database of Periodic Tables. 2018. Retrieved June 6, 2023.
- ^ Scholten, Jan (2005). Secret lanthanides: Road to independence. Utrecht: Stichting Alonnissos. ISBN 978-90-74817-16-5.
- ^ Crookes, W. "The position of helium, argon, and krypton in the scheme of elements". Scientific American Supplement. 46 (1182): 18948.
- ^ Mark Leach (1905). "Béguyer de Chancourtois' Vis Tellurique". The INTERNET Database of Periodic Tables. Mark Leach. Retrieved June 6, 2023.
- ^ "Hinrichs' Programme of Atomechanics". The INTERNET Database of Periodic Tables. 1867. Retrieved June 6, 2023.
- ^ "Shepard's Natural Classification". The INTERNET Database of Periodic Tables. 1886. Retrieved June 6, 2023.
-
^
"Gooch & Walker's Primary, Secondary, and Tertiary Series of Elements". The INTERNET Database of Periodic Tables. 0000. Retrieved June 6, 2023.
{{
cite web}}
: Check date values in:|date=( help) - ^ "Hackh's Spiral Periodic Table". The INTERNET Database of Periodic Tables. 1914. Retrieved June 6, 2023.
- ^ "Courtines' Model of the Periodic Table or Periodic Classification". The INTERNET Database of Periodic Tables. 1925. Retrieved June 6, 2023.
- ^ "Irwin's Periodic Table". The INTERNET Database of Periodic Tables. 1939. Retrieved June 6, 2023.
- ^ "Gamow [First] Ribbon Periodic Table". The INTERNET Database of Periodic Tables. 1940. Retrieved June 6, 2023.
- ^ "Alexander Arrangement of Elements". The INTERNET Database of Periodic Tables. 1965. Retrieved June 6, 2023.
- ^ "Moran's Spiral Periodic Table". The INTERNET Database of Periodic Tables. 1999. Retrieved June 6, 2023.
- ^ "Philip Stewart's Chemical Galaxy II". The INTERNET Database of Periodic Tables. 2003. Retrieved June 6, 2023.
- ^ a b McCutchon, KB (1950). "A simplified periodic classification of the elements". Journal of Chemical Education. 27 (1): 17–19. doi: 10.1021/ed027p17.
- ^ Rae, ID (2013). "David Orme Masson, the Periodic Classification of the Elements and His 'Flap' Model of the Periodic Table". Historical Records of Australian Science. 24: 40–52. doi: 10.1071/HR12018.
- ^ Ramsay, W (1915). The Gases of The Atmosphere. London: McMillan. p. 220–221.
- ^ "Ramsay's The Elements Arranged in The Periodic System (with movable flap)". The INTERNET Database of Periodic Tables. 1915. Retrieved June 6, 2023.
- ^ Brian Gregory (2016). "Quantum Fold Periodic Table". The INTERNET Database of Periodic Tables. Mark Leach. Retrieved June 5, 2023.
- ^ Nagayasu Nawa (2015). "NAWA's byobu-Janet Periodic Table". The INTERNET Database of Periodic Tables. Mark Leach. Retrieved June 5, 2023.
- ^ Pablo Cassinello (2022). "Kaleidocycle of the Periodic Table". The INTERNET Database of Periodic Tables. Mark Leach. Retrieved June 5, 2023.
- ^ Katz, G (2001). "The Periodic Table: An Eight Period Table For The 21st Century". The Chemical Educator. 6 (6): 324–332 (331). doi: 10.1007/s00897010515a.
- ^ "Kohlweiler's System". The INTERNET Database of Periodic Tables. 1920. Retrieved June 6, 2023.
- ^ "Friend's Periodic Sphere". The INTERNET Database of Periodic Tables. 1925. Retrieved June 6, 2023.
- ^ "Talpain's Gnomonic Classification of the Elements". The INTERNET Database of Periodic Tables. 1945. Retrieved June 6, 2023.
- ^ "Wringley's lamina system". The INTERNET Database of Periodic Tables. 1949. Retrieved June 6, 2023.
- ^ "Sabo & Lakatosh's Volumetric Model of the Periodic Table". The INTERNET Database of Periodic Tables. 1954. Retrieved June 6, 2023.
- ^ "Giguère's Periodic Table". The INTERNET Database of Periodic Tables. 1965. Retrieved June 6, 2023.
- ^ "Octagonal Prismatic Periodic Table". The INTERNET Database of Periodic Tables. 1972. Retrieved June 6, 2023.
- ^ "Cement chemist's periodic cube". The INTERNET Database of Periodic Tables. 1982. Retrieved June 6, 2023.
- ^ "Periodic Pyramid". The INTERNET Database of Periodic Tables. 1983. Retrieved June 6, 2023.
- ^ "Stowe's A Physicist's Periodic Table". The INTERNET Database of Periodic Tables. 1989. Retrieved June 6, 2023.
- ^ "Dufour's Periodic Tree". The INTERNET Database of Periodic Tables. 1990. Retrieved June 6, 2023.
- ^ "Magarshak & Malinsky's Three Dimensional Periodic Table". The INTERNET Database of Periodic Tables. 1992. Retrieved June 6, 2023.
- ^ "Graphic Representations of the Periodic System". The INTERNET Database of Periodic Tables. 2003. Retrieved June 6, 2023.
- ^ "Two-Amphitheater Pyramid Periodic Table". The INTERNET Database of Periodic Tables. 2003. Retrieved June 6, 2023.
- ^ "Aldersley 3D Periodic Table". The INTERNET Database of Periodic Tables. 2011. Retrieved June 6, 2023.
- ^ "ADOMAH Periodic Table Glass Cube". The INTERNET Database of Periodic Tables. 2014. Retrieved June 6, 2023.
- ^ "Grainger's Elemental Periodicity with "Concentric Spheres Intersecting Orthogonal Planes" Formulation". The INTERNET Database of Periodic Tables. 2019. Retrieved June 6, 2023.
- ^ von Bichowsky, FR; Ponce, JAD (1918). "The place of manganese in the periodic system". Journal of the American Chemical Society. 40 (7): 1040–1046. doi: 10.1021/ja02240a008.
- ^ "Wendt's Generation-Tree of the Elements". The INTERNET Database of Periodic Tables. 1891. Retrieved June 6, 2023.
- ^ "Nechaev's Truncated Cones". The INTERNET Database of Periodic Tables. 1893. Retrieved June 6, 2023.
- ^ "Grouping of The Elements to Illustrate Refractivity". The INTERNET Database of Periodic Tables. 1907. Retrieved June 6, 2023.
- ^ "Cherkesov: Two Periodic Tables". The INTERNET Database of Periodic Tables. 1918. Retrieved June 6, 2023.
- ^ "Stewart's Arrangement of The Elements". The INTERNET Database of Periodic Tables. 1920. Retrieved June 6, 2023.
-
^
"Romanoff's System". The INTERNET Database of Periodic Tables. 0000. Retrieved June 6, 2023.
{{
cite web}}
: Check date values in:|date=( help) - ^ "Müller's Tree System". The INTERNET Database of Periodic Tables. 1944. Retrieved June 6, 2023.
- ^ "Clark's Updated Periodic Table". The INTERNET Database of Periodic Tables. 1950. Retrieved June 6, 2023.
- ^ "Clark, John O. E. Periodic Table". The INTERNET Database of Periodic Tables. 1970. Retrieved June 6, 2023.
- ^ "Rich's Periodic Chart Exposing Diagonal Relationships". The INTERNET Database of Periodic Tables. 2005. Retrieved June 6, 2023.
- ^ "Beylkin's Periodic Table of The Elements". The INTERNET Database of Periodic Tables. 2018. Retrieved June 6, 2023.
- ^ "Alexander Arrangement Unwrapped... and Rewrapped". The INTERNET Database of Periodic Tables. 2019. Retrieved June 6, 2023.
Further reading
- Blokh MA 1934, Iubileinomu mendeleevskomu s'ezdu v oznamenovanie 100-letnei godovshchinyso dnia rozhdeniia D. I. Mendeleeva (Anniversary Mendeleev Congress in commemoration of the 100th anniversary of the birth of D. I. Mendeleev), in Russian, Akad. Nauk SSSR, Leningrad
- Mazurs EG 1974, Graphic Representations of the Periodic System During One Hundred Years, University of Alabama Press, Alabama, ISBN 978-0-8173-3200-6
- Quam GN & Quam MB 1934, Types of graphic classifications of the elements I. Introduction and short tables, Journal of Chemical Education, vol. 11, no. 1, pp. 27–32, doi: 10.1021/ed011p27
- id., Types of graphic classifications of the elements II. Long charts, Journal of Chemical Education, vol. 11, no. 4, pp. 217–223, doi: 10.1021/ed011p217
- id., Types of graphic classifications of the elements III. Spiral, helical, and miscellaneous charts, Journal of Chemical Education, vol. 11, no. 5, pp. 288–297, doi: 10.1021/ed011p288
- Robinson A 2018, Creating a Symbol of Science: The Development of a Standard Periodic Table of the Elements, Doctoral Dissertations (1385), University of Massachusetts, Amherst
- Semenov NN 1969, 100 лет периодического закона химических элементов. 1869-1969 (100 years of the periodic law of chemical elements. 1869-1969), in Russian, Nauka, Moscow
- Venable FP 1896, The Development of the Periodic Law, Chemical Publishing Co., Easton, PA
External links
- Leach M 1999 to date, The INTERNET Database of Periodic Tables