| Tuolumne Peak | |
|---|---|
 Southeast aspect centered at top | |
| Highest point | |
| Elevation | 10,845 ft (3,306 m) NAVD 88 [1] |
| Prominence | 685 ft (209 m) [1] |
| Coordinates | 37°52′31″N 119°29′5″W / 37.87528°N 119.48472°W [1] |
| Geography | |
 Tuolumne Peak Location in California  Tuolumne Peak Tuolumne Peak (the United States) | |
| Location |
Yosemite National Park Tuolumne County, California, U.S. |
| Parent range | Sierra Nevada |
| Topo map | USGS Falls Ridge |
| Geology | |
| Age of rock | Cretaceous |
| Type of rock | Granodiorite |
| Climbing | |
| First ascent | Richard M. Leonard and Sierra Club party on July 9, 1932 |
Tuolumne Peak is a mountain, in Yosemite National Park, in the area of Tuolumne Meadows. It is a fractured granite, twin summited peak, and is close to geographic center of the park. Tuolumne Peak is located approximately 2.5 miles (4.0 km) northeast of Mount Hoffmann via a granite ridge-line. It is climbed less often than Hoffman, probably due to a more difficult approach. [2]
There is rock climbing, on Tuolumne Peak. [3]
Tenaya Glacier had effects, at least near Tuolumne Peak, during the Wisconsin Glacial Stage, over-topping the ridge that connects Tuolumne Peak to Mount Hoffman, isolating both tops. [4]
Climate
Tuolumne Peak is located in an alpine climate zone. [5] Most weather fronts originate in the Pacific Ocean, and travel east toward the Sierra Nevada mountains. As fronts approach, they are forced upward by the peaks ( orographic lift), causing them to drop their moisture in the form of rain or snowfall onto the range.
| Climate data for Tuolumne Peak (CA) 37.8744 N, 119.4855 W, Elevation: 10,289 ft (3,136 m) (1991–2020 normals) | |||||||||||||
|---|---|---|---|---|---|---|---|---|---|---|---|---|---|
| Month | Jan | Feb | Mar | Apr | May | Jun | Jul | Aug | Sep | Oct | Nov | Dec | Year |
| Mean daily maximum °F (°C) | 35.2 (1.8) |
34.1 (1.2) |
36.9 (2.7) |
40.7 (4.8) |
48.0 (8.9) |
57.8 (14.3) |
66.3 (19.1) |
65.0 (18.3) |
59.3 (15.2) |
50.4 (10.2) |
40.9 (4.9) |
35.1 (1.7) |
47.5 (8.6) |
| Daily mean °F (°C) | 26.0 (−3.3) |
24.1 (−4.4) |
26.4 (−3.1) |
29.3 (−1.5) |
36.0 (2.2) |
45.4 (7.4) |
53.0 (11.7) |
52.0 (11.1) |
46.5 (8.1) |
38.5 (3.6) |
30.7 (−0.7) |
25.5 (−3.6) |
36.1 (2.3) |
| Mean daily minimum °F (°C) | 16.7 (−8.5) |
14.2 (−9.9) |
15.9 (−8.9) |
17.9 (−7.8) |
24.0 (−4.4) |
33.0 (0.6) |
39.7 (4.3) |
39.1 (3.9) |
33.6 (0.9) |
26.6 (−3.0) |
20.5 (−6.4) |
15.9 (−8.9) |
24.8 (−4.0) |
| Average precipitation inches (mm) | 11.46 (291) |
10.14 (258) |
9.31 (236) |
5.30 (135) |
3.29 (84) |
0.90 (23) |
0.45 (11) |
0.25 (6.4) |
0.69 (18) |
3.13 (80) |
5.20 (132) |
10.58 (269) |
60.7 (1,543.4) |
| Source: PRISM Climate Group [6] | |||||||||||||
See also
Gallery
-
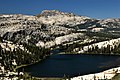 Lower Cathedral Lake and Tuolumne Peak
 -
 Mount Hoffman (L) and Tuolumne Peak (R)


References
- ^ a b c "Tuolumne Peak, California". Peakbagger.com. Retrieved 2019-02-05.
- ^ keema. "Tuolumne Peak California, United States, North America". summitpost.org. Retrieved 31 January 2019.
- ^ "Tuolumne Peak Rock Climbing". mountainproject.com. Retrieved 31 January 2019.
- ^ "ANCIENT GLACIERS OF THE YOSEMITE REGION". NPS. November 28, 2006. Retrieved 31 January 2019.
- ^ "Climate of the Sierra Nevada". Encyclopædia Britannica.
-
^
"PRISM Climate Group, Oregon State University". PRISM Climate Group, Oregon State University. Retrieved October 8, 2023.
To find the table data on the PRISM website, start by clicking Coordinates (under Location); copy Latitude and Longitude figures from top of table; click Zoom to location; click Precipitation, Minimum temp, Mean temp, Maximum temp; click 30-year normals, 1991-2020; click 800m; click Retrieve Time Series button.