| Timeline of the 2012 Atlantic hurricane season | |||||
|---|---|---|---|---|---|
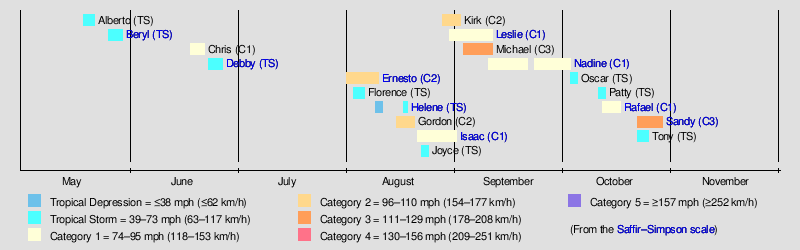
 Season summary map | |||||
| Season boundaries | |||||
| First system formed | May 19, 2012 | ||||
| Last system dissipated | October 29, 2012 | ||||
| Strongest system | |||||
| Name | Sandy | ||||
| Maximum winds | 115 mph (185 km/h) (1-minute sustained) | ||||
| Lowest pressure | 940 mbar ( hPa; 27.76 inHg) | ||||
| Longest lasting system | |||||
| Name | Nadine | ||||
| Duration | 22 days | ||||
| |||||
The 2012 Atlantic hurricane season was an event in the annual hurricane season in the north Atlantic Ocean. For the third year in a row there were 19 named storms. [1] The season officially began on June 1, 2012, and ended on November 30, 2012, dates that conventionally delimit the period of each year when most tropical cyclones develop in the Atlantic basin. [2] Surprisingly, two preseason storms formed: Alberto on May 19, and Beryl on May 26. This was the first such occurrence since the 1951 season. [3] The final storm to dissipate (second-to-last to become a named storm) was Sandy, on October 29. [4] [5] Altogether, ten storms became hurricanes, of which two intensified into major hurricanes. [nb 1] [nb 2]
Storm impact during the season was widespread and ruinous, with the most significant storms in term of loss of life and damage being hurricanes Isaac and Sandy. A Category 1 on the Saffir–Simpson hurricane wind scale, Isaac was a large system that moved ashore the coast of Louisiana on August 12; the storm resulted in 41 deaths overall. [8] Sandy, the second and final major hurricane of the season, was the largest Atlantic hurricane ever recorded, with a wind diameter of more than 1,100 mi (1,800 km). The system moved ashore the southern coast of New Jersey as an extratropical cyclone in late October. During its duration as a tropical cyclone, Sandy caused at least $68 billion (2012 USD) in damage and 285 fatalities. [9] [10] Sandy is the second-costliest Atlantic hurricane in recorded history, surpassed only by Hurricane Katrina during the 2005 season. [11]
This timeline includes information that was not operationally released, meaning that data from post-storm reviews by the National Hurricane Center, such as a storm that was not operationally warned upon, has been included. This timeline documents tropical cyclone formations, strengthening, weakening, landfalls, extratropical transitions, and dissipations during the season.
By convention, meteorologists use one time zone when issuing forecasts and making observations: Coordinated Universal Time (UTC), and also use the 24-hour clock (where 00:00 = midnight UTC). [12] The National Hurricane Center uses both UTC and the time zone where the center of the tropical cyclone is currently located. The time zones utilized (east to west) prior to 2020 were: Atlantic, Eastern, and Central. [13] In this timeline, all information is listed by UTC first with the respective regional time included in parentheses. Additionally, figures for maximum sustained winds and position estimates are rounded to the nearest 5 units ( knots, miles, or kilometers), following the convention used in the National Hurricane Center's products. Direct wind observations are rounded to the nearest whole number. Atmospheric pressures are listed to the nearest millibar and nearest hundredth of an inch of mercury.
Timeline
May
- May 19

- 0600 UTC (2:00 a.m. EDT) – A tropical depression develops from an area of low pressure offshore the North Carolina–South Carolina border. [14]
- 1200 UTC (8:00 a.m. EDT) – The tropical depression intensifies into Tropical Storm Alberto. [14]
- May 20
- 0000 UTC (8:00 p.m. EDT May 19) – Tropical Storm Alberto attains its peak intensity with winds of 60 mph (95 km/h) and a minimum barometric pressure of 995 mbar ( hPa; 29.38 inHg). [14]
- May 22
- 1200 UTC (8:00 a.m. EDT) – Tropical Storm Alberto degenerates into a non- convective remnant area of low pressure a few hundred miles north of Bermuda. [14]
- May 26
- 0000 UTC (8:00 p.m. EDT May 25) – Subtropical Storm Beryl develops from an area of low pressure roughly 335 mi (540 km) east of Jacksonville, Florida. [15]
- May 27

- 1800 UTC (2:00 p.m. EDT) – Subtropical Storm Beryl transitions into a tropical storm. [15]
- 2300 UTC (7:00 p.m. EDT) – Tropical Storm Beryl attains its peak intensity with winds of 70 mph (110 km/h) and a minimum barometric pressure of 992 mbar (hPa; 29.29 inHg). [15]
- May 28
- 0410 UTC (12:10 a.m. EDT) – Tropical Storm Beryl makes landfall near Jacksonville Beach, Florida, with winds of 65 mph (100 km/h). [15]
- 1200 UTC (8:00 a.m. EDT) – Tropical Storm Beryl weakens to a tropical depression. [15]
- May 30
- 0600 UTC (2:00 a.m. EDT) – Tropical Depression Beryl regains tropical storm intensity roughly 190 mi (305 km) southwest of Wilmington, North Carolina. [15]
- 1800 UTC (2:00 p.m. EDT) – Tropical Depression Beryl degenerates into a non-convective remnant area of low pressure near the coast of North Carolina. [15]
June
- June 1
- The 2012 Atlantic hurricane season officially begins. [2]
- June 18
- 1800 UTC (2:00 p.m. AST) – A subtropical storm develops from an area of low pressure roughly 450 mi (720 km) north-northeast of Bermuda. [16]
- June 19
- 1200 UTC (8:00 a.m. AST) – The subtropical storm transitions into Tropical Storm Chris. [16]
- June 21

- 0600 UTC (2:00 a.m. AST) – Tropical Storm Chris intensifies into a Category 1 hurricane on the Saffir–Simpson hurricane wind scale, becoming the first of the 2012 season. [16]
- 1200 UTC (8:00 a.m. AST) – Hurricane Chris attains its peak intensity with winds of 85 mph (140 km/h) and a minimum barometric pressure of 974 mbar (hPa; 28.76 inHg) roughly 635 mi (1,020 km) southeast of Cape Race. [16]
- June 22
- 0000 UTC (8:00 p.m. AST June 21) – Hurricane Chris weakens to a tropical storm. [16]
- 1200 UTC (8:00 a.m. AST) – Tropical Storm Chris transitions into an extratropical cyclone roughly 385 mi (620 km) east-southeast of Cape Race. [16]
- June 23
- 1200 UTC (8:00 a.m. EDT) – Tropical Storm Debby develops from an area of low pressure roughly 290 mi (470 km) south-southeast of the mouth of the Mississippi River. [17]
- June 24
- 1800 UTC (2:00 p.m. EDT) – Tropical Storm Debby attains maximum sustained winds of 65 mph (100 km/h). [17]
- June 25
- 0000 UTC (8:00 p.m. EDT June 24) – Tropical Storm Debby attains its peak intensity with a minimum barometric pressure of 990 mbar (hPa; 29.23 inHg). [17]
- June 26

- 2100 UTC (5:00 p.m. EDT) – Tropical Storm Debby makes landfall near Steinhatchee, Florida, with winds of 40 mph (65 km/h). [17]
- June 27
- 0000 UTC (8:00 p.m. EDT June 26) – Tropical Storm Debby weakens to a tropical depression roughly 35 mi (55 km) southwest of Gainesville, Florida. [17]
- 1800 UTC (2:00 p.m. EDT) – Tropical Storm Debby dissipates offshore the eastern coast of Florida. [17]
July
- No tropical cyclones form in the Atlantic Ocean during the month of July.
August
- August 1
- 1200 UTC (8:00 a.m. AST) – Tropical Depression Five develops from an area of low pressure roughly 875 mi (1,410 km) east of the Windward Islands. [18]
- August 2
- 1200 UTC (8:00 a.m. AST) – Tropical Depression Five intensifies into Tropical Storm Ernesto. [18]
- August 3

- 1200–1800 UTC (8:00 a.m. – 2:00 p.m. AST) – Tropical Storm Ernesto crosses the Windward Islands into the eastern Caribbean Sea. [18]
- 1800 UTC (2:00 p.m. AST) – Tropical Depression Six develops from an area of low pressure roughly 150 mi (240 km) south-southwest of the southernmost Cape Verde Islands. [19]
- August 4
- 0600 UTC (2:00 a.m. AST) – Tropical Depression Six intensifies into Tropical Storm Florence roughly 290 mi (470 km) west of the southernmost Cape Verde Islands. [19]
- August 5
- 0000 UTC (8:00 p.m. AST August 4) – Tropical Storm Florence attains its peak intensity with winds of 60 mph (95 km/h) and a minimum barometric pressure of 1002 mbar (hPa; 29.59 inHg). [19]
- August 6
- 0600 UTC (2:00 a.m. AST) – Tropical Storm Florence weakens to a tropical depression. [19]
- 1200 UTC (8:00 a.m. AST) – Tropical Depression Florence degenerates into a non-convective remnant area of low pressure roughly midway between the Cape Verde Islands and the Lesser Antilles. [19]
- August 7

- 1200 UTC (8:00 a.m. EDT) – Tropical Storm Ernesto intensifies into a Category 1 hurricane roughly 260 mi (420 km) east of Chetumal, Mexico. [18]
- August 8
- 0100 UTC (8:00 p.m. CDT August 7) – Hurricane Ernesto makes its first landfall on Cayo Norte in Banco Chinchorro, Mexico, with winds of 90 mph (150 km/h). [18]
- 0315 UTC (10:15 p.m. CDT August 7) – Hurricane Ernesto intensifies into a Category 2 hurricane, attains its peak intensity with winds of 100 mph (160 km/h) and a minimum barometric pressure of 973 mbar (hPa; 28.73 inHg), and simultaneously makes its second landfall near Majaual, Mexico. [18]
- 1200 UTC (7:00 a.m. CDT) – Hurricane Ernesto weakens to a tropical storm. [18]
- 1800–0000 UTC (1:00–7:00 p.m. CDT) – Tropical Storm Ernesto emerges into the Bay of Campeche. [18]
- August 9
- 1615 UTC (11:15 a.m. CDT) – Tropical Storm Ernesto makes its third and final landfall roughly 10 mi (15 km) northwest of Coatzacoalcos, Mexico, with winds of 65 mph (100 km/h). [18]
- 1800 UTC (2:00 p.m. AST) – Tropical Depression Seven develops from an area of low pressure roughly midway between the Cape Verde Islands and the Lesser Antilles. [20]
- August 10
- 0600 UTC (1:00 a.m. CDT) – Tropical Storm Ernesto weakens to a tropical depression. [18]
- 1200 UTC (7:00 a.m. CDT) – Tropical Depression Ernesto dissipates over the mountainous terrain of Mexico. [18]

- August 11
- 1200 UTC (8:00 a.m. AST) – Tropical Depression Seven degenerates into a tropical wave east of the Lesser Antilles. [20]
- August 15
- 1200 UTC (8:00 a.m. AST) – Tropical Depression Eight develops from an area of low pressure roughly 690 mi (1,110 km) southeast of Bermuda. [21]
- August 16
- 0000 UTC (8:00 p.m. AST August 15) – Tropical Depression Eight intensifies into Tropical Storm Gordon. [21]
- August 17
- 1200 UTC (7:00 a.m. CDT) – The remnants of Tropical Depression Seven regenerate into a tropical depression roughly 230 mi (370 km) southeast of Tampico, Mexico. [20]
- 1800 UTC (1:00 p.m. CDT) – Tropical Depression Seven intensifies into Tropical Storm Helene and simultaneously attains its peak intensity with winds of 45 mph (75 km/h) and a minimum barometric pressure of 1004 mbar (hPa; 29.65 inHg). [20]
.jpg)
- August 18
- 0600 UTC (1:00 a.m. CDT) – Tropical Storm Helene weakens to a tropical depression. [20]
- 0600 UTC (2:00 a.m. AST) – Tropical Storm Gordon intensifies into a Category 1 hurricane roughly 575 mi (925 km) west-southwest of the Azores. [21]
- 1200 UTC (7:00 a.m. CDT) – Tropical Depression Helene makes landfall near Tampico, Mexico, with winds of 35 mph (55 km/h). [20]
- August 19
- 0000 UTC (7:00 p.m. CDT August 18) – Tropical Depression Helene degenerates into a non-convective remnant area of low pressure over the mountainous terrain of Mexico. [20]
- 0000 UTC (8:00 p.m. AST August 18) – Hurricane Gordon attains its peak intensity with winds of 110 mph (175 km/h) and a minimum barometric pressure of 965 mbar (hPa; 28.49 inHg). [21]
- August 20
- 0530 UTC (1:30 a.m. AST) – Hurricane Gordon makes landfall on Santa Maria Island, Azores, with winds of 75 mph (120 km/h). [21]
- 1200 UTC (8:00 a.m. AST) – Hurricane Gordon weakens to a tropical storm. [21]
- 1800 UTC (2:00 p.m. AST) – Tropical Storm Gordon degenerates into a non-convective remnant area of low pressure northeast of the Azores. [21]
- August 21
- 0600 UTC (2:00 a.m. AST) – Tropical Depression Nine develops from an area of low pressure roughly 720 mi (1,160 km) east of the Lesser Antilles. [22]
- 1800 UTC (2:00 p.m. AST) – Tropical Depression Nine intensifies into Tropical Storm Isaac roughly 520 mi (840 km) east of the Lesser Antilles. [22]

- August 22
- 0600 UTC (2:00 a.m. AST) – Tropical Depression Ten develops from an area of low pressure roughly 690 mi (1,110 km) west-southwest of the Cape Verde Islands. [23]
- 1800–0000 UTC August 23 (2:00–8:00 p.m. AST) – Tropical Storm Isaac crosses the Windward Islands into the eastern Caribbean Sea. [22]
- August 23
- 1200 UTC (8:00 a.m. AST) – Tropical Depression Ten intensifies into Tropical Storm Joyce roughly 1,210 mi (1,950 km) west of the Cape Verde Islands. [23]
- 1800 UTC (2:00 p.m. AST) – Tropical Storm Joyce attains its peak intensity with winds of 40 mph (65 km/h) and a minimum barometric pressure of 1006 mbar (hPa; 29.71 inHg). [23]
- August 24
- 0000 UTC (8:00 p.m. AST August 23) – Tropical Storm Joyce weakens to a tropical depression. [23]
- 1200 UTC (8:00 a.m. AST) – Tropical Depression Joyce degenerates into a non-convective remnant area of low pressure. [23]
- August 25
- 0600 UTC (2:00 a.m. AST) – Tropical Storm Isaac makes its first landfall near Jacmel, Haiti, with winds of 65 mph (100 km/h). [22]
- 1500 UTC (11:00 a.m. EDT) – Tropical Storm Isaac makes its second landfall near Cajobabo, Guantánamo, Cuba, with winds of 60 mph (95 km/h). [22]
- August 27

- 0000–0600 UTC (8:00 p.m. August 26–2:00 a.m. AST) – Tropical Storm Isaac crosses the Straits of Florida into the Gulf of Mexico. [22]
- August 28
- 1200 UTC (7:00 a.m. CDT) – Tropical Storm Isaac intensifies into a Category 1 hurricane roughly 90 mi (145 km) southeast of the mouth of the Mississippi River. [22]
- 1800 UTC (2:00 p.m. AST) – Tropical Depression Eleven develops from an area of low pressure roughly 1,290 mi (2,080 km) southwest of the western Azores. [24]
- August 29
- 0000 UTC (7:00 p.m. CDT August 28) – Hurricane Isaac makes its third landfall at Southwest Pass at the mouth of the Mississippi River, with winds of 80 mph (130 km/h). [22]
- 0000 UTC (8:00 p.m. AST August 28) – Tropical Depression Eleven intensifies into Tropical Storm Kirk. [24]
- 0300 UTC (10:00 a.m. CDT) – Hurricane Isaac attains its peak intensity with winds of 80 mph (130 km/h) and a minimum barometric pressure of 965 mbar (hPa; 28.5 inHg). [22]
- 0800 UTC (3:00 a.m. CDT) – Hurricane Isaac makes its fourth and final landfall near Port Fourchon, Louisiana, with winds of 80 mph (130 km/h). [22]
- 1800 UTC (1:00 p.m. CDT) – Hurricane Isaac weakens to a tropical storm roughly 40 mi (65 km) west-southwest of New Orleans, Louisiana. [22]
- August 30

- 0000 UTC (8:00 p.m. AST August 29) – Tropical Depression Twelve develops from an area of low pressure roughly 1,495 mi (2,405 km) east-southeast of the northern Leeward Islands. [25]
- 1200 UTC (8:00 a.m. AST) – Tropical Storm Kirk intensifies into a Category 1 hurricane. [24]
- 1200 UTC (8:00 a.m. EDT) – Tropical Depression Twelve intensifies into Tropical Storm Leslie. [25]
- August 31
- 0000 UTC (7:00 p.m. CDT August 30) – Tropical Storm Isaac weakens to a tropical depression over southern Arkansas. [22]
- 0600 UTC (2:00 a.m. AST) – Hurricane Kirk intensifies into a Category 2 hurricane and simultaneously attains its peak intensity with winds of 105 mph (165 km/h) and a minimum barometric pressure of 970 mbar (hPa; 28.64 inHg). [24]
- 1800 UTC (2:00 p.m. AST) – Hurricane Kirk weakens to a Category 1 hurricane. [24]
September
- September 1
- 1200 UTC (7:00 a.m. CDT) – Tropical Depression Isaac dissipates roughly 65 mi (105 km) west-southwest of Jefferson City, Missouri. [22]
- 1200 UTC (8:00 a.m. AST) – Hurricane Kirk weakens to a tropical storm. [24]
- September 3
- 0000 UTC (8:00 p.m. AST September 2) – Tropical Storm Kirk transitions into an extratropical cyclone roughly 1,035 mi (1,665 km) north of the Azores. [24]
- 0600 UTC (2:00 a.m. AST) – Tropical Depression Thirteen develops from an area of low pressure. [26]
- September 4
- 0600 UTC (2:00 a.m. AST) – Tropical Depression Thirteen intensifies into Tropical Storm Michael roughly 1,240 mi (1,995 km) southwest of the Azores. [26]
- September 5
- 0600 UTC (2:00 a.m. AST) – Tropical Storm Leslie intensifies into a Category 1 hurricane. [25]
- 1200 UTC (8:00 a.m. AST) – Hurricane Leslie attains maximum sustained winds of 80 mph (130 km/h) roughly 485 mi (780 km) south-southeast of Bermuda. [25]
- 1800 UTC (2:00 p.m. AST) – Tropical Storm Michael intensifies into a Category 1 hurricane. [26]
- September 6

- 0600 UTC (2:00 a.m. AST) – Hurricane Michael intensifies into a Category 2 hurricane. [26]
- 1200 UTC (8:00 a.m. AST) – Hurricane Michael intensifies into a Category 3 hurricane, the first major hurricane of the season, and simultaneously attains its peak intensity with winds of 115 mph (185 km/h) and a minimum barometric pressure of 964 mbar (hPa; 28.47 inHg). [26]
- 1800 UTC (2:00 p.m. AST) – Hurricane Michael weakens to a Category 2 hurricane. [26]
- September 7
- 1200 UTC (8:00 a.m. AST) – Hurricane Leslie weakens to a tropical storm. [25]
- September 8
- 0000 UTC (8:00 p.m. AST September 7) – Hurricane Michael weakens to a Category 1 hurricane. [26]
- 1200 UTC (8:00 a.m. AST) – Hurricane Michael re-intensifies into a Category 2 hurricane. [26]
- September 9
- 1800 UTC (2:00 p.m. AST) – Hurricane Michael weakens to a Category 1 for a second time. [26]
- September 10
- 1200 UTC (8:00 a.m. AST) – Tropical Storm Leslie re-intensifies into a Category 1 hurricane. [25]
- 1200 UTC (8:00 a.m. AST) – Tropical Depression Fourteen develops from an area of low pressure roughly 890 mi (1,430 km) west of the Cape Verde Islands. [27]
- September 11

- 0000 UTC (8:00 p.m. AST September 10) – Hurricane Michael weakens to a tropical storm. [26]
- 0600 UTC (2:00 a.m. AST) – Hurricane Leslie attains its peak intensity with a minimum barometric pressure of 968 mbar (hPa; 28.58 inHg). [25]
- 0900 UTC (5:00 a.m. AST) – Hurricane Leslie transitions into an extratropical cyclone roughly 90 mi (145 km) southwest of St. Lawrence, Newfoundland. [25]
- 1800 UTC (2:00 p.m. AST) – Tropical Storm Michael degenerates into a non-convective remnant area of low pressure roughly 1150 mi (1850 km) northeast of Bermuda. [26]
- September 12
- 0000 UTC (8:00 p.m. AST September 11) – Tropical Depression Fourteen intensifies into Tropical Storm Nadine. [27]
- September 14
- 1800 UTC (2:00 p.m. AST) – Tropical Storm Nadine intensifies into a Category 1 hurricane. [27]
- September 17
- 0000 UTC (8:00 p.m. AST September 16) – Hurricane Nadine weakens to a tropical storm. [27]
- September 21
- 1800 UTC (2:00 p.m. AST) – Tropical Storm Nadine degenerates into a non-tropical area of low pressure roughly 260 mi (420 km) south-southwest of Santa Maria Island. [27]
- September 23
- 0000 UTC (8:00 p.m. AST September 22) – The remnants of Tropical Storm Nadine regenerate into a tropical storm south of the Azores. [27]
- September 28
- 1200 UTC (8:00 a.m. AST) – Tropical Storm Nadine intensifies into a Category 1 hurricane for a second time. [27]
- September 30

- 1200 UTC (8:00 a.m. AST) – Hurricane Nadine attains its peak intensity with winds of 90 mph (150 km/h) and a minimum barometric pressure of 978 mbar (hPa; 28.88 inHg) roughly 420 mi (675 km) west-southwest of Flores Island, Azores. [27]
October
- October 1
- 1200 UTC (8:00 a.m. AST) – Hurricane Nadine weakens to a tropical storm. [27]
- October 3
- 0600 UTC (2:00 a.m. AST) – Tropical Depression Fifteen develops from an area of low pressure roughly 1,035 mi (1,665 km) west of the Cape Verde Islands. [28]
- 1800 UTC (2:00 p.m. AST) – Tropical Depression Fifteen intensifies into Tropical Storm Oscar. [28]
- October 4

- 0000 UTC (8:00 p.m. AST October 3) – Tropical Storm Nadine degenerates into a non-convective remnant area of low pressure roughly 195 mi (315 km) southwest of the central Azores. [27]
- October 5
- 0600 UTC (2:00 a.m. AST) – Tropical Storm Oscar attains its peak intensity with winds of 50 mph (85 km/h) and a minimum barometric pressure of 994 mbar (hPa; 29.35 inHg). [28]
- 1800 UTC (2:00 p.m. AST) – Tropical Storm Oscar dissipates over the central Atlantic Ocean. [28]
- October 11
- 0000 UTC (8:00 p.m. EDT October 10) – Tropical Depression Sixteen develops from an area of low pressure. [29]
- 0600 UTC (2:00 a.m. EDT) – Tropical Depression Sixteen intensifies into Tropical Storm Patty roughly 175 mi (280 km) east-northeast of San Salvador, Bahamas. [29]
- October 12
- 0000 UTC (8:00 p.m. EDT October 11) – Tropical Storm Patty attains its peak intensity with winds of 45 mph (75 km/h) and a minimum barometric pressure of 1005 mbar (hPa; 29.68 inHg). [29]
- 1800 UTC (2:00 p.m. AST) – Tropical Storm Rafael develops from an area of low pressure roughly 230 mi (370 km) south-southeast of St. Croix, U.S. Virgin Islands. [30]
- October 13
- 0600 UTC (2:00 a.m. EDT) – Tropical Storm Patty weakens to a tropical depression. [29]
- 1200 UTC (8:00 a.m. EDT) – Tropical Depression Patty dissipates northeast of the Bahamas. [29]
- October 14
- 0000–0600 UTC (8:00 p.m. October 13–2:00 a.m. AST) – Tropical Storm Rafael crosses the Leeward Islands into the western Atlantic Ocean. [30]
- October 15
- 0600 UTC (2:00 a.m. AST) – Tropical Storm Rafael intensifies into a Category 1 hurricane roughly 750 mi (1,210 km) south of Bermuda. [30]
- October 16

- 1200 UTC (8:00 a.m. AST) – Hurricane Rafael attains its peak intensity with winds of 90 mph (150 km/h) and a minimum barometric pressure of 969 mbar (hPa; 28.61 inHg) roughly 345 mi (555 km) south of Bermuda. [30]
- October 17
- 1800 UTC (2:00 p.m. AST) – Hurricane Rafael transitions into an extratropical cyclone several hundred miles southeast of Nova Scotia. [30]
- October 22
- 1200 UTC (8:00 a.m. EDT) – Tropical Depression Eighteen develops from an area of low pressure roughly 350 mi (560 km) south-southwest of Kingston, Jamaica. [5]
- 1800 UTC (2:00 p.m. EDT) – Tropical Depression Eighteen intensifies into Tropical Storm Sandy. [5]
- 1800 UTC (2:00 p.m. AST) – Tropical Depression Nineteen develops from an area of low pressure roughly 715 mi (1,150 km) east-northeast of the northern Leeward Islands. [4]
- October 24

- 0000 UTC (8:00 p.m. AST October 23) – Tropical Depression Nineteen intensifies into Tropical Storm Tony. [4]
- 1200 UTC (8:00 a.m. EDT) – Tropical Storm Sandy intensifies into a Category 1 hurricane roughly 90 mi (140 km) south of Kingston, Jamaica. [5]
- 1200 UTC (8:00 a.m. AST) – Tropical Storm Tony attains its peak intensity with winds of 50 mph (85 km/h) and a minimum barometric pressure of 1000 mbar (hPa; 29.53 inHg) roughly midway between the northern Leeward Islands and the Azores. [4]
- 1900 UTC (3:00 p.m. EDT) – Hurricane Sandy makes its first landfall near Bull Bay, Jamaica, with winds of 85 mph (140 km/h). [5]
- October 25
- 0000 UTC (8:00 p.m. EDT October 24) – Hurricane Sandy intensifies into a Category 2 hurricane. [5]
- 0525 UTC (1:25 a.m. EDT) – Hurricane Sandy intensifies into a Category 3 hurricane and simultaneously makes its second landfall roughly 10 mi (15 km) west of Santiago de Cuba, Cuba, with winds of 115 mph (185 km/h). [5]
- 0900–1200 UTC (5:00–8:00 a.m. EDT) – Hurricane Sandy crosses Cuba into the Bahamas. [5]
- 1800 UTC (2:00 p.m. AST) – Tropical Storm Tony transitions into an extratropical cyclone. [4]
- 0900 UTC (5:00 a.m. EDT) – Hurricane Sandy weakens to a Category 2 hurricane. [5]
- October 26
- 0000 UTC (8:00 p.m. EDT October 25) – Hurricane Sandy weakens to a Category 1 hurricane. [5]
- October 27

- 0000 UTC (8:00 p.m. EDT October 26) – Hurricane Sandy weakens to a tropical storm. [5]
- 1200 UTC (8:00 a.m. EDT) – Tropical Storm Sandy re-intensifies into a Category 1 hurricane roughly 145 mi (235 km) north-northeast of the Abaco Islands. [5]
- October 29
- 1200 UTC (8:00 a.m. EDT) – Hurricane Sandy re-intensifies into a Category 2 hurricane roughly 255 mi (410 km) southeast of Atlantic City, New Jersey. [5]
- 1800 UTC (2:00 p.m. EDT) – Hurricane Sandy weakens to a Category 1 hurricane for a second time and simultaneously attains its peak intensity with a minimum barometric pressure of 940 mbar (hPa; 27.76 inHg). [5]
- 2100 UTC (5:00 p.m. EDT) – Hurricane Sandy transitions into an extratropical cyclone roughly 50 mi (80 km) southeast of Atlantic City, New Jersey. [5]
- 2330 UTC (7:30 p.m. EDT) – Hurricane Sandy made landfall as a hybrid subtropical storm near Brigantine, New Jersey, with winds of 80 mph (130 km/h). [5] thus being given the name "Superstorm Sandy."
November
- No tropical cyclones form in the Atlantic Ocean during the month of November.
- November 30
- The 2012 Atlantic hurricane season officially ends. [2]
See also
Notes
- ^ An average season, as defined by the National Oceanic and Atmospheric Administration, has twelve tropical storms, six hurricanes and two major hurricanes. [6]
- ^ Hurricanes reaching Category 3 (111 miles per hour (179 km/h)) and higher on the 5-level Saffir–Simpson wind speed scale are considered major hurricanes. [7]
References
- ^ Brian McNoldy (November 28, 2012). "Third most active hurricane season on record (tie) ends Friday". The Washington Post. Retrieved May 4, 2013.
- ^ a b c Dorst, Neal (June 1, 2018). "Hurricane Season Information". Frequently Asked Questions About Hurricanes. Miami, Florida: NOAA Atlantic Oceanographic and Meteorological Laboratory. Retrieved June 29, 2020.
- ^ Tropical Cyclones - May 2020 (Report). National Oceanic and Atmospheric Administration National Centers for Environmental Information. Retrieved September 25, 2021.
- ^ a b c d e Richard J. Pasch; David P. Roberts (January 24, 2013). Tropical Cyclone Report: Tropical Storm Tony (PDF) (Report). National Hurricane Center. pp. 1–2, 4. Retrieved May 3, 2013.
- ^ a b c d e f g h i j k l m n o p Eric S. Blake; et al. (February 12, 2013). Tropical Cyclone Report: Hurricane Sandy (PDF) (Report). National Hurricane Center. pp. 1–4, 24–25. Retrieved May 3, 2013.
- ^ Climate Prediction Center Internet Team. "Background Information: The North Atlantic Hurricane Season". Climate Prediction Center. Retrieved September 25, 2021.
- ^ "Saffir-Simpson Hurricane Wind Scale". Miami, Florida: National Hurricane Center. Retrieved June 29, 2020.
- ^ Michael S. Lee (December 4, 2012). "Active 2012 hurricane season had local impact". The Commercial. Retrieved July 9, 2013.
- ^ "Billion-Dollar Weather/Climate Disasters". National Oceanic and Atmospheric Administration. Archived from the original on 2014-07-09. Retrieved June 13, 2013.
- ^ Tom McCarthy (April 12, 2013). "'Sandy' to be retired as hurricane name by World Meteorological Organization". The Guardian. Retrieved July 9, 2013.
- ^ "Report: Sandy was USA's 2nd-costliest hurricane". USA Today. February 12, 2013. Retrieved July 10, 2013.
- ^ "Understanding the Date/Time Stamps". Miami, Florida: NOAA National Hurricane Center. Retrieved July 10, 2020.
- ^ "Update on National Hurricane Center Products and Services for 2020" (PDF). Miami, Florida: National Hurricane Center. April 20, 2020. Retrieved May 17, 2020.
- ^ a b c d Richard J. Pasch (December 7, 2012). Tropical Cyclone Report: Tropical Storm Alberto (PDF) (Report). National Hurricane Center. pp. 1, 4. Retrieved May 4, 2013.
- ^ a b c d e f g John L. Beven II (December 12, 2012). Tropical Cyclone Report: Tropical Storm Beryl (PDF) (Report). National Hurricane Center. pp. 1–2, 6. Retrieved May 4, 2013.
- ^ a b c d e f Stacy R. Stewart (January 22, 2013). Tropical Cyclone Report: Hurricane Chris (PDF) (Report). National Hurricane Center. pp. 1–2, 5. Retrieved May 4, 2013.
- ^ a b c d e f Todd B. Kimberlain (January 7, 2013). Tropical Cyclone Report: Tropical Storm Debby (PDF) (Report). National Hurricane Center. pp. 1–2, 8. Retrieved May 4, 2013.
- ^ a b c d e f g h i j k Daniel P. Brown (February 20, 2013). Tropical Cyclone Report: Hurricane Ernesto (PDF) (Report). National Hurricane Center. pp. 1–2, 6. Retrieved May 4, 2013.
- ^ a b c d e John P. Cangialosi (October 14, 2012). Tropical Cyclone Report: Tropical Storm Florence (PDF) (Report). National Hurricane Center. pp. 1–2, 4. Retrieved May 4, 2013.
- ^ a b c d e f g Lixion A. Avila (December 13, 2012). Tropical Cyclone Report: Tropical Storm Helene (PDF) (Report). National Hurricane Center. pp. 1, 3. Retrieved May 4, 2013.
- ^ a b c d e f g Lixion A. Avila (January 16, 2013). Tropical Cyclone Report: Hurricane Gordon (PDF) (Report). National Hurricane Center. pp. 1–2, 4. Retrieved May 4, 2013.
- ^ a b c d e f g h i j k l m Robbie Berg (January 28, 2013). Tropical Cyclone Report: Hurricane Isaac (PDF) (Report). National Hurricane Center. pp. 1–2, 14–15. Retrieved May 4, 2013.
- ^ a b c d e Richard J. Pasch; Christopher W. Landsea (January 8, 2013). Tropical Cyclone Report: Tropical Storm Joyce (PDF) (Report). National Hurricane Center. pp. 1–3. Retrieved May 4, 2013.
- ^ a b c d e f g John L. Beven II (December 7, 2012). Tropical Cyclone Report: Hurricane Kirk (PDF) (Report). National Hurricane Center. pp. 1, 4. Retrieved May 4, 2013.
- ^ a b c d e f g h Stacy R. Stewart (January 27, 2013). Tropical Cyclone Report: Hurricane Leslie (PDF) (Report). National Hurricane Center. pp. 1–3, 6–7. Retrieved May 4, 2013.
- ^ a b c d e f g h i j k Todd B. Kimberlain; David A. Zelinsky (December 4, 2012). Tropical Cyclone Report: Hurricane Michael (PDF) (Report). National Hurricane Center. pp. 1–2, 4–5. Retrieved May 4, 2013.
- ^ a b c d e f g h i j Daniel P. Brown (January 8, 2013). Tropical Cyclone Report: Hurricane Nadine (PDF) (Report). National Hurricane Center. pp. 1–3, 6–8. Retrieved May 3, 2013.
- ^ a b c d John P. Cangialosi (November 24, 2012). Tropical Cyclone Report: Tropical Storm Oscar (PDF) (Report). National Hurricane Center. pp. 1, 3. Retrieved May 4, 2013.
- ^ a b c d e Robbie Berg (January 14, 2013). Tropical Cyclone Report: Tropical Storm Patty (PDF) (Report). National Hurricane Center. pp. 1–2, 4. Retrieved May 4, 2013.
- ^ a b c d e Lixion A. Avila (November 24, 2012). Tropical Cyclone Report: Hurricane Rafael (PDF) (Report). National Hurricane Center. pp. 1–2, 4–5. Retrieved May 4, 2013.