| This is an archive of past discussions. Do not edit the contents of this page. If you wish to start a new discussion or revive an old one, please do so on the current talk page. |
| Archive 65 | ← | Archive 68 | Archive 69 | Archive 70 | Archive 71 | Archive 72 | → | Archive 75 |
Trends in local vs global inequality
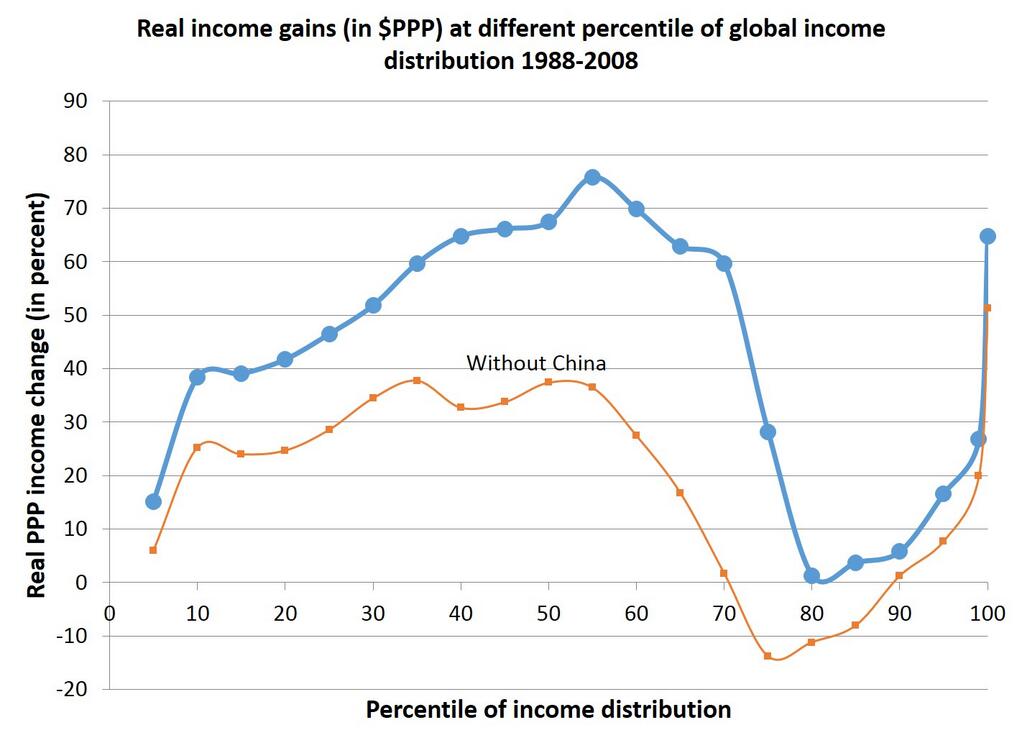
I propose that we add a sentence summarizing the graphs in [1], [2], [3], [4], [5], [6], and [7], contrasting those with the situation depicted at [8] and [9]. EllenCT ( talk) 20:00, 8 April 2015 (UTC)
![[9]](https://therationalpessimist.files.wordpress.com/2013/12/winners-and-losers-jpeg.jpg)
- Nope, no need for this in this article, take this to a sub-article, to an article specific to inequality. But there is no need for every thing here. Please no WP:SOAPBOX.-- RightCowLeftCoast ( talk) 21:07, 8 April 2015 (UTC)
- Just cause it can be verified doesn't mean it should be given weight, especially in this article, which is an overview article of the entire country.--
RightCowLeftCoast (
talk) 21:07, 8 April 2015 (UTC)
- The trends are already covered in sub-articles, where for very good and well-sourced reasons, they are considered extremely important. What is the basis for your claim that there is "no need" to summarize them here?
EllenCT (
talk) 23:20, 8 April 2015 (UTC)
- IMHO,
WP:UNDUE. I know that it is likely that EllenCT disagrees with me on this view. However, there it is. Also, equality; see
Harrison Bergeron &
Animal Farm, even
The Cutie Map.--
RightCowLeftCoast (
talk) 23:31, 8 April 2015 (UTC)
- Complete equality would be dystopian, but large amounts of inequality would be worse. Therefore, the lines in [10] should never be allowed to become horizontal or vertical, and the question becomes their optimal slope. However, the change in the line's slope and characteristics should be summarized. The costs of adding a single sentence doing so to this article is far outweighed by the benefits of accurately summarizing the trends in the relative purchasing power of the middle class. I will see your MLP:FIM episode and raise you Matthew 25:40. EllenCT ( talk) 18:29, 9 April 2015 (UTC)
- Agreed. This is a high level (and very long) article. There are more appropriate places for the details.
Mattnad (
talk) 14:00, 9 April 2015 (UTC)
- No reasons have been stated that summarization of these statistics is either unnecessary or undue.
EllenCT (
talk) 18:29, 9 April 2015 (UTC)
- No reason has been stated that they are vital for a basic understanding of the country. The article already mentions inequality, so what more does this proposal add to that? You need to justify your request rather than us justifying our rejection. But that's difficult because you've proposed adding a sentence without actually proposing the sentence itself; if we had something concrete to work with then that would be easier. And I don't mean this as a slight against you but an advisory: People swooping in with a link saying "add something about this" often simply leave without caring because they're usually trolls. I'm not saying you're a troll like them, I'm saying what you're doing is as easy to dismiss as what they do, so having something more concrete to discuss would be extremely helpful. --
Golbez (
talk) 18:43, 9 April 2015 (UTC)
- We should characterize the period during the economic recovery when the lower 90% of income earners lost real income, and the rate at which the top 0.01% has been increasing at the expense of the 99.99%, which are relatively new phenomena. However, I am not sure whether it will be reasonable to also mention the 1%/99% split, because the curve is smooth enough that would probably be redundant. I will compose a concrete proposal in terms of trends in the relative purchasing power of the middle class soon. EllenCT ( talk) 19:25, 9 April 2015 (UTC)
- No reason has been stated that they are vital for a basic understanding of the country. The article already mentions inequality, so what more does this proposal add to that? You need to justify your request rather than us justifying our rejection. But that's difficult because you've proposed adding a sentence without actually proposing the sentence itself; if we had something concrete to work with then that would be easier. And I don't mean this as a slight against you but an advisory: People swooping in with a link saying "add something about this" often simply leave without caring because they're usually trolls. I'm not saying you're a troll like them, I'm saying what you're doing is as easy to dismiss as what they do, so having something more concrete to discuss would be extremely helpful. --
Golbez (
talk) 18:43, 9 April 2015 (UTC)
- No reasons have been stated that summarization of these statistics is either unnecessary or undue.
EllenCT (
talk) 18:29, 9 April 2015 (UTC)
- IMHO,
WP:UNDUE. I know that it is likely that EllenCT disagrees with me on this view. However, there it is. Also, equality; see
Harrison Bergeron &
Animal Farm, even
The Cutie Map.--
RightCowLeftCoast (
talk) 23:31, 8 April 2015 (UTC)
- The trends are already covered in sub-articles, where for very good and well-sourced reasons, they are considered extremely important. What is the basis for your claim that there is "no need" to summarize them here?
EllenCT (
talk) 23:20, 8 April 2015 (UTC)
![[10]](http://graphics8.nytimes.com/images/2011/01/28/business/economy/economix-28milanovic/economix-28milanovic-custom1.jpg)
How about "Low and middle incomes have fallen while high incomes have risen because wage increases have not been linked to productivity gains, and because of a lack of pay equity and an unemployment safety net at living wages;" citing Tcherneva (2015), followed by, "instead, incomes have diverged and inequalities have widened," citing Milanovic (2012). Please see also Milanovic's graph. EllenCT ( talk) 20:51, 9 April 2015 (UTC)
- Where are you suggesting this sentence be added, then? Looking at the Income, poverty, and wealth subsection, we already have a sentence stating that low and middle incomes have fallen, and that the top 1% have gotten most of the gains. I'm still not seeing what this sentence adds beyond what is already present. Or could this be simply remedied by adding a source to an existing sentence, with a minor tweak? -- Golbez ( talk) 21:14, 9 April 2015 (UTC)
- Even as someone who is frightened by the growing income inequality in America, this is no place to spout these ideas. It's WP:UNDUE and WP:SOAPBOX. The above sentence in Golbez's comment is satisfactory. PointsofNoReturn ( talk) 22:47, 9 April 2015 (UTC)
- The solution proposed by Golbez is a good one IMHO. A minor tweak to an existing sentence to accommodate the new source(s) would be a good way to avoid WP:UNDUE and WP:SOAPBOX issues. It would also be a good idea to bundle the sources together into one footnote.-- C.J. Griffin ( talk) 00:01, 10 April 2015 (UTC)
How about "...because wage increases have not been linked to productivity gains, and because of a lack of pay equity and a lack of an employment safety net at living wages; [1] instead, incomes have diverged and inequalities have widened. [2]
References
- ^ Tcherneva, Pavlina R. (April 2015). "When a rising tide sinks most boats: trends in US income inequality" (PDF). levyinstitute.org. Levy Economics Institute of Bard College. Retrieved 10 April 2015.
- ^ Milanovic, Branko (November 2012). "Global Income Inequality by the Numbers: in History and Now" (PDF). worldbank.org. The World Bank. Retrieved 10 April 2015.
We should also find the US version of Milanovic's graph comparing China to the world. That may be available from Saez (2013) and/or the Mother Jones infographic. EllenCT ( talk) 03:38, 10 April 2015 (UTC)
- Would a description of
the shrinking incomes of the
American middle class be better or worse than an international comparison?
EllenCT (
talk) 14:37, 11 April 2015 (UTC)
- The NYT source is by far the most mainstream least controversial source provided, albeit left leaning. Modification of an existing sentence, without making it any longer or shorter (not including reference(s)), would update the context, and can be bundled with the existing source per WP:CITEBUNDLE. Expansion would lead to WP:UNDUE.
- Also if this is allowed, perhaps the growth of the
total federal budget and growth of entitlement spending can be shoehorned somewhere. But IMHO such things belong in sub-articles and no need to add that here in any significant detail.--
RightCowLeftCoast (
talk) 04:36, 15 April 2015 (UTC)
- No need to shoehorn that rubbish into the article, as it is well known that the so-called "think tank" known as "
The Heritage Foundation" is funded by huge corporations and spews propaganda in support of a neoliberal agenda. Academic studies have exposed this:
[11]
[12] They have been caught in
lie after
lie.
Actual studies by experts on welfare and poverty contend that in fact the social welfare state has been in retreat since the advent of the neoliberal era (circa 1980) and has been largely replaced by a "
post-welfare punitive state."--
C.J. Griffin (
talk) 13:04, 15 April 2015 (UTC)
- "NeoLiberal" is a derogatory term, as shown at Talk:Conservatism. I am not saying that Heritage Foundation is not an opinionated source, however EllenCT is also providing opinionated sources. Please see WP:BIASED.
- If POVs from opinionated views that are left of the political spectrum are seen as valid, yet opinionated views from the right are not seen as valid, it leads to non-neutral content, thus leading us to question whether the article is in fact neutral as required by WP:WIAGA.
- One person's "rubbish" is another persons valid point. As we have seen in this discussion.
Entitlement spending as a percentage of the total federal budget and GDP has gone up, not down. Even non-conservative source CNN
verifies this.--
RightCowLeftCoast (
talk) 19:30, 15 April 2015 (UTC)
- Well, given this international comparison, what do you think total entitlement spending as a percent of GDP should be optimally? Isn't it highly sensitive to the age demographics of the population? EllenCT ( talk) 15:15, 23 April 2015 (UTC)
- No need to shoehorn that rubbish into the article, as it is well known that the so-called "think tank" known as "
The Heritage Foundation" is funded by huge corporations and spews propaganda in support of a neoliberal agenda. Academic studies have exposed this:
[11]
[12] They have been caught in
lie after
lie.
Actual studies by experts on welfare and poverty contend that in fact the social welfare state has been in retreat since the advent of the neoliberal era (circa 1980) and has been largely replaced by a "
post-welfare punitive state."--
C.J. Griffin (
talk) 13:04, 15 April 2015 (UTC)
How about, "...because wage increases have not been linked to productivity gains, and because of a lack of pay equity and a lack of an employment safety net at living wages; [1] instead, incomes have diverged and inequalities have widened. [2] [3]" EllenCT ( talk) 15:16, 23 April 2015 (UTC)
References
- ^ Tcherneva, Pavlina R. (April 2015). "When a rising tide sinks most boats: trends in US income inequality" (PDF). levyinstitute.org. Levy Economics Institute of Bard College. Retrieved 10 April 2015.
- ^ Casselman, Ben (September 22, 2014). "The American Middle Class Hasn't Gotten A Raise In 15 Years". FiveThirtyEightEconomics. Retrieved 23 April 2015.
- ^ Parlapiano, Alicia; Gebeloff, Robert; Carter, Shan (January 26, 2013). "The Shrinking American Middle Class". The Upshot. New York Times. Retrieved 23 April 2015.
- It can also be said that it is due to increased immigration, legal and illegal.
- My stance is that this
WP:SOAPBOX need not be in this article. There are other articles about this (their primary subject). Please add this content there, such as at the article
Income inequality in the United States.--
RightCowLeftCoast (
talk) 00:10, 24 April 2015 (UTC)
- There doesn't seem to be a more pressing issue facing American society. Even obesity, smoking, and conflict are dwarfed by its magnitude in years of productive (i.e. self-sustaining) life lost due to market failure. If you think my proposal is biased, which SOAPBOX implies, then how would you balance it?
EllenCT (
talk) 15:49, 24 April 2015 (UTC)
- It's a pressing issue for sure (not sure it's the most pressing, but that's a matter of opinion), but for me it's a matter of where we expand on it. This is a huge article already. So we can mention it's an issue, and have links to articles that expand in depth.
Mattnad (
talk) 17:45, 24 April 2015 (UTC)
- Those are opinions. Just cause an editor believes it is a "pressing issue" doesn't make it a "pressing issue". Why not just include a link in a hatnote (like a see also link) for an appropriate section, and leave it be. If someone is interested in reading on that subject, they can clock on it. If they aren't they don't.--
RightCowLeftCoast (
talk) 03:32, 25 April 2015 (UTC)
- Agree with RCLC. I'm not so sure "pressing issues" belong in a summary article. This article might benefit as a summary article by primarily treating issues which find their way into reliable scholarly sources published in academic journals or peer reviewed publishing houses -- rather than featuring items ripped from the headlines based on statistics which are then revised within ninety days. Such an editorial guideline might serve to slow the volatility of the page.
TheVirginiaHistorian (
talk) 09:43, 25 April 2015 (UTC)
- Is years of productive life lost an objective measure? I would rather proceed on the mainstream view that it is, and that it is the correct measure of issue magnitude when deciding the most appropriate statistics for national summary articles. Immigration is one of several influencing factors, but the tax structure, fiscal, and monetary policy, and the way they influence education outcomes, along with actual education outcomes, are larger influences on income inequality. Therefore, I also propose including sources including such comparisons of the causes and effects on both income inequality and education outcomes, along with mainstream concordant policy recommendations. EllenCT ( talk) 13:35, 25 April 2015 (UTC)
- Agree with RCLC. I'm not so sure "pressing issues" belong in a summary article. This article might benefit as a summary article by primarily treating issues which find their way into reliable scholarly sources published in academic journals or peer reviewed publishing houses -- rather than featuring items ripped from the headlines based on statistics which are then revised within ninety days. Such an editorial guideline might serve to slow the volatility of the page.
TheVirginiaHistorian (
talk) 09:43, 25 April 2015 (UTC)
- Those are opinions. Just cause an editor believes it is a "pressing issue" doesn't make it a "pressing issue". Why not just include a link in a hatnote (like a see also link) for an appropriate section, and leave it be. If someone is interested in reading on that subject, they can clock on it. If they aren't they don't.--
RightCowLeftCoast (
talk) 03:32, 25 April 2015 (UTC)
- It's a pressing issue for sure (not sure it's the most pressing, but that's a matter of opinion), but for me it's a matter of where we expand on it. This is a huge article already. So we can mention it's an issue, and have links to articles that expand in depth.
Mattnad (
talk) 17:45, 24 April 2015 (UTC)
- There doesn't seem to be a more pressing issue facing American society. Even obesity, smoking, and conflict are dwarfed by its magnitude in years of productive (i.e. self-sustaining) life lost due to market failure. If you think my proposal is biased, which SOAPBOX implies, then how would you balance it?
EllenCT (
talk) 15:49, 24 April 2015 (UTC)
@
EllenCT: please do not make
bold
changes to the article without consensus, while this topic is under discussion, it shows bad faith. There is no consensus to support the expansion which was done. Therefore, I have
reverted it. Please, do not start an
edit war by reverting my reversion.
Also I highly dispute
this removal of a reliable source. See
WP:BIASED. Just cause one editor sees the source as "right-wing" doesn't make it any more or less valid. Imagine if any editor came by and removed all sources they viewed as "left-wing" (or vice versa). Doing such things create non-neutral articles which would remove this article's GA status, as it would no longer meet
WP:WIAGA.
This attack on sources, especially sources that some editors view as "right-wing", does nothing but make Wikipedia in general "left-wing" by making other sources invalid, and thus flies in the face of the
pillar of neutrality. It shouldn't be done here, or elsewhere. Stop please.--
RightCowLeftCoast (
talk) 17:12, 25 April 2015 (UTC)
- Much of the material you deleted was either decided to be replaced by the recent RFC closure, or new sources supporting existing statements. I have replaced that, and revise my proposal to
re-insert the phrase, "Additionally, the lack of income increases commensurate with productivity, the
gender pay gap, and the erosion of
unemployment
safety net welfare at living wages have caused a rise [in the share of total annual income received by the top 1 percent....]"
EllenCT (
talk) 17:49, 25 April 2015 (UTC)
- RightCowLeftCoast facepalms.
- No, the RfC closed in Mid April does not include adding new content. The RfC said nothing about gender pay gap, or "erosion of unemployment safety net". The RfC is no excuse to shoehorn more of EllenCT's "pressing issues" into this article.
- This article is not meant to advance the agenda supported be EllenCT. This article is to give a summary view of the United States. The subjects EllenCT has been campaigning to include, are best handled in sub-articles whose scope is far more focused on those subjects than this article. Again, please stop.
- I kindly ask others to weight in on this, what I am beginning to see as civil POV pushing.--
RightCowLeftCoast (
talk) 18:51, 25 April 2015 (UTC)
- My agenda is to create an article which covers all of the issues above a certain level of importance, as objectively measured as possible. What you see as POV pushing is my attempt to clean up after you and your fellow travelers' overly abundant suggestions that income inequality increases instead of decreases economic growth, a discredited view with many adherents, just like homeopathy, scattered remnants of both which still tarnish the encyclopedia. EllenCT ( talk) 21:03, 25 April 2015 (UTC)
A summary of sub-articles can be included per WP:SUMMARY. But these should be carefully edited to avoid forcing a particular POV. - Cwobeel (talk) 20:19, 25 April 2015 (UTC)
Also, opinions should be attributed per WP:ATTRIBUTEPOV and not rendered in Wikipedia's voice. - Cwobeel (talk) 20:21, 25 April 2015 (UTC)
- I agree, and revise my proposal to include, "According to Pavlina Tcherneva at Bard College's Levy Economics Institute, the lack of income increases commensurate with productivity, the gender pay gap, and the erosion of unemployment safety net welfare at living wages have caused a rise [in the share of total annual income received by the top 1 percent....]" EllenCT ( talk) 21:03, 25 April 2015 (UTC)
Imbalance?
I don't see a discussion about imbalance in the "Income, poverty and wealth" section. Unless a discussion is started, the tag will be removed.- Cwobeel (talk) 21:24, 26 April 2015 (UTC)
- I suggest a discussion of the economic aspects of education would balance the new discussion of immigration.
EllenCT (
talk) 00:38, 27 April 2015 (UTC)
- The imbalance, is due to heavy insertion of content by EllenCT which lead to the ongoing discussion which is ongoing above. With all the content newly added by EllenCT, one sentence (which is referenced to a reliable source) added by myself is not "balanced". Unfortunately, the imbalance template does not have an area which links to a specific talk page section as discuss inline does.
- If we look at the content added to the section, primarily by EllenCT since this article was elevated to GA status, it has unbalanced a section which arguably was already skewed to begin with. Therefore, IMHO, the tag which Cwobeel removed, was appropriate.
- I have attempted to propose compromises to EllenCT to no avail it seems. Therefore, as EllenCT has continue to edit the section, I followed their lead by adding one single sentence recently. And now EllenCT is asking for balance? When previously, addition of content (many more characters than my insertion of one sentence with supporting reference) by EllenCT IMHO was one sided and caused the imbalance in the first place.--
RightCowLeftCoast (
talk) 17:59, 27 April 2015 (UTC)
- You have presented no evidence that immigration has had a greater impact on income inequality than the costs and benefits of education. It absolutely would balance the article to mention more substantial causes instead of less important causes that you favor. EllenCT ( talk) 02:46, 29 April 2015 (UTC)
I took a look side-by-side GA version and current version, and could not identify the imbalance you mention. Can you be more specific? here are the two versions. - Cwobeel (talk) 18:46, 27 April 2015 (UTC)
- GA version
Americans have the highest average household and employee income among OECD nations, and in 2007 had the second highest median household income. [1] [2] According to the Census Bureau real median household income was $50,502 in 2011, down from $51,144 in 2010. [3] The Global Food Security Index ranked the U.S. number one for food affordability and overall food security in March 2013. [4] Americans on average have over twice as much living space per dwelling and per person as European Union residents, and more than every EU nation. [5] For 2013 the United Nations Development Programme ranked the United States 5th among 187 countries in its Human Development Index and 28th in its inequality-adjusted HDI (IHDI). [6]
There has been a widening gap between productivity and median incomes since the 1970s. [7] While inflation-adjusted ("real") household income had been increasing almost every year from 1947 to 1999, it has since been flat and even decreased recently. [8] The rise in the share of total annual income received by the top 1 percent, which has more than doubled from 9 percent in 1976 to 20 percent in 2011, has had a significant impact on income inequality, [9] leaving the United States with one of the widest income distributions among OECD nations. [10] [11] [12] The post-recession income gains have been very uneven, with the top 1 percent capturing 95 percent of the income gains from 2009 to 2012. [13]
Wealth, like income and taxes, is highly concentrated; the richest 10% of the adult population possess 72% of the country's household wealth, while the bottom half claim only 2%. [14] Those earning in the top 10% paid 49.6% of all federal, state, and local taxes in 2014. [15] Growing income inequality and wealth concentration have resulted in affluent individuals, powerful business interests and other economic elites gaining increased influence over public policy. [16] [17] [18]
Since peaking in the second quarter of 2007, household wealth is down $14 trillion. [19] At the end of 2008, household debt amounted to $13.8 trillion. [20]
There were about 643,000 sheltered and unsheltered homeless persons in the U.S. in January 2009, with almost two-thirds staying in an emergency shelter or transitional housing program. In 2011 16.7 million children lived in food-insecure households, about 35% more than 2007 levels, though only 1.1% of U.S. children, or 845,000, saw reduced food intake or disrupted eating patterns at some point during the year, and most cases were not chronic. [21] According to a 2014 report by the Census Bureau, one in five young adults lives in poverty today, up from one in seven in 1980. [22]
- Current version
Americans have the highest average household and employee income among OECD nations, and in 2007 had the second highest median household income. [1] [2] According to the Census Bureau real median household income was $50,502 in 2011, down from $51,144 in 2010. [23] The Global Food Security Index ranked the U.S. number one for food affordability and overall food security in March 2013. [24] Americans on average have over twice as much living space per dwelling and per person as European Union residents, and more than every EU nation. [5] For 2013 the United Nations Development Programme ranked the United States 5th among 187 countries in its Human Development Index and 28th in its inequality-adjusted HDI (IHDI). [25] There has been a widening gap between productivity and median incomes since the 1970s. [26] While inflation-adjusted ("real") household income had been increasing almost every year from 1947 to 1999, it has since been flat and even decreased recently. [27] According to Congressional Research Service, during this same period, immigration to the United States increased, while the lower 90% of tax filers incomes became stagnant, and eventually decreasing since 2000. [28]
The rise in the share of total annual income received by the top 1 percent, which has more than doubled from 9 percent in 1976 to 20 percent in 2011, has had a significant impact on income inequality, [9] leaving the United States with one of the widest income distributions among OECD nations. [10] The post-recession income gains have been very uneven, with the top 1 percent capturing 95 percent of the income gains from 2009 to 2012. [29] According to an article published in Perspectives on Politics, growing income inequality and wealth concentration have resulted in affluent individuals, powerful business interests and other economic elites gaining increased influence over public policy. [30] disputed
Wealth, like income and taxes, is highly concentrated; the richest 10% of the adult population possess 72% of the country's household wealth, while the bottom half claim only 2%. [31] Between June 2007 and November 2008 the global recession led to falling asset prices around the world. Assets owned by Americans lost about a quarter of their value. [32] Since peaking in the second quarter of 2007, household wealth is down $14 trillion. [33] At the end of 2008, household debt amounted to $13.8 trillion. [34]
There were about 643,000 sheltered and unsheltered homeless persons in the U.S. in January 2009, with almost two-thirds staying in an emergency shelter or transitional housing program. In 2011 16.7 million children lived in food-insecure households, about 35% more than 2007 levels, though only 1.1% of U.S. children, or 845,000, saw reduced food intake or disrupted eating patterns at some point during the year, and most cases were not chronic. [35] According to a 2014 report by the Census Bureau, one in five young adults lives in poverty today, up from one in seven in 1980. [36]
| Sources |
|---|
| The following discussion has been closed. Please do not modify it. |
|
References
|
- "Since peaking in the second quarter of 2007, household wealth is down $14 trillion." should be "...was down $14 trillion but by 2015 had regained $14 trillion above 2006 levels."
[13] per
#No consensus to revert to out of date, inaccurate 2009 descriptions of 2008 recession (RFC) above. And again,
a discussion of the impact of education on income inequality, and vice-versa would serve to balance the new addition on immigration.
EllenCT (
talk) 03:37, 28 April 2015 (UTC)
- There has been three sentences added to the first paragraph, increasing the POV of class warfare, and one which increases the relationship of wage with immigrant population growth.
- Second paragraph has been widely edited by EllenCT to conform with the POV of the sources provided by editor.
- Third paragraph has been modified, as per RfC merging the third and fourth paragraphs in the GA version
- Last paragraph is largely unchanged.-- RightCowLeftCoast ( talk) 02:38, 29 April 2015 (UTC)
Too Long; Didn't Read
So we have a nice report out today explaining that the article is being skipped over because it has more then 9,000 words. According to the study people only make it through 45 to 50 percent of this article ( 88 kB - 14186 words) compared to 85 to 90 percent for the article Japan (46 kB -7345 words). This needs to be fixed if people want our readers to actually read this article. -- Moxy ( talk) 21:00, 23 March 2015 (UTC)
- All the more reason the racial incarceration breakdown should be deleted, since the overly detailed segment's presence will lead to expansion for the sake of NPOV, and possibly rounds of point/counterpoint bloating. VictorD7 ( talk) 21:08, 23 March 2015 (UTC)
- Where is this report? I am curious to read it. PointsofNoReturn ( talk) 21:09, 23 March 2015 (UTC)
- I'd like to see the report first too before supporting a shorter article.. Prcc27 ( talk) 22:11, 23 March 2015 (UTC)
- @
Moxy: If possible, will you please provide a link of some sort to this report you speak of?
Dustin
(talk) 22:25, 23 March 2015 (UTC)
- Its in my local paper (Ottawa citizen) a hard copy dated march 22....I cant find it on there website. I will see if its reprinted at some other web page. I did find this on-line that explains the problem. But all should move forward with trimming the article....as has been explained during the GA review "this article is in the worst category for size" In fact it moved from 97th before the GA review to 66 after the GA review as seen here. Wikipedia:Article size is pretty clear on these matters. We should be focused on making a readable article over jamming all we can into this one page. TLDR is a syndrome where an individual either entirely ignores content or skims through only the heading, bullets or important sections because of size.....we can fix this here/ -- Moxy ( talk) 00:51, 24 March 2015 (UTC)
- This article has good article status, so I don't see the urgency in wiping out huge swaths of content just to cut it down to size, which
goes against Wikipedia policy anyway. Just looking at comments here I am not surprised to see at least one editor salivating at the thought of deleting materials that don't fit his political agenda, which is why I will vote against any massive deletions, regardless of what some Ottawa Citizen article supposedly says. Besides, it looks to me like roughly one third of the article is made up of citations and a bibliography section.--
C.J. Griffin (
talk) 03:53, 24 March 2015 (UTC)
- <INSERT>Lots of people have complained about article length size over the years, especially its impact on load times. That's why we embarked on that long project to reduce the History section, remember? My concern here is that if you continue to use this page as a soapbox for your political agenda (you were in the middle of further expansions in the prison section before I intervened) it will make this problem even worse, especially since I and others will be forced add facts you don't like for the sake some semblance of NPOV, making the article yet bigger. That's one of the many reasons to oppose what you're doing here.
VictorD7 (
talk) 20:19, 24 March 2015 (UTC)
- You had ample opportunity to shorten it at several junctures, but instead we all must read that the poor in the US have access to refrigeration technology, but not why they are poor when everyone wants them to be able to buy their stuff.
EllenCT (
talk) 01:56, 7 April 2015 (UTC)
- No, actually the "refrigeration" and other household amenity segments simply factually describing what "poor" means in America got deleted a long time ago during a page shrinking round. I guess you forgot about that. This certainly isn't the article to get into speculative, ideologically contingent debates about why people are allegedly poor. Wow. VictorD7 ( talk) 16:47, 29 April 2015 (UTC)
- You had ample opportunity to shorten it at several junctures, but instead we all must read that the poor in the US have access to refrigeration technology, but not why they are poor when everyone wants them to be able to buy their stuff.
EllenCT (
talk) 01:56, 7 April 2015 (UTC)
- The calculations of size has nothing to do with the sources....Also i have not suggested removing huge amount of material...most can be consolidated not removed. I am only here to tell you the problem that has come up. if you think its best people just skip the article that is fine no big loss to me. Was thinking that all the people that wrote the article would like it to be read. We have an essay that is easier to understand then the policy on article sizes Wikipedia:Too long; didn't read-- Moxy ( talk) 04:56, 24 March 2015 (UTC)
- <INSERT>Lots of people have complained about article length size over the years, especially its impact on load times. That's why we embarked on that long project to reduce the History section, remember? My concern here is that if you continue to use this page as a soapbox for your political agenda (you were in the middle of further expansions in the prison section before I intervened) it will make this problem even worse, especially since I and others will be forced add facts you don't like for the sake some semblance of NPOV, making the article yet bigger. That's one of the many reasons to oppose what you're doing here.
VictorD7 (
talk) 20:19, 24 March 2015 (UTC)
- I also do not think we should shorten the article, it's fine as is.
Prcc27 (
talk) 04:20, 24 March 2015 (UTC)
- If this is considered a parent article, than content can be moved, not removed from Wikipedia, to child articles where the content is more relevant, and a summary of the child article(s) be left here with appropriate references. This is keeping with WP:TOOLONG, and does not remove content from Wikipedia, just relocates it to more appropriate sub-articles.
- Also given the lack of stability of this article (given the constant debate on changes), and now all the dead links, I believe the GA status is dubious, and is best B-class.--
RightCowLeftCoast (
talk) 11:26, 24 March 2015 (UTC)
- Even as one of the editors who helped push the article to GA, you are probably right about the lack of stability hurting the article. Sadly, that is going to happen on an article about the United States, one of the most controversial articles on Wikipedia. The dead links were mostly fixed during the GA review, but it seems more were added or we simply did not get all of them.
PointsofNoReturn (
talk) 15:50, 4 April 2015 (UTC)
- Stability should be easy for this overview parent article that is not listed at Wikipedia:List of controversial issues or Category:Wikipedia controversial topics. All the BS here should be moved and explained at the appropriate article. This is not the article to debate POV on each topic ...but present an overview. As of now more is said about random crime stats in the past two decades while neglecting Native American history. One paragraph for a millennia of Native American history with other sections bloated with stats....just does not looked balanced. Aslo do we need to link so many see also's links under each header? ...for example "Religion" the main article Religion in the United States has all the links that are spammed here. -- Moxy ( talk) 17:05, 4 April 2015 (UTC)
- Even as one of the editors who helped push the article to GA, you are probably right about the lack of stability hurting the article. Sadly, that is going to happen on an article about the United States, one of the most controversial articles on Wikipedia. The dead links were mostly fixed during the GA review, but it seems more were added or we simply did not get all of them.
PointsofNoReturn (
talk) 15:50, 4 April 2015 (UTC)
Contemporary history
I have some proposals for changes to the contemporary history subsection:
1: I propose the removal of the mention of NAFTA from the contemporary history section. NAFTA is already discussed in the foreign relations section (where I feel it better belongs), making its further mention in the history section redundant. In addition, I feel that the current mention is also clunky, non-chronological, and overly-detailed. If any mention of NAFTA is to remain in the history section, I would propose that it be greatly reduced in detail (certainly no more than a sentence) and placed in a more sensible location chronologically (certainly before 9/11, as it was formed in 1994, and was a major political issue mainly in the 1990s). But it is my opinion that NAFTA is simply not historically significant enough to merit mention in the history section with its current low level of detail (which I think is ideal). I will note that NAFTA is mentioned once in the body of the article on Canada (a FA), in the economy section, and once in the article on Mexico, in the history section (excluding mentions in the leads of both articles).
2: I propose the removal of the precise date range given for the Great Recession. I feel that giving these exact dates is far over-detailed. I also feel that the previous ambiguity given to the start and end dates of the recession was ideal, as whether or not the recession actually ended in 2009 is highly debatable. The source given in the article ascertains these dates for the recession by examining the dates at which the business cycle was at its peak and at its trough. For comparison, If we applied this standard to the Great Depression, we would date it from August 1929 to March 1933. But we don’t do this ( at least not here); both because that would be far too detailed, and also because it isn't really true; virtually any non-economist living in the country would have said we were still in an economic depression long after March 1933. The case is very similar with 2009.
3: I propose the removal of the portion of the text referring to Barack Obama as the first multiracial president. While this is true (as far as we know), I don't feel that this fact is one worth mentioning in this broad overview of American history. As has been discussed previously, the primary reason Obama is mentioned at all is because he is the first African American president, and this is what makes him particularly historically notable. While personally I'm still on the fence about whether this alone is sufficient reason to mention him, I certainly feel that the further mention of his multi-racial heritage is excessive in detail.
You may have noticed that the application of these changes would largely bring the subsection back to the way it was previously, immediately after the large-scale summarization we went through some time ago. This is not a coincidence. There is a clear tendency for this subsection to grow in length over time. I think it is important for us to keep this in check, making sure the level of detail in the subsection is not disproportionate to that in the other areas of the history section. Allowing a higher level of detail here just because the events described occured more recently is textbook recentism.
I will apply any changes without objection in a few days. -- Philpill691 ( talk) 00:28, 26 April 2015 (UTC)
- Leave the NAFTA element in. Contemporary history is to range from 1991-present. The NAFTA agreement began to phase in 1994 and was complete in 2008. It is one of the largest free trade areas in the world, which has great significance relative to the ability of the U.S. to recover from the Great Recession faster than the Europeans. It is significant enough to remain as a consensus element of contemporary history. In foreign relations, NAFTA is an exemplar of the U.S. openness in international cooperation for free trade as noted in that section. The mention of NAFTA in one section need not be mutually exclusive for mention in another for different purposes.
- On the other hand, the Foreign relations or Contemporary history section is missing the “special relationship” the U.S. fosters with military allies to form international coalitions of the willing for humanitarian and punitive purposes as sanctioned by international organizations such as UN, NATO, OAS or the Arab League in the 21st century modern era.
TheVirginiaHistorian (
talk) 10:27, 26 April 2015 (UTC)
- IMHO the multiracial background of the current President is just as important as the fact his father was an immigrant from Africa. I also agree with TVH on the importance of NAFTA and other multinational alliances formed by the United States in the 20th and 21st centuries. Furthermore, I do agree with
Philpill691's suggestion of removing dates of the great recession, especially since public perception still sees it as an ongoing event (as late as
January 2015,
June 2014,
March 2014).--
RightCowLeftCoast (
talk) 20:52, 26 April 2015 (UTC)
- "Public perception" is not what counts here. What counts are the reliable sources that speak about the end of that recession. - Cwobeel (talk) 21:21, 26 April 2015 (UTC)
- There are plenty of RSs that describe the end of the recession, despite what the good folks at Fox News say. The U.S. National Bureau of Economic Research is the official arbiter of U.S. recessions, per the source used. - Cwobeel (talk) 21:27, 26 April 2015 (UTC)
- Anyone here believes that mentioning the first black/multiracial president is not relevant or noteworthy? I mean, really? -
Cwobeel
(talk) 21:29, 26 April 2015 (UTC)
- Not just Fox News, but HuffPo and Pew Research as well. Why only mention Fox News?
- Fact is, polls indicate while statistically economist say the economy has turned around, many people do not agree with economist say.-- RightCowLeftCoast ( talk) 18:06, 27 April 2015 (UTC)
- IMHO the multiracial background of the current President is just as important as the fact his father was an immigrant from Africa. I also agree with TVH on the importance of NAFTA and other multinational alliances formed by the United States in the 20th and 21st centuries. Furthermore, I do agree with
Philpill691's suggestion of removing dates of the great recession, especially since public perception still sees it as an ongoing event (as late as
January 2015,
June 2014,
March 2014).--
RightCowLeftCoast (
talk) 20:52, 26 April 2015 (UTC)
- If we provide unusually specific NBER defined dates for this recession for some reason, we should also point out that this has been the worst recovery in US history ( [14], [15], [16], [17], [18]). The still overwhelmingly negative "public sentiment" is based on very real factors, including a sharp decline in median income over the past several years, anemic GDP growth (even this past quarter only saw annualized growth at 0.2%), and a lousy job market that's seen both the labor participation rate fall to its lowest point since the 1970s and what new jobs have been created since the last peak in 2007 mostly going to immigrants ( [19]). And it's not just conservatives and business reporters saying this is an unusually weak recovery, but left wingers (the kind of people who use "Fox News" out of the blue as an insult; [20]), though of course they put a different spin on the causes, both insisting the anemic recovery was "expected" and somewhat contradictorily blaming Obama era policies like an alleged lack of spending. The truth is that there has been an L shaped recovery unlike the V shaped ones that have followed other sharp recessions, almost certainly due to record shattering spending increases and deficits, tax hikes, massive regulatory expansions, and rhetoric from an anti-business administration poisoning the climate to the point where some of Obama's former high profile supporters (like Steve Jobs) felt compelled to publicly admonish him. At this point we'll be due for the next cyclical recession before we've recovered from the last one.
- Regardless of one's stance on these issues, the bottom line is that the technical NBER recession from late 2007 through early 2009, by itself, isn't noteworthy enough to include in this History section when other recessions, even extremely serious ones, aren't mentioned. What is worth noting is the ongoing economic stagnation that has plagued the nation for several years. That's what makes the downturn worth mentioning at all. Therefore if the specific NBER dates are kept in the article, we need to mention the disastrously anemic recovery since then to avoid warping our description of reality. VictorD7 ( talk) 19:56, 30 April 2015 (UTC)
Problem with inaccuracy and bias in the disputed productivity/income graph and sentence.
The graph juxtaposing "productivity" and "real median family income" in the Income, poverty, and wealth section and its companion sentence.."There has been a widening gap between productivity and median incomes since the 1970s.[403]"...is sourced entirely by an opinion piece by EPI, a liberal think tank. The graph is based on the group's own original calculations. Numerous sources dispute it and similar presentations (which most frequently appear on liberal blogs as a talking point), critiquing both the methodology involved and the relevance of the comparison (e.g. conservative think tank [21], St. Louis Federal Reserve [22]; even a liberal leaning think tank has acknowledged the methodological problems involved [23]).
Criticisms include comparing total productivity to "median" income (as opposed to mean; in other words apples and oranges), using data from two different sets that are based on different inflation adjusters (IPD for productivity and CPI for income; also apples and oranges), using annual income rather than hourly when people are working fewer hours, failing to capture all of the increased benefits workers have been compensated with in recent decades, and failing to account for factors like technology-driven depreciation increases and import price measurement problems that overstate productivity. Adjusting for these and other factors has led to alternative charts being produced (see the first two criticism links listed at the end of the above paragraph) that look very different than what's currently being given unchallenged authority in Wikipedia's voice. Additional complicating factors include productivity rises not necessarily occurring in the sectors where most people work and such charts being skewed by postwar incomes growing with aberrational speed.
Given these various vital problems, WP:NPOV policy is in gross violation and I propose the graph and sentence be deleted. The alternative would be to add sources to the text sentence and dramatically expand the chart caption the way it was on the Economy of the United States page (scroll down slightly), but that's an extreme bloat that would be unlike any other picture on the United States page and would still leave a skewed and unnecessary visual presentation. It works on the Economy page because that's a more specialized, lower traffic article. Here deletion would be better. VictorD7 ( talk) 22:26, 29 April 2015 (UTC)
- If you use the mean income, that tracks productivity well. The median income also used to very tightly correlate with productivity, but it hasn't since 1973, as has been illustrated by a graph in this article which has been there for at least a year. The right-wing think tank sources you cite would prefer that you remain ignorant of the distinction, or at least their patrons would. EllenCT ( talk) 04:54, 30 April 2015 (UTC)
- No, educating people like you on the distinction was their point. Your graph doesn't compare median income to median productivity, and, even setting aside the fact that your chart only starts at 1947 and shows a correlation for about 20 years, there's no reason to assume given the rise of technology that productivity or income gains would be evenly distributed throughout the population. Also, I cited right and left wing sources critiquing EPI's methodology and you didn't address the other problems I listed. Even if you somehow manage to disagree with their arguments at the very least a rational person has to acknowledge that the material is disputed on both accuracy and relevance. VictorD7 ( talk) 18:25, 30 April 2015 (UTC)
- How is it even mathematically possible for mean income to decouple from productivity growth the way median income did in the 1970s? That would require huge macroeconomic or monetary policy effects dozens of times those observed. The last link in your first paragraph of this section doesn't work, but the underlying PDF confirms that part of the reason for the decoupling is the very well documented income shift from labor to capital. I am indeed skeptical of the other factors described therein, and their characterization. EllenCT ( talk) 21:19, 4 May 2015 (UTC)
- The last link (to a cached version of the liberal think tank piece; they had moved their pdf) works for me, but our respective opinions on the factors involved don't really matter. I've shown that 1. The graph and sentence are original creations of a liberal group and 2. the material and its significance is highly disputed. VictorD7 ( talk) 19:46, 5 May 2015 (UTC)
- The graph was originally suggested here by a moderate editor who describes himself generally as right of center. There is no such dispute in the peer reviewed reliable sources, only with the
WP:FRINGE political blogs you favor and so-called think-tanks without any
WP:SECONDARY academic support, both of which are
WP:UNDUE in an encyclopedic
WP:SUMMARY geographic article but are welcome in e.g.
Politics of the United States.
EllenCT (
talk) 23:13, 8 May 2015 (UTC)
- I don't recall which poster allegedly first "suggested" it, but it was added and has mostly been kept in this article by a very left wing editor who replaced an older, more neutral chart of median income without the cherry-picked POV juxtaposition of (a disputed version of) productivity. He even added the sentence ex post facto after it was pointed out to him that the chart he added had nothing to do with any of the section's text. Your post is nonsense. The chart's source is EPI, a left wing think tank/lobbyist outfit, and not a source that's any more "peer reviewed" than the ideologically diverse expert commentary I linked to disputing it (indeed publications like the St. Louis Fed. piece I posted are peer reviewed). I'm proposing it be deleted, not that it be replaced by anything, "blog" or otherwise. VictorD7 ( talk) 00:30, 9 May 2015 (UTC)
- The graph was originally suggested here by a moderate editor who describes himself generally as right of center. There is no such dispute in the peer reviewed reliable sources, only with the
WP:FRINGE political blogs you favor and so-called think-tanks without any
WP:SECONDARY academic support, both of which are
WP:UNDUE in an encyclopedic
WP:SUMMARY geographic article but are welcome in e.g.
Politics of the United States.
EllenCT (
talk) 23:13, 8 May 2015 (UTC)
Density Calculation
Dear Editors,
We were just checking the population density of the US for fun, and when we entered the figures for square mileage and population on this page, we came up with a different result. Can you explain the discrepancy? — Preceding unsigned comment added by 70.194.73.3 ( talk) 00:18, 10 May 2015 (UTC)
- @ 70.194.73.3: Thanks for pointing that out! The numbers were off, in addition to the math being wrong, the population was out of date and the density calculation was using total area instead of land area. They should be fixed now! Winner 42 Talk to me! 00:46, 10 May 2015 (UTC)