Suffolk County Council in England is elected every four years. Since the last boundary changes in 2005, 75 councillors have been elected from 75 wards. [1]
County Council composition
| Election | Conservative | Labour | Liberal Democrat | Green | UKIP | Other | Total | Notes |
|---|---|---|---|---|---|---|---|---|
| 1973 | 45 | 25 | 3 | - | - | 3 | 76 | |
| 1977 | 66 | 7 | 1 | - | - | 2 | 76 | |
| 1981 | 45 | 27 | 0 | - | - | 4 | 76 | |
| 1985 | 50 | 23 | 3 | - | - | 4 | 80 | Boundary changes increased the number of seats by 4 [2] |
| 1989 | 46 | 26 | 4 | - | - | 4 | 80 | |
| 1993 | 26 | 31 | 19 | - | - | 4 | 80 | |
| 1997 | 31 | 34 | 14 | 0 | 0 | 1 | 80 | |
| 2001 | 31 | 36 | 12 | 0 | 0 | 1 | 80 | |
| 2005 | 45 | 22 | 7 | 0 | 0 | 1 | 75 | Boundary changes reduced the number of seats by 5 [3] |
| 2009 | 55 | 4 | 11 | 2 | 1 | 2 | 75 | |
| 2013 | 39 | 15 | 7 | 2 | 9 | 3 | 75 | |
| 2017 | 52 | 11 | 5 | 3 | 0 | 4 | 75 | |
| 2021 | 55 | 5 | 4 | 9 | 0 | 2 | 75 | |
Composition since 1973
1973
1977
1981
1985
1989
1993
1997
2001
2005
2009
2013
2017
2021
County result maps
-
 2009 results map
 -
 2013 results map
 -
 2017 results map
 -
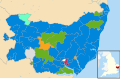 2021 results map


By-election results
1993-1997
| Party | Candidate | Votes | % | ±% | |
|---|---|---|---|---|---|
| Labour | 571 | 41.9 | |||
| Conservative | 554 | 40.6 | |||
| Liberal Democrats | 237 | 17.4 | |||
| Majority | 17 | 1.3 | |||
| Turnout | 1,362 | ||||
| Labour gain from Conservative | Swing | ||||
1997-2001
| Party | Candidate | Votes | % | ±% | |
|---|---|---|---|---|---|
| Labour | 569 | 51.5 | −1.5 | ||
| Conservative | 391 | 35.4 | +3.4 | ||
| Liberal Democrats | 144 | 13.0 | −2.0 | ||
| Majority | 178 | 16.1 | |||
| Turnout | 1,104 | ||||
| Labour hold | Swing | ||||
| Party | Candidate | Votes | % | ±% | |
|---|---|---|---|---|---|
| Liberal Democrats | David Wood | 1,193 | 66.3 | +1.2 | |
| Conservative | Stephen Williams | 504 | 28.0 | −6.8 | |
| Green | Anthony Slade | 102 | 5.7 | +5.7 | |
| Majority | 689 | 38.3 | |||
| Turnout | 1,799 | 31.0 | |||
| Liberal Democrats hold | Swing | ||||
2001-2005
| Party | Candidate | Votes | % | ±% | |
|---|---|---|---|---|---|
| Conservative | Jane Storey | 991 | 47.4 | +7.9 | |
| Liberal Democrats | Carol Milward | 982 | 47.0 | +8.5 | |
| Green | John Matthissen | 116 | 5.6 | +5.6 | |
| Majority | 9 | 0.4 | |||
| Turnout | 2,089 | 28.6 | |||
| Conservative hold | Swing | ||||
| Party | Candidate | Votes | % | ±% | |
|---|---|---|---|---|---|
| Labour | Kevan Lim | 819 | 53.6 | −0.6 | |
| Conservative | Anthony Ramsey | 369 | 24.3 | −0.5 | |
| Liberal Democrats | Robin Whitmore | 331 | 21.8 | +1.1 | |
| Majority | 450 | 29.6 | |||
| Turnout | 1,519 | 24.3 | |||
| Labour hold | Swing | ||||
| Party | Candidate | Votes | % | ±% | |
|---|---|---|---|---|---|
| Conservative | Janet Sibley | 645 | 38.0 | +4.3 | |
| Labour | Neil MacDonald | 588 | 34.6 | −14.2 | |
| Liberal Democrats | Robin Whitmore | 465 | 27.4 | +9.9 | |
| Majority | 57 | 3.4 | |||
| Turnout | 1,698 | 29.0 | |||
| Conservative gain from Labour | Swing | ||||
| Party | Candidate | Votes | % | ±% | |
|---|---|---|---|---|---|
| Conservative | Raeburn Leighton | 989 | 54.5 | +1.9 | |
| Liberal Democrats | Peter Perren | 716 | 39.4 | −8.0 | |
| Labour | Catherine Knight | 111 | 6.1 | +6.1 | |
| Majority | 273 | 15.1 | |||
| Turnout | 1,816 | 35.8 | |||
| Conservative hold | Swing | ||||
| Party | Candidate | Votes | % | ±% | |
|---|---|---|---|---|---|
| Conservative | Peter Bellfield | 1,114 | 50.9 | +7.2 | |
| Liberal Democrats | Ronald Else | 870 | 39.7 | +8.5 | |
| Labour | Valerie Pizzey | 206 | 9.4 | −15.8 | |
| Majority | 244 | 11.2 | |||
| Turnout | 2,190 | 31.2 | |||
| Conservative hold | Swing | ||||
| Party | Candidate | Votes | % | ±% | |
|---|---|---|---|---|---|
| Labour | William Quinton | 711 | 45.5 | −15.1 | |
| Conservative | Adam Ramsay | 463 | 29.4 | +4.3 | |
| Liberal Democrats | Catherine Chambers | 313 | 20.1 | +6.1 | |
| CPA | Jonathan Barnes | 74 | 4.7 | +4.7 | |
| Majority | 248 | 15.8 | |||
| Turnout | 1,561 | 24.5 | |||
| Labour hold | Swing | ||||
| Party | Candidate | Votes | % | ±% | |
|---|---|---|---|---|---|
| Conservative | Ann Rodwell | 1,401 | 65.5 | +12.9 | |
| Liberal Democrats | Cherrie MacGregor | 456 | 21.3 | +0.6 | |
| Labour | Harriet Bennett | 281 | 13.1 | −13.5 | |
| Majority | 945 | 44.2 | |||
| Turnout | 2,138 | 32.0 | |||
| Conservative hold | Swing | ||||
| Party | Candidate | Votes | % | ±% | |
|---|---|---|---|---|---|
| Conservative | Benjamin Redsell | 990 | 43.8 | +4.3 | |
| Liberal Democrats | Diana Ball | 867 | 38.3 | +9.9 | |
| Labour | Roy Burgon | 194 | 8.6 | −18.4 | |
| English Democrat | Robert Jay | 139 | 6.1 | +6.1 | |
| Green | Gordon Forbes | 71 | 3.1 | +3.1 | |
| Majority | 123 | 5.4 | |||
| Turnout | 2,261 | 32.0 | |||
| Conservative hold | Swing | ||||
2005-2009
| Party | Candidate | Votes | % | ±% | |
|---|---|---|---|---|---|
| Conservative | Anne Whybrow | 733 | 35.0 | +0.9 | |
| Liberal Democrats | Keith Scarff | 668 | 32.0 | +9.5 | |
| Green | Twiggy Davis | 354 | 16.9 | +4.7 | |
| Labour | Duncan Macpherson | 337 | 16.1 | −15.2 | |
| Majority | 65 | 3.0 | |||
| Turnout | 2,092 | 29.0 | |||
| Conservative hold | Swing | ||||
| Party | Candidate | Votes | % | ±% | |
|---|---|---|---|---|---|
| Conservative | Kenneth Sale | 1,338 | 36.5 | +2.8 | |
| Labour | Terence Kelly | 1,097 | 29.9 | −1.2 | |
| UKIP | Derek Hackett | 592 | 16.1 | +16.1 | |
| Liberal Democrats | Peter Guyton | 397 | 10.8 | −6.0 | |
| Green | Ann Skipper | 243 | 6.6 | −1.0 | |
| Majority | 241 | 6.6 | |||
| Turnout | 3,667 | 32.5 | |||
| Conservative gain from Labour | Swing | ||||
| Party | Candidate | Votes | % | ±% | |
|---|---|---|---|---|---|
| Conservative | Colin Noble | 1,222 | 61.5 | +20.7 | |
| UKIP | Ian Smith | 297 | 14.9 | +5.6 | |
| Labour | David Bowman | 219 | 11.0 | −11.1 | |
| Liberal Democrats | Tim Huggan | 118 | 5.9 | −7.1 | |
| Independent | David Chandler | 110 | 5.5 | −9.3 | |
| Independent | David Hitchman | 22 | 1.1 | +1.1 | |
| Majority | 925 | 46.6 | |||
| Turnout | 1,988 | 27.0 | |||
| Conservative hold | Swing | ||||
| Party | Candidate | Votes | % | ±% | |
|---|---|---|---|---|---|
| Liberal Democrats | Penny Otton | 927 | 41.8 | +7.5 | |
| Conservative | Julia Dunnicliffe | 833 | 37.5 | −9.4 | |
| Green | Cathy Cass | 287 | 12.9 | +12.9 | |
| Labour | Ron Snell | 88 | 4.0 | −14.8 | |
| UKIP | Chris Streatfield | 85 | 3.8 | +3.8 | |
| Majority | 94 | 4.3 | |||
| Turnout | 2,220 | 32.4 | |||
| Liberal Democrats gain from Conservative | Swing | ||||
| Party | Candidate | Votes | % | ±% | |
|---|---|---|---|---|---|
| Conservative | Gary Green | 834 | 38.8 | −0.7 | |
| Liberal Democrats | Nicky Turner | 781 | 36.3 | +18.1 | |
| Green | Nigel Rozier | 231 | 10.7 | +1.6 | |
| Labour | Duncan Macpherson | 190 | 8.8 | −24.5 | |
| UKIP | Christopher Streatfield | 114 | 5.3 | +5.3 | |
| Majority | 53 | 2.5 | |||
| Turnout | 2,150 | 27.0 | |||
| Conservative hold | Swing | ||||
| Party | Candidate | Votes | % | ±% | |
|---|---|---|---|---|---|
| Liberal Democrats | Caroline Page | 970 | 41.8 | +2.3 | |
| Conservative | Nigel Barratt | 826 | 35.6 | −4.4 | |
| Independent | Michael Weaver | 378 | 16.3 | +16.3 | |
| Labour | Roy Burgon | 147 | 6.3 | −14.2 | |
| Majority | 144 | 6.2 | |||
| Turnout | 2,321 | 37.2 | |||
| Liberal Democrats gain from Conservative | Swing | ||||
2009-2013
| Party | Candidate | Votes | % | ±% | |
|---|---|---|---|---|---|
| Conservative | Richard Smith | 2,240 | 45.5 | −2.0 | |
| Independent | Joan Girling | 1,439 | 29.2 | n/a | |
| Labour | Terry Hodgson | 1,243 | 25.3 | +12.1 | |
| Majority | 801 | 16.3 | −6.7 | ||
| Turnout | 5,009 | 66.2 | +26.2 | ||
| Conservative hold | Swing | ||||
| Party | Candidate | Votes | % | ±% | |
|---|---|---|---|---|---|
| Conservative | Stefan Oliver | 1,005 | 28.8 | 0.0 | |
| Independent | David Nettleton | 950 | 27.2 | +1.2 | |
| Labour | Kevin Hind | 759 | 21.7 | +12.6 | |
| Green | Pippa Judd | 479 | 13.7 | −13.4 | |
| Liberal Democrats | David Chappell | 300 | 8.6 | −0.4 | |
| Majority | 55 | ||||
| Turnout | 3,505 | 20.9 | |||
| Conservative hold | Swing | −0.6 | |||
| Party | Candidate | Votes | % | ±% | |
|---|---|---|---|---|---|
| Conservative | Andrew Reid | 1,913 | 55.2 | −5.4 | |
| Liberal Democrats | Christine Hancock | 796 | 23.0 | −7.2 | |
| Labour | Roy Burgon | 758 | 21.9 | +12.6 | |
| Majority | 1,117 | 32.2 | +1.8 | ||
| Turnout | 3,495 | 54.1 | +5.1 | ||
| Conservative hold | Swing | 0.9 | |||
| Party | Candidate | Votes | % | ±% | |
|---|---|---|---|---|---|
| Conservative | Christopher Hudson | 1,302 | 49.7 | −7.5 | |
| Labour | Kevin Archer | 804 | 30.7 | +16.7 | |
| Liberal Democrats | Derrick Fairbrother | 514 | 19.6 | −9.3 | |
| Majority | 498 | 19.0 | −9.3 | ||
| Turnout | 2639 | 17.1 | |||
| Conservative hold | Swing | −12.1 | |||
| Party | Candidate | Votes | % | ±% | |
|---|---|---|---|---|---|
| Conservative | Alan Murray | 866 | 43.8 | −11.3 | |
| Labour Co-op | John Cook | 566 | 28.6 | +15.0 | |
| UKIP | Chris Streatfield | 229 | 11.6 | +11.6 | |
| Green | Barry Broom | 189 | 9.6 | −4.4 | |
| Liberal Democrats | Peter Bagnall | 127 | 6.4 | −10.9 | |
| Majority | 300 | 15.1 | −22.7 | ||
| Turnout | 1988 | 35 | |||
| Conservative hold | Swing | −13.2 | |||
2013-2017
| Party | Candidate | Votes | % | ±% | |
|---|---|---|---|---|---|
| Conservative | Tim Marks | 3,001 | 38.9 | +4.5 | |
| UKIP | John Burns | 2,313 | 30.0 | +0.2 | |
| Labour | Maureen Byrne | 2,004 | 26.0 | +0.4 | |
| Liberal Democrats | Ken Rolph | 404 | 5.2 | −1.2 | |
| Majority | 1,117 | 8.9 | +4.3 | ||
| Turnout | 7,825 | 57.7 | |||
| Conservative hold | Swing | +2.2 | |||
| Party | Candidate | Votes | % | ±% | |
|---|---|---|---|---|---|
| Conservative | Robin Millar | 644 | 39.7 | −4.9 | |
| UKIP | Roger Dicker | 494 | 30.5 | +2.1 | |
| Labour | Michael Jefferys | 284 | 17.5 | −3.2 | |
| Independent | Andrew Appleby | 123 | 7.6 | +7.6 | |
| Liberal Democrats | Tim Huggan | 76 | 4.7 | −1.6 | |
| Majority | 150 | 9.2 | −7.0 | ||
| Turnout | 1,625 | 18.0 | |||
| Conservative hold | Swing | −3.5 | |||
| Party | Candidate | Votes | % | ±% | |
|---|---|---|---|---|---|
| Conservative | Paul West | 1,117 | 49.7 | −8.7 | |
| Labour | Rob Bridgeman | 634 | 28.2 | +3.5 | |
| UKIP | Tony Gould | 344 | 15.3 | +15.3 | |
| Liberal Democrats | Colin Boyd | 154 | 6.8 | +1.3 | |
| Majority | 300 | 21.5 | −12.2 | ||
| Turnout | 2,264 | 40.9 | |||
| Conservative hold | Swing | −6.1 | |||
| Party | Candidate | Votes | % | ±% | |
|---|---|---|---|---|---|
| UKIP | John Burns | 1,273 | 36.8 | +6.8 | |
| Conservative | Margaret Marks | 1,168 | 33.8 | −5.1 | |
| Labour | David Smith | 838 | 24.2 | −1.8 | |
| Liberal Democrats | Ken Rolph | 178 | 5.1 | −0.1 | |
| Majority | 105 | 2.8 | |||
| Turnout | 3,480 | 26.0 | |||
| UKIP gain from Conservative | Swing | +6.0 | |||
| Party | Candidate | Votes | % | ±% | |
|---|---|---|---|---|---|
| Conservative | Robin Vickery | 1,142 | 60.2 | +1.4 | |
| Labour | Revd Canon Graham Hedger | 344 | 18.2 | +4.1 | |
| Liberal Democrats | Jon Neal | 228 | 12.1 | +4.2 | |
| Green | Jacqueline Barrow | 228 | 9.3 | +9.3 | |
| Majority | 798 | 42.0 | +2.0 | ||
| Turnout | 1,895 | 27.4 | −10.6 | ||
| Conservative hold | Swing | −1.4 | |||
| Party | Candidate | Votes | % | ±% | |
|---|---|---|---|---|---|
| Liberal Democrats | Trevor Sheldrick | 642 | 36.2 | +12.0 | |
| Conservative | Kathryn Grandon-White | 460 | 25.9 | −5.6 | |
| Labour | Susan Monks | 397 | 22.4 | +5.8 | |
| UKIP | Stephen Laing | 204 | 11.5 | −11.3 | |
| Green | Lisa Gordon | 70 | 3.9 | −0.9 | |
| Majority | 182 | 10.3 | |||
| Turnout | 1,777 | 26.9 | |||
| Liberal Democrats gain from Conservative | Swing | +8.8 | |||
2017-2021
| Party | Candidate | Votes | % | ±% | |
|---|---|---|---|---|---|
| Labour | Sarah Adams | 1,247 | 62.9 | +5.3 | |
| Conservative | James Harding | 483 | 24.4 | −7.3 | |
| Liberal Democrats | Edward Packard | 200 | 10.1 | +5.1 | |
| Green | Charlotte Armstrong | 52 | 2.6 | −3.1 | |
| Majority | 764 | 38.5 | +12.6 | ||
| Turnout | 1,987 | 29.7 | −6.2 | ||
| Labour hold | Swing | +6.3 | |||
| Party | Candidate | Votes | % | ±% | |
|---|---|---|---|---|---|
| Conservative | Kay Oakes | 747 | 45.5 | −0.5 | |
| Liberal Democrats | Stephen Phillips | 726 | 44.2 | +5.5 | |
| Labour | Emma Bonner-Morgan | 168 | 10.2 | +2.9 | |
| Majority | 21 | 1.3 | −6.0 | ||
| Turnout | 1,647 | 21.3 | −11.4 | ||
| Conservative hold | Swing | −2.6 | |||
| Party | Candidate | Votes | % | ±% | |
|---|---|---|---|---|---|
| Conservative | Andrew Drummond | 893 | 50.3 | −0.2 | |
| Liberal Democrats | Jonathan Edge | 315 | 17.7 | +8.8 | |
| West Suffolk Independent | Andrew Appleby | 248 | 14.0 | +2.5 | |
| Labour | Theresa Chipulina | 198 | 11.1 | −4.5 | |
| Green | Alice Haycock | 123 | 6.9 | +6.9 | |
| Majority | 578 | 32.6 | −3.3 | ||
| Turnout | 1,783 | 17.2 | −8.4 | ||
| Conservative hold | Swing | −4.5 | |||
2022-2025
| Party | Candidate | Votes | % | ±% | |
|---|---|---|---|---|---|
| Green | Ash Lever | 2,114 | 70.5 | +18.5 | |
| Conservative | Letitia Smith | 624 | 20.8 | –19.7 | |
| Labour | Christian Newsome | 260 | 8.7 | +1.2 | |
| Majority | 1,490 | 49.7 | N/A | ||
| Turnout | 3,006 | 25.7 | –15.9 | ||
| Registered electors | 11,703 | ||||
| Green hold | Swing | ||||
| Party | Candidate | Votes | % | ±% | |
|---|---|---|---|---|---|
| Liberal Democrats | Seamus Bennett | 2,519 | 44.4 | +25.8 | |
| Conservative | Kevin Sullivan | 2,060 | 36.3 | –13.2 | |
| Green | Lesley Bennett | 939 | 16.6 | +5.5 | |
| Communist | Mark Jones | 150 | 2.6 | ±0.0 | |
| Majority | 459 | 8.1 | N/A | ||
| Turnout | 5,740 | 36.5 | -2.8 | ||
| Registered electors | 15,706 | ||||
| Liberal Democrats gain from Conservative | Swing | +19.5 | |||
| Party | Candidate | Votes | % | ±% | |
|---|---|---|---|---|---|
| Labour | Lucy Smith | 918 | 50.8 | +5.1 | |
| Conservative | Gregor McNie | 567 | 31.4 | –9.1 | |
| Green | Andy Patmore | 180 | 10.0 | +1.0 | |
| Liberal Democrats | Trevor Powell | 143 | 7.9 | +3.0 | |
| Majority | 351 | 19.4 | +14.2 | ||
| Turnout | 1,820 | 27.3 | |||
| Registered electors | 6,679 | ||||
| Labour hold | Swing | +7.1 | |||
| Party | Candidate | Votes | % | ±% | |
|---|---|---|---|---|---|
| Liberal Democrats | Ruth Leach | 990 | 51.2 | –12.3 | |
| Conservative | Alan Porter | 642 | 33.2 | –3.3 | |
| Labour | Paul Richards | 301 | 15.6 | N/A | |
| Majority | 348 | 18.0 | –9.0 | ||
| Turnout | 1,943 | 30.5 | –16.4 | ||
| Registered electors | 6,363 | ||||
| Liberal Democrats hold | Swing | -4.5 | |||
References
- ^ "County Councillors". Suffolk County Council. Archived from the original on 24 February 2012. Retrieved 18 March 2010.
- ^ The County of Suffolk (Electoral Arrangements) Order 1984
- ^ "Local election results: Suffolk". BBC News Online. Archived from the original on 19 October 2006. Retrieved 18 March 2010.
- ^ "Past election results" (PDF). Babergh District Council. Archived from the original (PDF) on 22 July 2011. Retrieved 18 March 2010.
- ^ a b c d "Thedwastre South" (PDF). Suffolk County Council. Archived from the original (PDF) on 24 February 2012. Retrieved 18 March 2010.
- ^ a b "Wickham" (PDF). Suffolk County Council. Archived from the original (PDF) on 24 February 2012. Retrieved 18 March 2010.
- ^ "Liberal Democrats win Yoxford by-election" (PDF). Suffolk Coastal District Council. 6 February 2004. Archived from the original (PDF) on 13 June 2011. Retrieved 18 March 2010.
- ^ "Conservatives hold Felxstowe South seat" (PDF). Suffolk Coastal District Council. 23 April 2004. Archived from the original (PDF) on 14 June 2011. Retrieved 18 March 2010.
- ^ "Stowmarket South by-election results". Suffolk County Council. Retrieved 18 March 2010.[ permanent dead link]
- ^ "Greens build on election success". guardian.co.uk. London. 12 May 2006. Archived from the original on 10 May 2017. Retrieved 18 March 2010.
- ^ "Pakefield by-election results". Suffolk County Council. Retrieved 18 March 2010.[ permanent dead link]
- ^ "Row Heath by-election results". Suffolk County Council. Archived from the original on 15 July 2006. Retrieved 18 March 2010.
- ^ "Lib Dems snatch shock win in council by-election". 24dash.com. 24 August 2007. Archived from the original on 29 February 2012. Retrieved 18 March 2010.
- ^ "Thedwastre South By-election Results". Suffolk County Council. Retrieved 18 March 2010. [ permanent dead link]
- ^ "Stowmarket North and Stowupland by-election results 2008". Suffolk County Council. Retrieved 18 March 2010.[ permanent dead link]
- ^ "19 September 2008 - Woodbridge by-election". Suffolk County Council. Retrieved 25 September 2008. [ dead link]
- ^ "Aldeburgh and Leiston by-election results". Suffolk County Council. Retrieved 28 July 2011.[ permanent dead link]
- ^ "Tower by-election results". Suffolk County Council. Archived from the original on 24 December 2018. Retrieved 16 May 2016.
- ^ "Wilford by-election results". Suffolk County Council. Retrieved 28 July 2011.[ permanent dead link]
- ^ a b "By-Election Results in 2012". Suffolk County Council. Archived from the original on 31 August 2012. Retrieved 4 March 2013.
- ^ a b "Haverhill Cangle by-election results". Suffolk County Council. Archived from the original on 24 December 2018. Retrieved 16 May 2016.
- ^ "Newmarket and Red Lodge by-election results". Suffolk County Council. Archived from the original on 24 December 2018. Retrieved 16 May 2016.
- ^ "Bixley By-election Results 2016". Suffolk County Council. Archived from the original on 24 December 2018. Retrieved 16 May 2016.
- ^ https://www.suffolk.gov.uk/assets/council-and-democracy/consultations-petitions-and-elections/2016-09-23-Hadleigh-Declaration-of-results.pdf [ bare URL PDF] [ dead link]
- ^ "Declaration of Result - Beccles Division" (PDF). Archived (PDF) from the original on 10 March 2023. Retrieved 10 March 2023.