Salmon, Idaho | |
|---|---|
 | |
| Motto: "The Birthplace of Sacajawea"
[1] | |
 Location of Salmon in Lemhi County, Idaho. | |
| Coordinates: 45°10′41″N 113°54′10″W / 45.17806°N 113.90278°W | |
| Country | United States |
| State | Idaho |
| County | Lemhi |
| Area | |
| • Total | 2.54 sq mi (6.59 km2) |
| • Land | 2.51 sq mi (6.49 km2) |
| • Water | 0.04 sq mi (0.10 km2) |
| Elevation | 3,944 ft (1,202 m) |
| Population | |
| • Total | 3,112 |
| • Estimate (2019)
[4] | 3,169 |
| • Density | 1,264.06/sq mi (488.01/km2) |
| Time zone | UTC-7 ( Mountain (MST)) |
| • Summer ( DST) | UTC-6 ( MDT) |
| ZIP code | 83467 |
| Area code | 208 |
| FIPS code | 16-71650 |
| GNIS feature ID | 0398084 |
| Website |
www |
Salmon is a city in Lemhi County, Idaho. The population was 3,112 at the 2010 census. The city is the county seat of Lemhi County. [5]
History
The Lewis and Clark Expedition crossed the Continental Divide at Lemhi Pass, 30 miles (48 km) to the southeast of Salmon. They followed the Salmon River through the present site of the city, then ascended the north fork of the river, at the present-day town named after the confluence, to cross into present-day Montana near Lost Trail Pass. The sole female in the party, Sacagawea, was born in the Lemhi Valley near Salmon. [6] The Sacajawea Interpretive, Cultural and Educational Center was opened in Salmon in August 2003.
From 1910 to 1939, Salmon was the western terminus of the now-defunct Gilmore and Pittsburgh Railroad.
-
 The Owl Club in downtown Salmon, Idaho.
 -
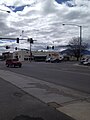 Intersection. Salmon, Idaho.


Demographics
| Census | Pop. | Note | %± |
|---|---|---|---|
| 1870 | 186 | — | |
| 1880 | 292 | 57.0% | |
| 1900 | 398 | — | |
| 1910 | 1,434 | 260.3% | |
| 1920 | 1,311 | −8.6% | |
| 1930 | 1,371 | 4.6% | |
| 1940 | 2,439 | 77.9% | |
| 1950 | 2,648 | 8.6% | |
| 1960 | 2,944 | 11.2% | |
| 1970 | 2,910 | −1.2% | |
| 1980 | 3,308 | 13.7% | |
| 1990 | 2,941 | −11.1% | |
| 2000 | 3,122 | 6.2% | |
| 2010 | 3,112 | −0.3% | |
| 2019 (est.) | 3,169 | [4] | 1.8% |
| U.S. Decennial Census [7] | |||
2010 census
At the 2010 census there were 3,112 people, 1,420 households, and 807 families living in the city. The population density was 1,335.6 inhabitants per square mile (515.7/km2). There were 1,628 housing units at an average density of 698.7 per square mile (269.8/km2). The racial makeup of the city was 96.5% White, 0.3% African American, 0.5% Native American, 0.6% Asian, 0.5% from other races, and 1.6% from two or more races. Hispanic or Latino of any race were 2.6%. [3]
Of the 1,420 households 25.6% had children under the age of 18 living with them, 41.4% were married couples living together, 11.3% had a female householder with no husband present, 4.1% had a male householder with no wife present, and 43.2% were non-families. 37.9% of households were one person and 16.3% were one person aged 65 or older. The average household size was 2.14 and the average family size was 2.80.
The median age was 45.7 years. 21.3% of residents were under the age of 18; 6.3% were between the ages of 18 and 24; 21.6% were from 25 to 44; 30% were from 45 to 64; and 20.9% were 65 or older. The gender makeup of the city was 49.3% male and 50.7% female.
2000 census
At the 2000 census there were 3,122 people, 1,369 households, and 829 families living in the city. The population density was 1,813.2 inhabitants per square mile (700.1/km2). There were 1,576 housing units at an average density of 915.3 per square mile (353.4/km2). The racial makeup of the city was 96.76% White, 0.19% African American, 0.54% Native American, 0.29% Asian, 0.61% from other races, and 1.60% from two or more races. Hispanic or Latino of any race were 2.18%. [8]
Of the 1,369 households 28.6% had children under the age of 18 living with them, 46.2% were married couples living together, 11.0% had a female householder with no husband present, and 39.4% were non-families. 34.6% of households were one person and 16.5% were one person aged 65 or older. The average household size was 2.26 and the average family size was 2.93.
The age distribution was 26.4% under the age of 18, 6.8% from 18 to 24, 23.9% from 25 to 44, 25.1% from 45 to 64, and 17.8% 65 or older. The median age was 40 years. For every 100 females, there were 92.2 males. For every 100 females age 18 and over, there were 89.1 males.
The median household income was $26,823 and the median family income was $34,844. Males had a median income of $30,417 versus $18,819 for females. The per capita income for the city was $15,749. About 15.5% of families and 19.5% of the population were below the poverty line, including 28.3% of those under age 18 and 14.3% of those age 65 or over.
Geography
Salmon is located at 45°10′41″N 113°54′10″W / 45.17806°N 113.90278°W (45.178110, –113.902660). [9] The elevation is 3,944 feet (1,202 m) above sea level.
According to the United States Census Bureau, the city has a total area of 2.37 square miles (6.14 km2), of which, 2.33 square miles (6.03 km2) is land and 0.04 square miles (0.10 km2) is water. [10]
The Salmon River passes through Salmon; whitewater rafters and other people interested in outdoor recreation have brought additional economic activity to Salmon. The Lemhi River flows into the Salmon River at Salmon.
Climate
Salmon experiences a semi-arid climate ( Köppen BSk) with cold, dry winters and hot, slightly wetter summers. The hottest temperature recorded in Salmon was 106 °F (41.1 °C) on July 21, 1936, while the coldest temperature recorded was −37 °F (−38.3 °C) on January 23, 1930 and January 21, 1937. [11]
| Climate data for Salmon, Idaho, 1991–2020 normals, extremes 1905–present | |||||||||||||
|---|---|---|---|---|---|---|---|---|---|---|---|---|---|
| Month | Jan | Feb | Mar | Apr | May | Jun | Jul | Aug | Sep | Oct | Nov | Dec | Year |
| Record high °F (°C) | 62 (17) |
68 (20) |
77 (25) |
89 (32) |
96 (36) |
103 (39) |
106 (41) |
103 (39) |
99 (37) |
87 (31) |
78 (26) |
62 (17) |
106 (41) |
| Mean maximum °F (°C) | 43.6 (6.4) |
50.1 (10.1) |
66.7 (19.3) |
77.1 (25.1) |
84.9 (29.4) |
92.2 (33.4) |
98.0 (36.7) |
96.1 (35.6) |
89.7 (32.1) |
76.9 (24.9) |
58.4 (14.7) |
46.0 (7.8) |
98.5 (36.9) |
| Mean daily maximum °F (°C) | 28.2 (−2.1) |
35.8 (2.1) |
49.5 (9.7) |
58.7 (14.8) |
68.3 (20.2) |
75.7 (24.3) |
86.3 (30.2) |
84.8 (29.3) |
74.3 (23.5) |
58.4 (14.7) |
40.8 (4.9) |
28.9 (−1.7) |
57.5 (14.2) |
| Daily mean °F (°C) | 19.6 (−6.9) |
26.0 (−3.3) |
37.5 (3.1) |
45.2 (7.3) |
54.0 (12.2) |
61.0 (16.1) |
69.0 (20.6) |
66.7 (19.3) |
57.4 (14.1) |
44.6 (7.0) |
31.2 (−0.4) |
20.9 (−6.2) |
44.4 (6.9) |
| Mean daily minimum °F (°C) | 11.0 (−11.7) |
16.3 (−8.7) |
25.5 (−3.6) |
31.6 (−0.2) |
39.7 (4.3) |
46.2 (7.9) |
51.6 (10.9) |
48.7 (9.3) |
40.6 (4.8) |
30.8 (−0.7) |
21.6 (−5.8) |
12.9 (−10.6) |
31.4 (−0.3) |
| Mean minimum °F (°C) | −6.1 (−21.2) |
−0.6 (−18.1) |
14.5 (−9.7) |
21.8 (−5.7) |
28.1 (−2.2) |
34.6 (1.4) |
43.5 (6.4) |
40.7 (4.8) |
30.1 (−1.1) |
18.2 (−7.7) |
7.5 (−13.6) |
−3.4 (−19.7) |
−10.5 (−23.6) |
| Record low °F (°C) | −37 (−38) |
−35 (−37) |
−20 (−29) |
2 (−17) |
16 (−9) |
20 (−7) |
26 (−3) |
22 (−6) |
13 (−11) |
−3 (−19) |
−14 (−26) |
−32 (−36) |
−37 (−38) |
| Average precipitation inches (mm) | 0.58 (15) |
0.37 (9.4) |
0.47 (12) |
0.77 (20) |
1.29 (33) |
1.63 (41) |
0.77 (20) |
0.60 (15) |
0.79 (20) |
0.81 (21) |
0.67 (17) |
0.73 (19) |
9.48 (242.4) |
| Average snowfall inches (cm) | 6.7 (17) |
3.8 (9.7) |
1.2 (3.0) |
0.4 (1.0) |
0.1 (0.25) |
0.0 (0.0) |
0.0 (0.0) |
0.0 (0.0) |
0.0 (0.0) |
0.1 (0.25) |
3.3 (8.4) |
6.4 (16) |
22.0 (56) |
| Average precipitation days (≥ 0.01 in) | 6.1 | 4.7 | 6.1 | 7.3 | 9.3 | 9.4 | 5.7 | 5.1 | 4.8 | 5.8 | 6.3 | 7.0 | 77.6 |
| Average snowy days (≥ 0.1 in) | 4.6 | 2.7 | 1.2 | 0.3 | 0.1 | 0.0 | 0.0 | 0.0 | 0.0 | 0.1 | 1.7 | 4.1 | 14.8 |
| Source 1: NOAA [12] | |||||||||||||
| Source 2: National Weather Service [11] | |||||||||||||
Education
Education in Salmon is provided by Salmon School District #291 [13] and the Upper Carmen Public Charter School.[ citation needed]
Media
Radio
KSRA (AM) 960 and KSRA-FM 92.7, both owned by Bitteroot Communications formerly Salmon River Communications, are licensed to Salmon.
Notable people
- J. D. Cannon, American actor, born in Salmon in 1922
- Dick Randolph, the first Libertarian elected to a U.S. state legislature; born in Salmon in 1936
- Sacagawea (also Sakakawea, Sacajawea; English pronunciation: /ˌsækədʒəˈwiːə/) (c. 1788 – December 20, 1812)
- Elmer Keith, creator of the .357 Magnum, .44 Magnum, and .41 Magnum
- J.D. Folsom, former Miami Dolphins linebacker
See also
References
- ^ "City of Salmon, Idaho". City of Salmon, Idaho. Retrieved September 2, 2012.
- ^ "2019 U.S. Gazetteer Files". United States Census Bureau. Retrieved July 9, 2020.
- ^ a b "U.S. Census website". United States Census Bureau. Retrieved December 18, 2012.
- ^ a b "Population and Housing Unit Estimates". United States Census Bureau. May 24, 2020. Retrieved May 27, 2020.
- ^ "Find a County". National Association of Counties. Retrieved June 7, 2011.
- ^ "Profile for Salmon, Idaho, ID". ePodunk. Retrieved September 2, 2012.
- ^ "Census of Population and Housing". Census.gov. Retrieved June 4, 2015.
- ^ "U.S. Census website". United States Census Bureau. Retrieved January 31, 2008.
- ^ "US Gazetteer files: 2010, 2000, and 1990". United States Census Bureau. February 12, 2011. Retrieved April 23, 2011.
- ^ "US Gazetteer files 2010". United States Census Bureau. Archived from the original on July 2, 2012. Retrieved December 18, 2012.
- ^ a b "NOAA Online Weather Data – NWS Pocatello". National Weather Service. Retrieved June 16, 2023.
- ^ "U.S. Climate Normals Quick Access – Station: Salmon-KSRA, ID". National Oceanic and Atmospheric Administration. Retrieved June 16, 2023.
- ^ "Salmon School District #291". Salmon School District #291. Retrieved September 2, 2012.
External links
- City of Salmon Idaho Website Portal style website, Government, Business, Library, Recreation and more
- City-Data.com Comprehensive Statistical Data and more about Salmon
- Salmon School District #291
Municipalities and communities of
Lemhi County, Idaho, United States | ||
|---|---|---|
| Cities |  | |
|
Unincorporated communities | ||
| International | |
|---|---|
| National | |