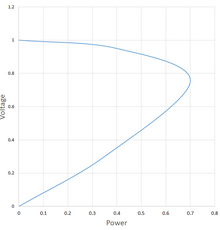
Power-voltage curve (also P-V curve) describes the relationship between the active power delivered to the electrical load and the voltage at the load terminals in an electric power system under a constant power factor. [1] When plotted with power as a horizontal axis, the curve resembles a human nose, thus it is sometimes called a nose curve. [2] The overall shape of the curve (similar to a parabola placed on its side) is defined by the basic electrical equations and does not change much when the characteristics of the system vary: leading power factor lead stretches the "nose" further to the right and upwards, while the lagging one shrinks the curve. [3] The curve is important for voltage stability analysis, as the coordinate of the tip of the nose defines the maximum power that can be delivered by the system.
As the load increases from zero, the power-voltage point travels from the top left part of the curve to the tip of the "nose" (power increases, but the voltage drops). The tip corresponds to the maximum power that can be delivered to the load (as long as sufficient reactive power reserves are available). Past this "collapse" point additional loads cause drop in both voltage and power, as the power-voltage point travels to the bottom left corner of the plot. [2] Intuitively this result can be explained when a load that consists entirely of resistors is considered: as the load increases (its resistance thus lowers), more and more of the generator power dissipates inside the generator itself (that has it own fixed resistance connected sequentially with the load). [4] Operation on the bottom part of the curve (where the same power is delivered with lower voltage – and thus higher current and losses) is not practical, as it corresponds to the "uncontrollability" region. [2]
If sufficient reactive power is not available, the limit of the load power will be reached prior to the power-voltage point getting to the tip of the "nose". The operator shall maintain a sufficient margin between the operating point on the P-V curve and this maximum loading condition, otherwise, a voltage collapse can occur. [5]
A similar curve for the reactive power is called Q-V curve. [1]
References
- ^ a b Van Cutsem & Vournas 2006, p. 95.
- ^ a b c Padiyar & Kulkarni 2018, p. 286.
- ^ Machowski, Bialek & Bumby 2011, p. 384.
- ^ Tang 2021, pp. 32–33.
- ^ Milano 2010, p. 106.
Sources
- Van Cutsem, Thierry; Vournas, Costas (2006). "Emergency Monitoring and Corrective Control of Voltage Instability: PV Curves and Maximum Load Power". Real-Time Stability in Power Systems: Techniques for Early Detection of the Risk of Blackout. Springer Science & Business Media. pp. 95-. ISBN 978-0-387-25626-9. OCLC 1039231417.
- Padiyar, K. R.; Kulkarni, Anil M. (31 December 2018). Dynamics and Control of Electric Transmission and Microgrids. John Wiley & Sons. p. 286. ISBN 978-1-119-17339-7. OCLC 1048018159.
- Machowski, Jan; Bialek, Janusz W.; Bumby, Jim (31 August 2011). Power System Dynamics: Stability and Control (2 ed.). John Wiley & Sons. ISBN 978-1-119-96505-3. OCLC 1037459298.
- Milano, Federico (8 September 2010). Power System Modelling and Scripting. Springer Science & Business Media. p. 106. ISBN 978-3-642-13669-6. OCLC 1005815809.
- Tang, Yong (7 April 2021). Voltage Stability Analysis of Power System. Springer Nature. pp. 32–33. ISBN 978-981-16-1071-4. OCLC 1246238334.