From Wikipedia, the free encyclopedia
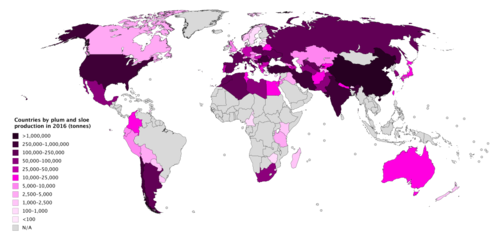
Countries by plum and sloe production in 2016
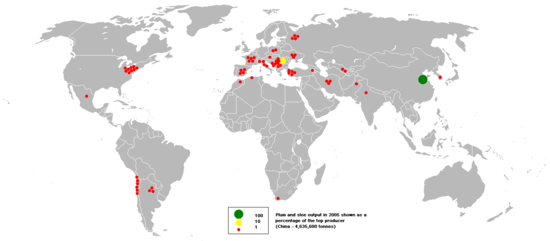
A map of world plum and sloe production, 2005
This is a list of countries by
plum and
sloe production from 2016-2022, based on data from the
Food and Agriculture Organization Corporate Statistical Database
[1] . The estimated total world production of plum and sloe in 2022 was 12,391,467
metric tonnes , up 1% from 12,209,265 tonnes in 2021
[1] . China was by far the largest producer, accounting for just over 54% of global production
[1] .
Production by country >100,000 tonnes
Rank
Country/region
2022
2021
2020
2019
2018
2017
2016
1
China 6,752,221
6,777,011
6,761,754
6,717,899
6,851,378
6,715,985
6,586,334
—
European Union
[1] 1,472,320
1,571,810
1,639,710
1,625,030
1,763,740
1,290,877
1,479,674
2
Romania 665,730
807,170
757,880
692,670
830,060
444,922
512,975
3
Serbia 488,593
412,778
582,547
558,930
430,199
330,582
471,442
4
Chile 424,887
420,766
414,129
445,000
359,000
357,600
353,000
5
Turkey 348,750
332,533
329,056
317,946
296,878
291,934
297,589
6
Iran 332,231
324,447
341,291
359,176
305,617
355,416
298,893
7
Bosnia and Herzegovina 306,880
131,574
159,197
114,415
190,386
74,398
131,579
8
United States 279,500
303,270
245,380
327,950
345,000
402,250
240,770
9
India 232,481
10
Russia 212,300
197,600
182,000
174,000
165,800
133,200
151,700
11
Italy 187,350
137,770
156,290
215,020
197,730
206,966
220,729
12
Morocco 178,865
178,761
143,457
151,488
205,222
179,387
123,577
13
Uzbekistan 177,602
143,351
130,092
133,078
134,869
115,966
121,012
14
Ukraine 168,610
188,300
173,230
181,140
198,070
200,470
178,320
15
Spain 157,370
179,320
153,590
179,840
152,980
172,325
193,598
16
Poland 133,200
117,400
117,400
94,950
121,080
38,403
109,503
17
South Africa 111,227
101,969
65,373
62,557
74,254
77,408
87,746
18
Argentina 101,874
60,684
64,825
52,517
176,000
39,110
150,229
19
Moldova 100,200
136,100
103,173
131,947
132,754
93,182
99,716
10,000–100,000 tonnes
Rank
Country/region
2022
2021
2020
2019
2018
2017
2016
20
France 99,990
106,280
225,900
205,110
175,440
211,142
229,990
21
Algeria 99,048
97,056
98,908
113,085
111,471
111,797
102,692
22
Mexico 88,163
84,182
90,438
72,902
84,447
83,607
77,931
23
Pakistan 59,676
60,280
52,075
51,276
47,701
46,423
45,863
24
Bulgaria 56,650
65,120
60,020
56,190
56,430
49,194
48,630
25
Libya 54,924
54,997
54,796
54,978
55,218
54,191
55,525
26
South Korea 52,616
50,257
50,028
51,087
53,794
62,778
63,776
27
Germany 51,370
44,460
51,320
52,140
70,120
23,885
37,783
28
Afghanistan 45,890
57,336
29,872
38,321
35,971
31,844
18,504
29
Albania 45,141
41,186
41,708
40,928
41,241
42,437
40,180
30
Azerbaijan 41,140
39,149
37,174
36,951
36,415
33,559
28,793
31
Macedonia 39,512
27,031
34,983
32,303
37,719
17,880
33,684
32
Lebanon 38,150
39,190
38,367
36,894
35,566
37,612
42,181
33
Hungary 34,970
33,250
27,040
45,250
46,690
43,295
47,560
34
Armenia 34,204
25,000
24,961
23,229
21,164
24,016
15,684
35
Turkmenistan 33,873
33,837
33,801
33,796
33,760
33,550
33,550
36
Greece 24,380
21,410
21,200
20,540
28,790
19,183
20,570
37
Egypt 23,703
46,653
17,280
16,450
14,429
14,883
12,187
38
Syria 23,082
21,539
25,888
26,808
31,289
31,294
31,109
39
Tunisia 20,000
18,500
20,000
19,000
14,000
13,600
15,500
40
Israel 19,000
17,000
20,970
25,000
22,700
24,500
19,500
41
Japan 18,800
18,800
16,500
18,100
23,100
19,600
23,000
42
Colombia 18,734
18,460
16,420
16,904
16,565
18,092
16,703
43
Australia 18,310
18,445
18,612
18,640
18,548
18,701
17,992
44
Portugal 17,770
22,350
19,180
20,800
17,480
29,784
26,067
45
Yemen 17,214
14,825
12,236
10,023
8,126
46
Georgia 16,400
10,100
11,300
4,200
9,500
3,800
8,500
47
Iraq 13,138
14,994
16,584
15,351
4,464
3,579
3,421
48
Kyrgyzstan 12,351
12,309
12,329
12,414
12,185
12,389
12,667
49
Belarus 12,185
15,373
15,632
12,759
27,681
3,293
22,228
50
Czechia 10,680
6,980
8,820
8,760
12,920
4,065
5,998
51
Croatia 10,640
5,200
11,450
9,060
12,540
8,209
9,420
52
Austria 10,500
13,850
17,860
12,780
29,560
9,721
7,783
53
Nepal 10,445
10,134
11,737
10,375
9,887
9,119
10,563
1,000–10,000 tonnes
Rank
Country/region
2022
2021
2020
2019
2018
2017
2016
54
Taiwan 8,968
10,848
10,481
8,090
13,080
12,787
13,727
55
Kazakhstan 8,893
10,398
10,185
9,667
8,312
6,701
5,410
56
Ecuador 8,751
8,733
8,715
8,830
8,810
8,775
8,756
57
Netherlands 6,400
6,510
6,800
6,870
6,500
5,570
5,366
58
Switzerland 6,338
3,021
9,446
7,198
14,263
3,985
5,766
59
Peru 6,078
7,798
6,861
7,841
8,483
7,413
9,031
60
Jordan 4,333
4,023
3,683
4,150
3,366
3,070
7,051
61
Bolivia 4,209
4,022
4,094
4,530
4,189
4,208
2,989
62
Tajikistan 4,143
3,983
3,539
3,500
3,500
3,500
3,500
63
United Kingdom 4,099
3,600
8,319
7,371
8,680
8,000
9,230
64
Tanzania 4,041
4,054
4,052
4,019
4,091
4,046
3,919
65
Canada 3,788
3,665
2,993
4,096
3,643
4,364
3,092
66
Madagascar 2,356
2,349
2,368
2,351
2,328
2,298
2,265
67
Uruguay 2,162
2,440
2,292
2,560
2,324
2,055
1,259
68
Norway 2,014
2,533
724
2,568
1,948
1,859
1,859
69
Paraguay 1,981
1,968
1,956
1,943
1,952
1,929
1,899
70
Cyprus 1,550
1,700
1,600
1,210
1,190
1,632
1,178
71
Eswatini 1,446
1,446
1,445
1,408
1,461
1,487
1,505
72
New Zealand 1,340
1,818
1,829
1,602
1,611
1,405
1,782
73
Slovakia 1,260
1,540
1,260
1,790
2,190
993
494
74
Montenegro 1,116
1,229
842
722
1,379
1,045
1,588
75
Kenya 1,029
1,074
448
557
807
1,046
1,952
<1,000 tonnes
Rank
Country/region
2022
2021
2020
2019
2018
2017
2016
76
Lithuania 830
440
530
470
380
409
823
77
Grenada 757
755
753
751
745
743
744
78
Cameroon 619
623
620
614
635
611
597
79
Palestine 522
626
1,120
1,431
1,838
2,300
2,336
80
Slovenia 450
150
620
420
580
208
330
81
Denmark 330
320
290
450
390
359
330
82
Bhutan 312
257
439
585
532
482
376
83
Sweden 290
270
190
250
250
250
200
84
Zimbabwe 266
267
267
265
269
266
261
85
Belgium 200
70
150
130
100
17
12
86
Luxembourg 180
110
190
170
170
23
12
87
Malawi 149
149
150
150
150
152
88
Latvia 110
100
100
60
100
58
104
89
Estonia 60
30
20
60
30
266
210
90
Malta 60
10
10
40
40
External links Notes
References

