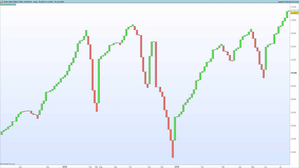
A line break chart, also known as a three-line break chart, is a Japanese trading indicator and chart used to analyze the financial markets. [1] Invented in Japan, these charts had been used for over 150 years by traders there before being popularized by Steve Nison in the book Beyond Candlesticks. [1] [2] The chart is made up of vertical blocks or bars called "lines", which indicate the market's direction. [3]
Function
Similar to other financial charts invented in Japan such as Kagi charts and Renko charts, line break charts evolve based in large part on price and in lesser part on time. [4] The more widely used candlestick charts are based on a strictly uniform time scale where each new candle evolves after a certain time period. [5] Unlike candlesticks however, line break charts also do not contain "wicks" on each bar or line as there are no high or low values. [4]

Line break charts contain an “up line” and a “down line” which are normally distinguished using different colors, e.g., an up line can be represented by a green line and a down line can be represented by a red line. [6] A new up line is added when the previous high is exceeded by the underlying chart's close and a down line is added when the previous low is exceeded by the underlying chart's close. [7] If neither previous high (in an uptrend) nor previous low (in a downtrend) is breached by the underlying chart's close, nothing is add to the chart. The closing price is what dictates whether or not a previous line has been exceeded. [8] [7]
Three-line break
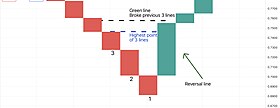
A more common version of line break charts is a “three-line break” chart, which indicates that for a market reversal to occur (a new line that forms in the opposite direction to the previous lines), the price will have to break above or below the previous three lines depending on the direction of the lines. [9] This therefore ensures that a market reversal (a change from downtrend to uptrend or vice versa) is determined only by a large enough move in price. [1] [3]

A trend is confirmed after three consecutive lines going in the same direction. [10] For example, an uptrend will be confirmed once three consecutive up lines are formed. [3] This shows that each new line has extended the trend and so the price continues in the same direction. [11]
Other forms
Line break charts can be adjusted depending on the trading strategy, this is knows as "adjusting the sensitivity." [12] Adjusting the sensitivity involves changing the number of lines the market has to break before a reversal line is drawn. [13] Modern charting software (like MetaTrader 4 or TradingView) allow building line break charts using any number of lines required for reversals. [14] The less common two line break chart indicates that the trend has reversed once the previous two up or down lines have been broken. Charts with higher sensitivity such as two line break and three line break are generally used by shorter-term traders looking for small and quick market reversals. Charts with lower sensitivity such as four to ten line break are generally used by longer-term traders who target only major market moves. [12]

Patterns
A short down line is called a shoe, an upwards reversal line (up line that broke the previous three down lines) is called a suit, and a short up line that emerges immediately from an upwards reversal line is called a neck. [15]
In some strategies traders will look for a neck as a buy signal as an up line after a market reversal indicates that the trend has changed from a downtrend to an uptrend with the neck serving as an extra "bullish confirmation." [15]
References
- ^ a b c "What Are Line Break Charts & How To Trade Them". The Forex Geek. 2022-09-29. Retrieved 2024-03-06.
- ^ Nison 1994, p. 167.
- ^ a b c "Three Line Break Charts". StockCharts. Retrieved 2024-03-06.
- ^ a b "Line Break Charts Explained Plus A Simple Trading Strategy". NetPicks. 2017-03-20. Retrieved 2024-03-06.
- ^ Farley, Alan (2024-02-21). "What Is a Candlestick Pattern?". Investopedia. Retrieved 2024-03-06.
- ^ "Line Break Charts". Barchart. Retrieved 2024-03-06.
- ^ a b "Line Break Chart". TradeStation. Retrieved 2024-03-06.
- ^ Nison 1994, p. 169-172.
- ^ Ursell, Mark (2015-06-15). "How To Trade 3 Line Break Charts Profitably". www.tradinformed.com. Retrieved 2024-03-06.
- ^ Nison 1994, p. 172-173.
- ^ "Three Line Break Chart Review | How to Trade Profitably with Charts?". A Digital Blogger. 2019-02-11. Retrieved 2024-03-06.
- ^ a b "Three Line Break". MarketInOut.com. Retrieved 2024-03-06.
- ^ Nison 1994, p. 181-184.
- ^ "Line Break Charts 101". www.earnforex.com. Retrieved 2024-03-06.
- ^ a b Nison 1994, p. 184-187.
Bibliography
- Nison, Steve (1994). Beyond Candlesticks. Wiley. ISBN 9780471007203.