This article may be
too long to read and navigate comfortably. (September 2022) |
Hydrogen isotope biogeochemistry is the scientific study of biological, geological, and chemical processes in the environment using the distribution and relative abundance of hydrogen isotopes. There are two stable isotopes of hydrogen, protium 1H and deuterium 2H, which vary in relative abundance on the order of hundreds of permil. The ratio between these two species can be considered the hydrogen isotopic fingerprint of a substance. Understanding isotopic fingerprints and the sources of fractionation that lead to variation between them can be applied to address a diverse array of questions ranging from ecology and hydrology to geochemistry and paleoclimate reconstructions. Since specialized techniques are required to measure natural hydrogen isotope abundance ratios, the field of hydrogen isotope biogeochemistry provides uniquely specialized tools to more traditional fields like ecology and geochemistry.
History of hydrogen isotopes
Earliest work
The study of hydrogen stable isotopes began with the discovery of deuterium by chemist Harold Urey [1] of the famous Urey and Miller experiment. Even though the neutron was not realized until 1932, [2] Urey began searching for "heavy hydrogen" in 1931. Urey and his colleague George Murphy calculated the redshift of heavy hydrogen from the Balmer series and observed very faint lines on a spectrographic study. To intensify the spectroscopic lines for publishable data, Murphy and Urey paired with Ferdinand Brickwedde and distilled a more concentrated pool of heavy hydrogen, known today as deuterium. This work on hydrogen isotopes won Urey the 1934 Nobel Prize in Chemistry. [3]

Also in 1934, scientists Ernest Rutherford, Mark Oliphant, and Paul Harteck, produced the radioactive isotope tritium by hitting deuterium with high energy nuclei. The deuterium used in the experiment was a generous gift of heavy water from the Berkeley physicist Gilbert N Lewis. [4] Bombarding deuterium produced two previously undetected isotopes, helium-3 and hydrogen-3. Rutherford and his colleagues successfully created tritium, but incorrectly assumed that helium-3 was the radioactive component. The work of Luis Walter Alvarez and Robert Cornog [5] first isolated tritium and reversed Rutherford's incorrect notion. Alvarez reasoned that tritium was radioactive, but did not measure the half-life, although calculations at the time suggested over ten years. At the end of World War II, the physical chemist Willard Libby detected the residual radioactivity of a tritium sample with a Geiger counter, [4] providing a more accurate understanding of the half-life, now accepted at 12.3 years. [6]
Impact on physical chemistry
The discovery of hydrogen isotopes also impacted the field of physics in the 1940s, as Nuclear Magnetic Resonance (NMR) spectroscopy was first invented. Today, organic chemists utilize NMR for mapping protein interactions [7] or identifying small compounds, [8] but NMR was first a passion project of physicists. All three isotopes of hydrogen were found to have magnetic properties suitable for NMR spectroscopy. The first chemist to fully express an application of NMR was George Pake, who measured gypsum () as a crystal and powder. [9] The signal observed, called the Pake doublet, was from the magnetically active hydrogens in water. Pake then calculated the proton-proton bond distance. NMR measurements were further revolutionized when commercial machines became available in the 1960s. Before this, NMR experiments involved constructing massive projects, locating large magnets, and hand wiring miles of copper coil. [10] Proton NMR remained the most popular technique throughout advancements in following decades, but deuterium and tritium were used in other flavors of NMR spectroscopy. Deuterium has a different magnetic moment and spin than protium, but generally a much smaller signal. Historically, deuterium NMR is a poor alternative to proton NMR, but has been used to study the behavior of lipids on membranes. [11] Recently, a variation of deuterium NMR called 2H-SNIF has shown potential for understating position specific isotope compositions and comprehending biosynthetic pathways. [12] Tritium is also used in NMR, [13] as it is the only nucleus more sensitive than protium, generating very large signals. However, tritium's radioactivity discouraged many studies of T-NMR.

While tritium radioactivity discourages use in spectroscopy, the energy from decay is essential for nuclear weapons. Scientists began understanding nuclear energy as early as the 1800s, but large advancements were made in studies of the atomic bomb in the early 1940s. War time research, especially the Manhattan project, greatly accelerated scientific understanding of radioactivity. Tritium is a byproduct in reactors, a result of hitting lithium-6 with neutrons, producing almost 5 MeV of energy.


In boosted-fission nuclear weapons a mixture of deuterium and tritium are heated until there is thermonuclear fission to produce helium and release free neutrons. [14] The flurry of fast neutron particles would then excite further fission reactions with uranium, creating a "boosted" nuclear bomb. In 1951, during Operation Greenhouse, a prototype named George, successfully validated the proof of concept for such a weapon. [15] However, the first true boosted fission nuclear device, Greenhouse Item, was successfully tested in 1952, generating 45.5 kilotons of explosive yield, nearly double the value of an un-boosted system. [15] The United States stopped producing tritium in nuclear reactors in 1988, [16] but nuclear weapons testing in the 1950s added large spikes of radioactive elements to the atmosphere, especially radiocarbon and tritium. [17] [18] This complicated measurements for geologists using radiometric dating of carbon. However, some oceanographers benefited from the tritium increase, utilizing the signal in the water to trace physical mixing of water masses. [19]
Impact on biogeochemistry
In biogeochemistry, scientists focused primarily on the stable isotope of deuterium as a tracer for environmental processes, especially the water cycle. The American geochemist Harmon Craig, once a graduate student of Urey's, discovered the relationship between rainwater's hydrogen and oxygen isotope ratios. The linear correlation between the two heavy isotopes is conserved worldwide and referred to as the Global Meteoric Water Line. [20] By the late 1960s, the focus of hydrogen isotopes shifted away from water and towards organic molecules. Plants use water to form biomass, but a 1967 study by Zebrowski, Ponticorvo, and Rittenberg found that the organic material in plants had less deuterium than the water source. [21] Zebrowski's research measured the deuterium concentration of fatty acids and amino acids derived from sediments in the Mohole drilling project. Further studies by Bruce Smith and Samuel Epstein in 1970 confirmed the depletion of deuterium in organics compared to environmental water. [22] Another duo in 1970, Schiegl and Vogel, analyzed the composition of hydrogen isotopes as water became biomass, as biomass became coal and oil, and as oil became natural gas. [23] In each step they found deuterium further depleted. A landmark paper in 1980 by Marilyn Epstep, now M. Fogel, and Thomas Hoering titled "Biogeochemistry of the stable hydrogen isotopes" refined the links between organic materials and sources. [24]
In this early stage of hydrogen stable isotope study, most isotope compositions or fractionations were reported as bulk measurements of all organic material or all inorganic material. Some exceptions include cellulose [25] [26] and methane, [27] as these compounds are easily separated. Another advantage of methane for compound specific measurements is the lack of hydrogen exchange. Cellulose has exchangeable hydrogen, but chemical derivatization can prevent swapping of cellulose hydrogen with water or mineral hydrogen sources. Cellulose and methane studies in the 1970s and 1980s set the standard for modern hydrogen isotope geochemistry.
Measurements of individual compounds was made possible in the late 1990s and early 2000s with advancements in mass spectrometry. [28] The Thermo Delta+XL transformed measurements as the first instrument capable of compound specific isotope analysis. It was then possible to look at smaller samples with more precision. Hydrogen isotope applications quickly emerged in petroleum geochemistry by measuring oil, paleoclimatology by observing lipid biomarkers, and ecology by constructing trophic dynamics. Modern advances are currently underway in the clumped isotope composition of methane [29] after development of the carbonate thermometer. [30] [31] Precise measurements are also enabling focus on microbial biosynthetic pathways involving hydrogen. [32] Ecologists studying trophic levels are especially interested in compound specific measurements for construction of past diets and tracing predator-prey relationships. [33] Highly advanced machines are now promising position specific hydrogen isotope analysis of biomolecules and natural gases. [34]
Important concepts
Stable vs radioactive isotopes
All isotopes of a chemical element contain the same number of protons with varying numbers of neutrons. The element hydrogen has three naturally occurring isotopes, 1H, 2H and 3H, which are sometimes referred to as protium (H), deuterium (D) and tritium (T), respectively. Both 1H and 2H are stable indefinitely, while 3H is unstable and undergoes beta decay to form 3He. While there are some important applications of 3H in geochemistry (such as its use as an ocean circulation tracer) these will not be discussed further here.
Isotope notation
The study of stable isotope biogeochemistry involves the description of the relative abundances of various isotopes in a certain chemical pool, as well as the way in which physicochemical processes change the fraction of those isotopes in one pool vs. another. Various type of notation have been developed to describe the abundance and change in the abundance of isotopes in these processes, and these are summarized below. In most cases only the relative amounts of an isotope are of interest, the absolute concentration of any one isotope is of little importance.
Isotope ratio and fractional abundance
The most fundamental description of hydrogen isotopes in a system is the relative abundance of deuterium and protium. This value can be reported as the isotope ratio 2R or the fractional abundance 2F defined as:

and

where 2H and 1H are the amounts of deuterium and protium, respectively. Fractional abundance is equivalent to mole fraction, and yields atom percent when multiplied by 100. In some instances atom percent excess is used, which reports the atom percent of a sample minus the atom percent of a standard.
Delta (δ) notation
Isotope ratios for a given substance are often reported compared to a standard with known isotopic composition, and measurements of relative masses are always made in conjuncture with measuring a standard. In the case of hydrogen the Vienna Standard Mean Ocean Water standard is used which has an isotope ratio of 155.76 ±0.1 ppm. The delta value as compared to this standard is defined as:

These delta values are often quite small, and are usually reported as per mil values (‰) which come from multiplying the above equation by a factor of 1000.
Measures of fractionation
The study of hydrogen isotope biogeochemistry relies on the fact that various physicochemical processes will preferentially enrich or deplete deuterium relative to protium (see kinetic isotope effect, etc.). There are various measures that have been developed to describe the fractionation in an isotope between two pools, often the product and reactant of a physiochemical process. α notation describes the difference between two hydrogen pools A and B with the following equation:

where δ2HA is the delta value of pool A relative to VSMOW. As many delta values do not vary greatly from one another the α value is often very close to unity. A related measure called epsilon (ε) is often used which is given simply by:

These values are often very close to zero, and are reported as per mill values by multiplying α-1 by 1000. One final measure is Δ, pronounced "cap delta", which is simply:

Conservation of mass in mixing calculations
As discussed above, deuterium and protium are stable isotopes which never undergo radioactive decay. Therefore, the D/H ratio of a pool containing hydrogen will remain constant as long as no hydrogen is added or removed from the system, a property known as conservation of mass. When two pools of hydrogen A and B mix with molar amounts of hydrogen mA and mB, each with their own starting fractional abundance of deuterium (FA and FB), then the fractional abundance of the resulting mixture is given by the following exact equation:

The terms with Σ represent the values for the combined pools. It is often common to find the following approximation used for calculations regarding the mixing of two pools with a known isotopic composition:

This approximation is convenient and applicable with little error in most applications having to deal with pools of hydrogen from natural processes. The maximum difference between the calculated delta value with the approximate and exact equations is given by the following equation:
![{\displaystyle \delta _{error}=(R_{std})[(\delta _{A}-\delta _{B})/2]^{2}}](https://wikimedia.org/api/rest_v1/media/math/render/svg/b9e75bbdba61b6e69549fea3e203581ccaca9704)
This error is quite small for nearly all mixing of naturally occurring isotope values, even for hydrogen which can have quite large natural variations in delta values. [35] The estimation is usually avoided when unnaturally large isotope delta values are encountered, which is particularly common in isotopic labeling experiments.
Naturally occurring isotope variation
Natural processes result in broad variations in the D/H ratio found in different pools of hydrogen. Kinetic isotope effects and physical changes such as precipitation and evaporation lead to these observed variations. Ocean water varies slightly, between 0 and −10 per mil, while atmospheric water can be found to vary between approximately −200 to +100 per mil. Biomolecules synthesized by organisms will retain some of the D/H signature of the water which they were grown on, plus a large fractionation factor which can be as great as several hundred per mil. Large D/H differences amounting to thousands of per mil can be found between Earth and other planetary bodies such as Mars, likely due to variations in isotope fractionation during planet formation and the physical loss of hydrogen to space.
List of well known fractionation effects
A number of common processes fractionate hydrogen isotopes to produce the isotope variations found in nature. Common physical processes include precipitation and evaporation. Chemical reactions also have the potential to heavily influence the partitioning of heavy and light isotopes between pools. The rate of a chemical reaction depends in part on the energies of the chemical bonds being formed and broken in the reaction. Since different isotopes have different masses, the bond energies are different between different isotopologues of a chemical species. This will result in a difference in the rate of a reaction for the different isotopologues, resulting in a fractionation of the different isotopes between the reactant and product in a chemical reaction. This is known as the kinetic isotope effect. A classic example of such an isotope effect is the D/H ratio difference in the equilibrium between H2O and H2 which can have an alpha value of as much as 3–4. [36]
Isotope ratio as tracer for fingerprint
In many areas of study the origin of a chemical or group of chemicals is of central importance. Questions such as the source of environmental pollutants, the origin of hormones in an athlete's body, or the authenticity of foods and flavorings are all examples where chemical compounds need to be identified and sourced. Hydrogen isotopes have found uses in these and many other diverse areas of study. Since many processes can affect the D/H ratio of a given chemical compound this ratio can be a diagnostic signature for compounds produced in a specific location or via a certain process. Once the D/H ratios of a number of sources are known the measurement of this ratio for a sample of unknown origin can often be used to link it back to a certain source or production method.
Physical chemistry
Hydrogen isotope formation
Protium or hydrogen-1, with one proton and no neutrons, is the most abundant element in the Solar System, formed in the earliest rounds of stellar explosions after the Big Bang. [37] After the universe exploded into life, the hot and dense cloud of particles began to cool, first forming subatomic particles like quarks and electrons, which then condensed to form protons and neutrons. Elements larger than hydrogen and helium were produced with successive stars, forming from the energy released during supernovae.
Deuterium or hydrogen-2, with one proton and one neutron, is also known to have cosmic origin. Like protium, deuterium was produced very early in the universe's history during the Big Bang nucleosynthesis. As protons and neutrons combined, helium-4 was produced with a deuterium intermediate. Alpha reactions with helium-4 produce many of the larger elements that dominate today's solar system. However, before the universe cooled, high-energy photons destroyed any deuterium, preventing larger element formation. This is referred to as the deuterium bottleneck, a restriction on the timeline for nucleosynthesis. All of today's deuterium originated from this proton-proton fusion after sufficient cooling. [38]
Tritium, or hydrogen-3, with one proton and two neutrons, was produced by proton and neutron collisions in the early universe as well, but it has since radioactively decayed to helium-3. Modern tritium cannot be explained by Big Bang nucleosynthesis because of tritium's short half-life of 12.3 years. Today's tritium concentration is instead governed by nuclear reactions and cosmic rays. The radioactive beta decay of tritium to helium releases an electron and an antineutrino, with an average energy release of 18.6 MeV. It is important to note that this is classified as a relatively weak beta reaction, so the radioactivity cannot permeate skin. Tritium is thus only hazardous if directly ingested or inhaled. [39]

Quantum properties
Protium is a spin-½ subatomic particle and is therefore a fermion. Other fermions include neutrons, electrons, and the radioactive isotope tritium. Fermions are governed by Pauli's exclusion principle, where no two particles can have the same quantum number. [40] [41] However, bosons like deuterium and photons, are not bound by exclusion and multiple particles can occupy the same energy state. This fundamental difference in 1H and 2H manifests in many physical properties. Integer spin particles like deuterium follow Bose-Einstein statistics while fermions with half integer spins follow Fermi-Dirac statistics. Wave functions that describe multiple fermions must be antisymmetric with respect to swapping particles, while boson wave functions are symmetric. [42] Because bosons are indistinguishable and can occupy the same state, collections of bosons behave very differently than fermions at colder temperatures. As bosons are cooled and relaxed to the lowest energy state, phenomena like superfluidity and superconductivity occur. [43]
Kinetic and equilibrium isotope effects
Isotopes differ according to their number of neutrons, which directly impacts physical properties based on mass and size. Typical hydrogen is called hydrogen-1 or protium and has no neutrons. Deuterium or hydrogen-2 has one neutron and tritium or hydrogen-3 has two neutrons. These additional neutrons significantly impact the mass of the element, leading to different chemical physical properties. This effect is especially prevalent in hydrogen isotopes, since addition of a neutron doubles the mass from protium to deuterium. For higher order elements like carbon, oxygen, nitrogen, or sulfur, the mass difference is diluted.
Physical chemists often model bonding with the quantum harmonic oscillator, simplifying a hydrogen-hydrogen bond as two balls connected by a spring. [41] [44] The quantum harmonic oscillator is itself based on Hooke's Law and acts as a good approximation of the Morse potential that accurately describes bonding. Modeling hydrogen and deuterium in a chemical reaction demonstrates the energy distributions of isotopes in products and reactants. Lower energy levels for the heavier isotope deuterium can be explained mathematically by the harmonic oscillator's dependence on the inverse of the reduced mass, denoted μ. Thus, a larger reduced mass is a larger denominator and thus a smaller zero point energy and a lower energy state in the quantum well.

- Calculating the reduced mass of a hydrogen-hydrogen bond versus a deuterium-deuterium bond gives:


- The quantum harmonic oscillator has energy levels of the following form, where k is the spring constant and h is Planck's constant. [41]

The effects of this energy distribution manifest in the kinetic isotope effect and the equilibrium isotope effect. [45] In a reversible reaction, under equilibrium conditions, the reaction will proceed forwards and backwards, distributing the isotopes to minimize thermodynamic free energy. Some time later, at equilibrium, more heavy isotopes will be on the product side. The stability of the lower energy drives the products to be enriched in deuterium relative to reactants. Conversely, under kinetic conditions, reactions are generally irreversible. The limiting step in the reaction is overcoming the activation energy barrier to reach an intermediate state. The lighter isotope has a higher energy state in the quantum well and will thus be preferentially formed into products. Thus under kinetic conditions the product will be relatively depleted in deuterium.
Kinetic isotope effects are common in biological systems and are especially important for hydrogen isotope biogeochemistry. Kinetic effects usually result in larger fractionations than equilibrium reactions. In any isotope system, kinetic effects are stronger for larger mass differences. Light isotopes in most systems also tend to move faster but form weaker bonds. At high temperatures, entropy explains a large signal in isotope composition. However, when temperature decreases isotope effects are more expressed and randomness plays less of a role. These general trends are exposed in further understanding of bond breaking, diffusion or effusion, and condensation or evaporation reactions.
Chemistry of hydrogen exchange
One of the major complications in studying hydrogen isotopes is the issue of exchangeability. At many time scales, ranging from hours to geological epochs, scientists have to consider if the hydrogen moieties in studied molecules are the original species or if they represent exchange with water or mineral hydrogen near by. Research in this area is still inconclusive in regards to rates of exchange, but it is generally understood that hydrogen exchange complicates the preservation of information in isotope studies.
Rapid exchange
Hydrogen atoms easily separate from electronegative bonds such as hydroxyl bonds (O-H), nitrogen bonds (N-H), and thiol/ mercapto bonds (S-H) on hour to day long timescales. This rapid exchange is particularly problematic for measurements of bulk organic material with these functional groups because isotope compositions are more likely to reflect the source water and not the isotope effect. For this reason, records of paleoclimate that are not measuring ancient waters, rely on other isotopic markers. Advancements in the 1990s held promising potential to resolve this problem: samples were equilibrated with two variations of heavy water and compared. Their ratios represent an exchange factor that can calibrate measurements to correct for hydrogen and deuterium swapping. [46]
Carbon bound hydrogen exchange
For some time, researchers believed that large hydrocarbon molecules were impervious to hydrogen exchange, but recent work has identified many reactions that allow isotope reordering. The isotopic exchange becomes relevant at geological time scales and has impacted work of biologists studying lipid biomarkers as well as geologists studying ancient oil. Reactions responsible for exchange include [46] [47]

- Radical reactions that cleave C-H bonds.
- Ionic exchange that of tertiary and aromatic hydrogen.
- Enolizations that activate hydrogens on ketone alpha carbons.
- Stereochemical exchange that causes stereochemical inversion.
- Constitutional exchange like methyl shifts, double bond migrations and carbon backbone rearrangements.
Detailed kinetics of these reactions have not been determined. However, it is known that clay minerals catalyze ionic hydrogen exchange faster than other minerals. [48] Thus hydrocarbons formed in clastic environments exchange more than those in carbonate settings. Aromatic and tertiary hydrogen also have greater exchange rates than primary hydrogen. This is due to the increasing stability of associated carbocations. [49] Primary carbocations are considered too unstable to physically exist and have never been isolated in an FT-ICR spectrometer. [50] On the other hand, tertiary carbocations are relatively stable and are often intermediates in organic chemistry reactions. This stability, which increases the likelihood of proton loss, is due to the electron donation of nearby carbon atoms. Resonance and nearby lone pairs can also stabilize carbocations via electron donation. Aromatic carbons are thus relatively easy to exchange.
Many of these reactions have a strong temperature dependence, with higher temperatures typically accelerating exchange. However, different mechanisms may prevail at each temperature window. Ionic exchange, for example, has the most significance at low temperatures. In such low temperature environments, there is potential for preserving the original hydrogen isotope signal over hundreds of millions of years. [51] However, many rocks in geologic time have reached significant thermal maturity. Even by the onset of the oil window it appears that much of the hydrogen has exchanged. Recently, scientists have explored a silver lining: hydrogen exchange is a zero order kinetic reaction (for carbon bound hydrogen at 80–100 °C, the half-times are likely 104 – 105 years). [51] Applying the mathematics of rate constants would allow extrapolation to original isotopic compositions. While this solution holds promise, there is too much disagreement in the literature for robust calibrations.
Vapor isotope effects
Vapor isotope effects occur for protium, deuterium, and tritium, because each isotope has different thermodynamic properties in the liquid and gaseous phases. [52] For water molecules, the condensed phase is more enriched while the vapor is more depleted. For example, rain condensing from a cloud will be heavier than the vapor starting point. Generally, the large variations in deuterium concentrations of water are from the fractionations between liquid, vapor, and solid reservoirs. In contrast to the fractionation pattern of water, non-polar molecules like oils and lipids, have gaseous counterparts enriched with deuterium relative to the liquid. [28] This is thought to be associated with the polarity from hydrogen bonding in water that does not interfere in long-chain hydrocarbons.
Observed variations in isotope abundance
This article may require
cleanup to meet Wikipedia's
quality standards. The specific problem is: δD is used over and over again without being defined; it might also be worth translating into a simpler measure of relative or absolute abundance for less technical readers. (May 2019) |

Due to physical and chemical fractionation processes, the variations in the isotopic compositions of elements are reported, and the standard atomic weights of hydrogen isotopes have been published by the Commission on Atomic Weights and Isotopic Abundances of the IUPAC. The ratios of stable H isotopes are reported relative to the International Atomic Energy Agency (IAEA) reference water. In the equilibrium isotope reactions of Hydrogen and Deuterium in general, enrichment of the heavy isotope is observed in the compound with the higher oxidation state. However, in our natural environment, the isotopic composition of hydrogen isotopes greatly vary depending on the sources and organisms due to complexities of interacting elements in disequilibrium states. In this section, the observed variations in hydrogen isotope abundances of water sources (hydrosphere), living organisms (biosphere), organic substances (geosphere), and extraterrestrial materials in the Solar system are described.
Hydrosphere
Oceans

Variations in δD value of different water sources and ice caps are observed due to evaporation and condensation processes. [See section 6 for more details] When the ocean water is well-mixed, the δD at equilibrium is close to 0‰ (‰ SMOW) with a D/H ratio of 0.00015576. However, continuous variations in δD values are caused by evaporation or precipitation processes which lead to disequilibrium in fractionation processes. A large H isotopic gradient (variations in δD values) is observed in surface waters of the oceans, and the fluctuation value in the Northwest Atlantic surface water is around 20‰. According to the data examining the southern supersegment of the Pacific Ocean, as the latitude (˚S) decreases from −65˚S to −40˚S, the δD value fluctuates between around −50‰ and −70‰. [54]
The isotope composition of seawater (not just the surface water) is mostly in the range of 0-(-10) ‰. The estimates of the δD values for different parts of the oceans across the world are shown on the map. [55]
Ice caps

The typical δD values for the ice sheets in the polar regions range from around −400‰ to −300‰ (‰SMOW). [57] The δD values for ice caps are affected by the distance from the open ocean, latitude, atmospheric circulation as well as the amount of insolation and temperature. The temperature change affects the deuterium content of ice caps, so the H/D isotopic composition of ice can give estimates for the historical climate cycles such as the timelines for interglacial and glacial periods. [See section 7.2. Paleo-reconstruction for more details]
The δD values of ice caps from 70 km south of Vostok Station and in East Antarctica are −453.7‰ and −448.4‰ respectively, and are shown on the map. [58]
Atmosphere

The analysis done based on satellite measurement data estimates the δD values for the atmosphere in various regions of the world. The general trend is that the δD values are more negative at higher-latitude regions, so the atmosphere above the Antarctica and the arctic regions is observed to be highly D-depleted to around −230‰ to −260‰ or even lower.
The estimates of the atmospheric δD values are shown on the map. [60]
A vast portion of the global atmospheric water vapor comes from the
western Pacific Ocean near the tropical zone, (mean 2009) and the H/D isotopic composition of atmosphere varies depending on the temperature and humidity. In general, higher δD values are observed in humid regions with a high temperature.
[61]
Water vapor in the atmosphere is in general more depleted than the terrestrial water sources, since the rate of evaporation for 1H16
2O is faster than 1HD16O due to a higher vapor pressure. On the other hand, the rain water (precipitation) is in general more enriched than the atmospheric water vapor.
[62]
[63]
Precipitation

The δD values of the annual precipitation in different regions of the world are shown on the map. [65] The precipitation is more D-enriched near the equator in the Tropical regions. The values of δD generally fall in the range of around −30 ~ -150‰ in the northern hemisphere and −30~+30‰ over the land areas of the southern hemisphere. In North America, the δD values of average monthly precipitation across regions are more negative in January (ranging up to around −300‰ in Canada) compared to July (up to around −190‰). [65]
The overall mean precipitation is determined by balance between the evaporation of water from the oceans and surface water sources and the condensation of the atmospheric water vapor in the form of rain. The net evaporation should equal the net precipitation, and the δD value for the mean isotopic composition of global precipitation is around −22‰ (global average). [66] The Global Network of Isotopes in Precipitation (GNIP) investigates and monitors the isotopic composition of precipitation at various sites all over the world. The mean precipitation can be estimated by the equation, δ2H = 8.17(±0.07) δ18O + 11.27(±0.65)‰ VSMOW. (Rozanski et al., 1993) This equation is the slightly modified version from the general 'Global Meteoric Water Line (GMWL)' equation, δ2H = 8.13δ18O + 10.8, which provides the average relationship between δ2H and δ18O of natural terrestrial waters. [66] [67]
Lakes and rivers

The δD values vs. VSMOW of lakes in different regions are shown on the map. [69] The general pattern observed indicates that the δD values of the surface waters including lakes and rivers are similar to that of local precipitation. [70]
Soil water
The isotopic composition of soil is controlled by the input of precipitation. Therefore, the δD values of soil across regions are similar to that of local precipitation. However, due to evaporation, soil tends to be more D-enriched than precipitation. The degree of enrichment varies greatly depending on the atmospheric humidity, local temperature as well as the depth of the soil beneath the surface. According to the study done by Meinzer et al. (1999), as the depth in the soil increases, the δD of soil water decreases. [70]
| Source | δD | Reference |
|---|---|---|
| Surface ocean | −70‰ to −50‰ | Clog et al. (2013) |
| Deep ocean | −10‰ to 0‰ | Englebrecht and Sachs (2005) |
| Ice caps | −450‰ to −300‰ | Lecuyer et al. (1998), Masson-Delmotte et al. (2008) |
| Atmosphere | −260‰ to −80‰ | Frankenberg et al. (2009) |
| Precipitation | −270‰ to +30‰ | waterisotopes.org |
| Lakes | −130‰ to +50‰ | Sachse et al. (2012) |
| Soil water | −270‰ to +30‰ | waterisotopes.org |
Biosphere
Marine algae
The factors affecting δD values of algal lipids are the following: δD of water, algal species (up to 160%), lipid type (up to 170%), salinity (+0.9±0.2% per PSU), growth rate (0 ~ -30% per day) and temperature (−2 ~ -8% per °C).
In the study done by Zhang et al. (2009), the δD values of fatty acids in Thakassiosira pseudonana chemostat cultures were −197.3‰, −211.2‰ and −208.0‰ for C14, C16 and C18 fatty acids respectively. Moreover, the δD value of C16 fatty acid in an algal species named A. E. unicocca at 25 °C was determined using the empirical equation y = 0.890x – 91.730 where x is the δD of water at harvest. For another algal species named B. V. aureus, the equation was y = 0.869x −74.651. [71]
The degree of D/H fractionation in most algal lipids increases with increasing temperature and decreases with increasing salinity. The growth rates have different impacts on the D/H fractionation depending on the species types. [72]
Phytoplankton and bacteria
The δD values of lipids from phytoplankton is largely affected by δD of water, and there seems to be a linear correlation between those two values. The δD of most other biosynthetic products found in phytoplankton or cyanobacteria are more negative than that of the surrounding water. [73] The δD values of fatty acids in methanotrophs living in seawater lie between −50 and −170‰, and that of sterols and hopanols range between −150 and −270‰. [74] [75]
The H isotopic composition of photoautotrophs can be estimated using the equation below:
- Rl = Xwαl/wRw + (1 – Xw)αl/sRs, [74]
where Rl, Rw, and Rs are the D/H ratios of lipids, water, and substrates, respectively. Xw is the mole fraction of lipid H derived from external water, whereas αl/w and αl/s denote the net isotopic fractionations associated with uptake and utilization of water and substrate hydrogen, respectively.
For Phototrophs, Rl is calculated assuming that Xw equals to 1. The isotopic fractionation between lipids and methane (αl/m) is 0.94 for fatty acids and 0.79 for isoprenoid lipids. The isotopic fractionation between lipids and water (αl/w) is 0.95 for fatty acids and 0.85 for isoprenoid lipids. For plants and algae, the isotopic fractionation between lipids and methane (αl/m) is 0.94 for fatty acids and 0.79 for isoprenoid lipids. [74]
The δD values for lipids in bacterial species
Source: [71]
- Lipids in organisms growing on heterotrophic substrates:
- Lipids in organisms growing
photoautotrophically:
- Depletion of 50‰ ~ 190‰ relative to water
- αl/w: -150‰ ~ -250‰
- Lipids in organisms growing
chemoautotrophically:
- αl/w: -200‰ ~ -400‰
Plants

δD values for n-C29 alkane(‰) vs. VSMOW for different plant groups are the following. In the equations, represents δD values for n-C29 alkane(‰) vs. VSMOW, and represents δD values for mean annual precipitation (‰) vs. VSMOW). [76]


| Plant group | Equation for estimating δD |
|---|---|
| Shrubs | |
| Trees | |
| Forbs | |
| C3 graminoids | |
| C4 graminoids |


For plant leaf wax, the relative humidity, the timing of leaf wax formation and the growth conditions including light levels affect the D/H fractionation of plant wax. From the Craig–Gordon model, it can be understood that leaf water in the growth chamber gasses is significantly D-enriched due to transpiration. [77]
Sugars
The relative global abundance of D in plants is in the following order: phenylpropanoids > carbohydrates > bulk material > hydrolysable lipids > steroids. [78] In plants, δD values of carbohydrates, which typically range around -70‰ to -140‰, are good indicators of the photosynthetic metabolism. Photosynthetically produced Hydrogens which are bound to carbon backbones are around 100–170‰ more D-depleted than the water found in plant tissues.
The heterotrophic processing of carbohydrates involves isomerization of triose phosphates and interconversion between fructose-6-phosphate and glucose-6-phosphate. These cellular processes promote the exchange between organic H and H2O within the plant tissues leading to around 158‰ of D-enrichment of those exchanged sites. [79] The δD of C3 plants such as Sugar beet, orange and grape ranges from −132‰ to −117‰, and that of C4 plants such as sugar cane and maize ranges from −91‰ to −75‰. The δD of CAM such as pineapple is estimated to be around −75‰. [78] Sugar beet and sugar cane contain sucrose, and maize contain glucose. Orange and pineapple are the sources of glucose and fructose.
The deuterium content of the sugars from the above plant species are not distinctive. In C3 plants, Hydrogens attached to Carbons in 4 and 5 positions of the glucose typically come from NADPH in the photosynthetic pathway, and are found to be more D-enriched. Whereas in C4 plants, Hydrogens attached to Carbons 1 and 6 positions are more D-enriched. D-enrichment patterns in CAM species tend to be closer to that in C3 species. [80]
Bulk organic matter
The H/D isotopic composition of the leaf water is variable during the biosynthesis, and the enrichment in the whole leaf can be described by the equation, △Dleaf = △De × ((1 - e−p)/P) [81] [76]
The typical δD value of bulk plant is around −160‰ where δD values for cellulose and lignin are −110‰ and −70‰ respectively. [78]
Animals
The hydrogen isotopic composition in animal tissues are difficult to estimate due to complexities in the diet intake and the isotopic composition of surrounding water sources. When fish species were investigated, average hydrogen isotopic composition of proteins was in a large range of −128 ‰ ~ +203 ‰. In the bulk tissue of organisms, all lipids were found to be D-depleted, and the values of δD for lipids tend to be lower than that for proteins. The average δD for Chironomid and fish protein was estimated to be in the range of −128‰ to +203‰. [82]
Most hydrogens in heterotrophic tissues come from water not from diet sources, but the proportion coming from water varies. In general, Hydrogen from water is transferred to NADPH and then taken up to the tissues. An apparent trophic effect (compounding effect) can be observed for δD in heterotrophs, so significant D-enrichments result from the intake of surrounding water the in aquatic food webs. The δD of proteins in animal tissues are in cases affected more by diet sources than by surrounding water. [82]
Although different δD values for the same class of compounds may arise in different organisms growing in water with the same δD value, those compounds generally have the same δD value within each organism itself. [See Section 7.5. Ecology for more details]
Lipids
The δD values of fatty acids found in living organisms typically range from −73‰ to −237‰. The values of δD for individual fatty acids vary widely between cultures (−362‰ to +331‰), but typically by less than around 30‰ between different fatty acids from the same species. [71]
The differences in δD for the compounds within the same lipid class is generally smaller than 50‰, whereas the difference falls in the range of 50–150‰ for the compounds in different lipid classes. [71]
δD values for typical lipid groups are determined using the following equation:
- εl/w = (D/H)l/(D/H)w−1 = [(δDl + 1)/(δDw + 1)]−1 [76] where εl/w = net or apparent fractionation, δDl = lipid product and δDw = source water.
- The δD for common lipid classes found in living organisms are the following:
- n- alkyl: -170 ± 50‰ (113–262‰ more D-depleted than growth water)
- isoprenoid: -270 ± 75‰ (142–376‰ more D-depleted than growth water)
- phytol: -360 ± 50‰ (more depleted than the other two categories)
Polyisoprenoid lipids are more depleted than acetogenic (n-alkyl) lipids with more negative δD values.
| Type | Source | δD | Reference |
|---|---|---|---|
| Lipid | Marine Sediment | −470‰ to −30‰ | Zhang et al. (2008) |
| Marine Algae | −211‰ to −197‰ | Zhang et al. (2008) | |
| Methanotrophs | −170‰ to −50‰ | Sessions (2002) | |
| Heterotrophs | Enrichment of −50‰ to +200‰ relative to water | Zhang et al. (2008) | |
| Photoautotrophs | Enrichment of +50‰ to +190‰ relative to water | Zhang et al. (2008) | |
| Plants | −270‰ to −120‰ | Sachse et al. (2012) | |
| Sugar | Carbohydrates | −140‰ to −70‰ | Schmidt et al. (2003) |
| C3 plants | −132‰ to −117‰ | Schmidt et al. (2003) | |
| C4 plants | −91‰ to −75‰ | Schmidt et al. (2003) | |
| CAM | around −75‰ | Schmidt et al. (2003) | |
| Bulk | Plants | around −160‰ | Schmidt et al. (2003) |
| Animals (e.g. fish) | −128‰ to +203‰ | Soto et al. (2013) |
Geosphere
Oil
Source: [83]
- Oil samples from northeast Japan: from −130‰ to around −110‰ with higher maturity. [84]
- Oil samples from Portiguar Basin: -90‰ (lancustrine environment), -120‰ to -135‰ (marine-evaporitic environment), [85]
Alkenones

The isotopic composition of alkenones often reflect the isotopic enrichment or depletion of the surrounding environment, and the δD values of alkenones in different regions are shown on the map. [87] [88]
Coals

Source: [90]
According to the studies done by Reddings et al., δD for coals from various sources range from around −90‰ to −170‰. [91]
The δD values of coals in different regions are shown on the map. [92] [93]
Natural gas
Source: [94]
Methane
Methane produced from marine methanogens is typically more D-enriched than methane produced from methanogens grown in freshwater. The δD values for thermogenic methane range from −275‰ to −100‰, and from −400‰ to −150‰ for microbial methane. [95]
H2 gas
The δD value observed for atmospheric H2 is around +180‰, which is the biggest delta value observed for natural terrestrials. (The mole fraction of 2H: 0.0001838) The δD value for natural gas from a Kansas well is around −836‰ (The mole fraction of Deuterium is 0.0000255) [96] During the process of electrolysis of water, hydrogen gas is produced at the cathode, but an incomplete electrolysis of water may cause isotopic fractionation leading to enrichment of D in the sample water and the production of hydrogen gas with deuterium components.
Mineral H

The δD values of hydroxyl-bearing minerals of mantle were estimated to be −80‰ ~ -40‰ through the analysis of the isotopic composition for juvenile water. Hydrogen Minerals generally have large isotope effects, and the isotopic composition often follows the pattern observed for precipitation.
Clay minerals
The D/H fractionations in clays such as kaolinite, illite, smectite are in most cases consistent when no significant external forces are applied under constant temperature and pressure.
The following is an empirically determined equation for estimating the D/H fractionation factor: 1000 In αkaolinite-water = -2.2 × 10⁶ × T−2 – 7.7. [98]
The δD values vs. ‰SMOW for Hydrogen minerals found in mantle, Metamorphic rock, shales, marine clays, marine carbonates and sedimentary rocks are shown in the table. [57]
| Source | δD | Reference |
|---|---|---|
| Oil | −135‰ to −90‰ | Waseda (1993), dos Santos Neto and Hayes (1999) |
| Alkenones | −204‰ to −181‰ | Englebrecht and Sachs (2005) |
| Coals | −170‰ to −50‰ | Redding (1980), Rigby and Smith (1981), Smith (1983) |
| Natural Gas (Methane) | −400‰ to −100‰ | Whiticar (1999) |
| H2 Gas | −836‰ to +180‰ | Hoefs (2009) |
| Mineral H | −100‰ to −20‰ | Lecuyer et al. (1998) |
Extraterrestrial objects
Variations of D/H ratio in the Solar System [99]

- Earth
- The H isotope composition of mantle rocks on earth is highly variable, and that of mantle water is around −80‰ ~ −50‰ depending on its states such as fluid, hydrous phase, hydroxyl point defect, Juvenile water (from degassing of the mantle), magmatic water (water equilibrated with a magma).
- Sun
- The D/H ratio of the Sun is around 21 ± 5 × 10⁻⁶. [101]
- Mars
- The current Hydrogen isotope composition is enriched by a factor of 5 relative to terrestrial ocean water due to continual losses of H in Martian atmosphere. Therefore, the δD value is estimated to be around +4000‰.
The D/H ratios for Jupiter and Saturn is nearly in the order of 10−5, and the D/H ratios of Uranus and Neptune is closer to the order of 10−4. [102]
Hydrogen is the most abundant element in the universe. Variations in isotopic composition of extraterrestrial materials stem from planetary accretion or other planetary processes such as atmospheric escape, and are larger for H and N than for C and O. The preservation of D-enrichment is observed in chondritic meteorites, interplanetary dust particles and cometary volatiles.
From the Helium isotope abundance data, the cosmic D/H value is estimated to be around 20 ppm which is much lower than the terrestrial D/H ratio of 150 ppm. The enrichment of D/H from the proto-solar reservoir occurs for most of the planets except for Jupiter and Saturn, the massive gaseous planets. The D/H ratios of the atmospheres of Venus and Mars are ~2 × 10⁻² and ~8 × 10⁻⁴ respectively. The D/H ratios of Uranus and Neptune is larger than that of protosolar reservoir by a factor of around 3 due to their deuterium-rich icy cores. The D/H ratios for comets are much larger than the values for the planets in the Solar System with δD value of around 1000‰. [103]
The Hydrogen isotope compositions in the galaxy and the Solar System are shown in the table.
Measurement techniques
Determination of D/H ratio can be performed with a combination of different preparation techniques and instruments for different purposes. There are several basic categories of hydrogen isotope measurements: (i) organic hydrogen or water are converted to H2 first, followed by high precision IRMS ( Isotope-ratio mass spectrometry) measurement with high precisions; (ii) D/H and 18O/16O are directly measured as H2O by laser spectroscopy also with high precisions; (iii) the intact molecules are directly measured by NMR or mass spectrometry with relatively lower precision than IRMS.
Offline combustion and reduction
The conversion to simple molecules (i.e. H2 for hydrogen) is required prior to IRMS measurement for stable isotopes. This is due to several reasons with regard to hydrogen:
- organic molecules and some inorganic ones (e.g. CO2 + H2O) can have proton-exchange reactions with ion source of mass spectrometer and produce the products such as and that cannot be distinguished;
- isotope effects due to ionization and transmission in the mass spectrometer can vary with different molecular forms. [104] It would require standards in every different molecular form that is being measured, which is not convenient.


The classical offline preparation for the conversion is combustion over CuO at > 800 °C in sealed quartz tubes, followed by the isolation of resulting water and the reduction to H2 over hot metal at 400 ~1000 °C on a vacuum line. [105] The produced gas is then directly injected into the dual-inlet mass spectrometer for measurement. [104] The metals used for the reduction to H2 includes U, Zn, Cr, Mg and Mn, etc. U and Zn had been widely used since the 1950s [25] [106] [107] [108] [109] [110] until Cr [111] was successfully employed in the late 1990s.
The offline combustion/reduction has the highest accuracy and precision for hydrogen isotope measurement without limits for sample types. The analytical uncertainty is typically 1~2‰ in δD. Thus it is still being used today when highest levels of precision are required. However, the offline preparation procedure is very time-consuming and complicated. It also requires large sample size (several 102 mg). Thus the online preparation based on combustion/reduction coupled with the subsequent continuous flow-IRMS (CF-IRMS) system has been more commonly used nowadays. Chromium reduction or high temperature conversion are the dominant online preparation methods for the detection of hydrogen isotope by IRMS.

High temperature conversion/elemental analyzer (TC/EA)
TC/EA (or HTC, high temperature conversion; HTP, high temperature pyrolysis; HTCR, high temperature carbon reduction) is an 'online' or 'continuous flow' preparation method typically followed by IRMS detection. This is a "bulk" technique that measures all of the hydrogen in a given sample and provides the average isotope signal. The weighed sample is placed in a tin or silver capsule and dropped into a pyrolysis tube of TC/EA. The tube is made of glassy carbon with glassy carbon filling in which way oxygen isotope can be measured simultaneously without the oxygen exchange with ceramic (Al2O3) surface. [113] The molecules are then reduced into CO and H2 at high temperature (> 1400 °C) in the reactor. The gaseous products are separated through gas chromatography (GC) using helium as the carrier gas, followed by a split-flow interface, and finally detected by IRMS. TC/EA method can be problematic for organic compounds with halogen or nitrogen due to the competition between the pyrolysis byproducts (e.g. HCl and HCN) and H2 formation. [114] [115] In addition, it is susceptible to contamination with water, so samples must be scrupulously dried.
An adaption of this method is to determine the non-exchangeable (C-H) and exchangeable hydrogen (bounds to other elements, e.g. O, S and N) in organic matter. The samples are equilibrated with water in sealed autosampler carousels at 115 °C and then transferred into pyrolysis EA followed by IRMS measurement. [116]
TC/EA method is quick with a relatively high precision (~ 1‰). It was limited to solid samples, however, liquid sample recently can also be measured in TC/EA-IRMS system by adapting an autosampler for liquids. The drawback of TC/EA is the relatively big sample size (~ mg), which is smaller than offline combustion/reduction but larger than GC/pyrolysis. It cannot separate different compounds as GC/pyrolysis does and thus only the average for the whole sample can be provided, which is also a drawback for some research.

Gas chromatography/pyrolysis (GC/pyrolysis)
GC-interface (combustion or pyrolysis) is also an online preparation method followed by IRMS detection. This is a 'compound-specific' method, allowing separation of analytes prior to measurement and thus providing information about the isotopic composition of each individual compound. Following GC separation, samples are converted to smaller gaseous molecules for isotope measurements. GC/pyrolysis uses the pyrolysis interface between GC and IRMS for the conversion of H and O in the molecules into H2 and CO. GC-IRMS was first introduced by Matthews and Hayes in the late 1970s, [117] and was later used for δ13C, δ15N, δ18O and δ34S. Helium is used as the carrier gas in the GC systems. However, the separation of DH (m/z=3) signal from the tail of 4He+ beam was problematic due to the intense signal of 4He+. [118] During the early 1990s, intense efforts were made in solving the difficulties to measure δD by GC/pyrolysis-IRMS. In 1999, Hilkert et al. developed a robust method by integrating the high temperature conversion (TC) into GC-IRMS and adding a pre-cup electrostatic sector and a retardation lens in front of the m/z=3 cup collector. Several different groups were working on this at the same time. [118] [119] [120] [121] This GC/pyrolysis-IRMS based on TC has been widely used for δD measurement nowadays. The commercial products of GC-IRMS include both combustion and pyrolysis interfaces so that δ13C and δD can be measured simultaneously.
The significant advantage of GC/pyrolysis method for hydrogen isotope measurement is that it can separate different compounds in the samples. It requires the smallest sample size (a typical size of ~ 200 ng [119]) relative to other methods and also has a high precision of 1~5 ‰. But this method is relatively slow and limited to the samples which can be applied in GC system.

Laser spectroscopy
Laser Spectroscopy (or Cavity ring-down spectroscopy, CRDS) is able to directly measure D/H, 17O/16O and 18O/16O isotope compositions in water or methane. The application of laser spectroscopy to hydrogen isotopes was first reported by Bergamaschi et al. in 1994. [122] They directly measured 12CH3D/12CH4 in atmospheric methane using a lead salt tunable diode laser spectroscopy. The development of CRDS was first reported by O'Keefe et al. in 1988. [123] In 1999, Kerstel et al. successfully applied this technique to determine D/H in water sample. [124] The system consists of a laser and a cavity equipped with high finesse reflectivity mirrors. Laser light is injected into the cavity, at which the resonance takes place due to the constructive interference. The laser then is turned off. The decay of light intensity is measured. In the presence of a water sample, the photo-absorption by water isotopologues follows the kinetic law. The optical spectrum is obtained by recording ring-down time of the H2O spectral features of interest at certain laser wavelength. The concentration of each isotopologue is proportional to the area under each measured isotopologue spectral feature. [125]
Laser Spectroscopy is a quick and simple procedure, relatively lower cost and the equipment is portable. So it can be used in the field for measuring water samples. D/H and 18O/16O can be determined simultaneously from a single injection. It requires a small sample size of < 1 μL for water. The typical precision is ~ 1‰. However, this is the compound-specific instrument, i.e. only one specific compound can be measured. And coexisting organic compounds (i.e. ethanol) could interfere with the optical light absorption features of water, resulting in cross-contamination.
SNIF-NMR
2H-Site-specific Natural Isotope Fractionation-Nuclear Magnetic Resonance( 2H-SNIF-NMR) is a type of NMR specialized in measuring the deuterium concentration of organic molecules at natural abundances. The NMR spectra distinguishes hydrogen atoms in different chemical environments (e.g. The order of carbon that hydrogen binds to, adjacent functional groups, and even geminal positions of methylene groups), making it a powerful tool for position-specific isotope analysis. The chemical shift (in frequency units) of 2H is 6.5 times lower than that of 1H. Thus, it is difficult to resolve 2H peaks. To provide high-enough resolution to separate 2H peaks, high strength magnetic field instruments (~11.4T) [126] are applied. Application of NMR to study hydrogen isotopes of natural products was pioneered by G'erard Martin and his co-workers in the 1980s. [127] For several decades it has been developed and expanded. The D/H NMR measurement is sometimes coupled with IR-MS measurement to create a referential standard. [128] The sensitivity of SNIF-NMR is relatively low, typically requiring ~1 mmol of samples for each measurement. [129] The precision with respect to isotope ratio is also relatively poor compared with mass spectrometry. Even the state-of-art instruments can only measure D/H ratios with around 50~200‰ error depending on the compound. [130] [131] [132] Therefore, so far technique can only distinguish the large D/H variations in preserved materials. In 2007, Philippe Lesot and his collezzes advanced this technique with a 2-Dimensional NMR using chiral liquid crystals (CLCs) instead of isotropic solvents to dissolve organic molecules. [133] This enables the measurements of quadrupolar doublets for each nonequivalent deuterium atom. Thus reduces peak overlaps and provides more detailed information of hydrogen chemical environment. [131]
The mainstream applications of 2H-SNIF-NMR have been in source attribution, forensics and biosynthetic pathway studies. (See also Gray's section "Source attribution and Forensics") When measuring sugar compounds, a timesaving strategy is to convert them into ethanol through fermentation because 2H-SNIF NMR for ethanol is well established. [128] Several studies [128] [134] have proved that hydrogen isotopes on the methyl and methylene position of the resulting ethanol is not affected by either fermentation rate or media. Another example is the study of monoterpenes. since the 1980s SNIF-NMR study of α-pinene has found large variations in D/H ratios among its sites. Particularly ex-C2 position has a strong depletion (~-750‰), which was in disagreement with accepted biosynthetic mechanism (mevalonate mechanism) at that time, and lead to new development in pathways. More recently, Ina Ehlers published their work on the D6S/D6R ratios of glucose molecules. The stereochemical diteterium distribution was found to correlate to photorespiration/photosynthesis ratios. Photorespiration/photosynthesis ratios are driven by CO2 fertilization, [132] thus this might lead to new proxies in reconstructing paleo-CO2 concentration. Work has also been done for long-chain fatty acids and found that even-numbered sites, which are thought to be derived from C2 position of the acetyl group, are more enriched in deuterium than odd-numbered hydrogen that come from C1 position of the acetyl group. [129] Duan et al. reported a strong kinetic isotope effect(KIE) during the desaturation from oleic acid to linoleic acid. [135]
In summary, the underlying physics of the SNIF-NMR makes it capable of measuring isotopomers. Another advantage of doing NMR measurements over mass spectrometry is that it analyzes samples non-destructively. The 2H SNIF-NMR has been well industrialized in source identification and forensics, and has contributed much to biochemical pathway studies. The application of 2H SNIF-NMR to geological records is sporadic and still needs exploring.
Intact molecular isotope ratio mass spectrometry
Conventionally, mass spectrometry, such as Gas Chromatography-Mass Spectrometry( GC-MS) and Gas Chromatography -Time Of Flight( GC-TOF), is a common technique for analyzing isotopically labeled molecules. [136] [137] This method involves ionizing and analyzing isotopologues of an intact organic molecule of interest rather than its products of pyrolysis or conversion. However, it does not work for natural abundance hydrogen isotopes because conventional mass spectrometers do not have enough mass-resolving power to measure the 13C/D isotopologues of intact organic molecules or molecular fragments at natural abundance. For example, to resolve the single D substituted isotopologue peak of any hydrocarbons you will at have to be able to at least exclude single 13C substituted isotopologue peak, which sits at the same cardinal mass yet 0.0029 AMU lighter and is of orders of magnitude more abundant.
Recent advances in analytical instruments enable direct measurement of natural abundance D/H ratios in organic molecules. The new instruments have the same framework as any conventional gas source
IRMS, but incorporate new features such as larger magnetic sector, double focusing sectors, quadrupole mass filter and multi-collectors. Two commercial examples are the Nu Panorama
[138] and the Thermo Scientific 253 Ultra.
[139] These instruments generally have good sensitivity and precision. Using only tens of nanomoles of methane, the Ultra can achieve a stable high precision of around 0.1‰ error in δD.
[140] One of the first examples of this type of measurement has been the clumped isotopes of methane.(See section of "natural gas" in Fossil fuels) Another strength of this kind of instruments is the capability of doing site-specific isotopic ratio measurements. This technique is based on measuring D/H ratios of fragments from the
ion source (e.g. CH3CH+
2 of propane molecule) that samples hydrogen atoms from different parts of the molecule.
[141]
In summary, direct molecular mass-spectrometry has been commonly used to measure laboratory spiked isotope tracers. Recently advanced high resolution gas source isotope ratio mass spectrometers can measure hydrogen isotopes of organic molecules directly. These mass spectrometers can provide high precision and high sensitivity. The drawback of this type of instruments includes high cost, and standardization difficulty. Also, studying site-specific isotopes with mass spectrometry is less straightforward and needs more constraints than the SNIF-NMR method, and can only distinguish isotopologues but not isotopomers.
Hydrologic cycle
Isotope fractionation in the hydrological cycle

Water is the primary source of hydrogen to all living organisms, so the isotopic composition of environmental water is a first-order control on that of the biosphere. The hydrological cycle moves water around different reservoirs on the surface of the earth, during which hydrogen isotopes in water are significantly fractionated. [142] As the primary moisture source to the atmosphere, the ocean has a relatively uniform hydrogen isotope composition across the globe around 0‰ (VSMOW). [143] Variations of δD larger than 10‰ in the ocean are generally confined to surface waters due to evaporation, sea ice formation, and addition of meteoric waters by precipitation, rivers or icebergs. [142] In the hydrological cycle, the two major processes that fractionate hydrogen isotopes from ocean water are evaporation and condensation. It should be pointed out that oxygen isotopic composition (18O/16O) of water is also an important tracer in the hydrological cycle, and cannot be separated from hydrogen isotopes when we talk about isotope fractionation processes associated with water.
During evaporation of water from the ocean to the atmosphere, both equilibrium and kinetic isotope effects occur to determine the hydrogen and oxygen isotopic composition of the resulting water vapor. At the water-air interface, a stagnant boundary layer is saturated with water vapor (100% relative humidity), and the isotopic composition of water vapor in the boundary layer reflects an equilibrium fractionation with liquid water. The liquid-vapor equilibrium fractionations for hydrogen and oxygen isotopes are temperature-dependent: [144]
(‰)

(‰)

The magnitude of the liquid-vapor equilibrium fractionation for hydrogen isotopes is approximately 8 times that of oxygen isotopes at earth surface temperatures, which reflects the relative mass differences of the two isotope systems (2H is 100% heavier than 1H, 18O is 12.5% heavier than 16O). Above the boundary layer, there is a transition zone with relative humidity less than 100%, and there is a kinetic isotope fractionation associated with water vapor diffusion from the boundary layer to the transition zone, which is empirically related to the relative humidity (h): [145]
‰

‰

The kinetic isotope effect associated with diffusion reflects the mass difference of the heavy-isotope substituted water molecules (HD16O and H18
2O) relative to the normal isotopologue (H16
2O).
After water is evaporated to the atmosphere, it is transported and returned to the surface through condensation and precipitation. Condensation of water vapor occurs in ascending air masses that develop a lower temperature and saturation vapor pressure. Since the cooling and condensation happens at relatively slow rates, it is a process with equilibrium isotope effects. However, as water vapor is progressively condensed and lost from the air during moisture transport, the isotopic composition of the remaining vapor, as well as the resulting precipitation, can be largely depleted due to the process of Rayleigh distillation. The equation for Rayleigh distillation is: [146]


In the equation, R0 represents the isotope ratio in the initial water vapor, Rr represents the isotope ratio in the remaining water vapor after some condensation, f is the fraction of water vapor remaining in the air, and α is the liquid-vapor equilibrium fractionation factor (α=1+ε). The isotopic composition of the resulting precipitation (Rp) can be derived from the composition of the remaining vapor:

As f decreases progressively during condensation, the remaining vapor becomes more and more depleted of the heavy isotopes, and the magnitude of depletion becomes larger as f approaches zero. The Rayleigh distillation process can explain some first-order spatial patterns observed in the isotopic composition of precipitation across the globe, including isotopic depletion from the tropics to the poles, isotopic depletion from coastal to inland regions, and isotopic depletion with elevation over a mountain range, [1] all of which are associated with progressive moisture loss during transport. The Rayleigh distillation model can also be used to explain the strong correlation between δD and δ18O observed in global precipitation, expressed as the global meteoric water line (GMWL): δD = 8δ18O+10 [147] (later updated to δD = 8.17±0.07 δ18O+11.27±0.65 [41]) The slope of the GMWL reflects the relative magnitude of hydrogen and oxygen isotope fractionation during condensation. The intercept of GMWL is non-zero (called deuterium-excess, or d-excess), which means ocean water does fall on GMWL. This is associated with the kinetic isotope effect during evaporation when water vapor diffuses from the saturated boundary layer to the unsaturated transition zone, and cannot be explained by the Rayleigh model. Nevertheless, the robust pattern in GMWL strongly suggests a single dominant moisture source to the global atmosphere, which is the tropical western Pacific. It should also be pointed out that a local meteoric water line can have a different slope and intercept from the GMWL, due to differences in humidity and evaporation intensity at different places. [145] Hydrogen and oxygen isotopes in water thus serve as an excellent tracer of the hydrological cycle both globally and locally.
Water isotopes and climate
Based on the processes that fractionate isotopes in the hydrological cycle, isotopic composition of meteoric water can be used to infer related environmental variables such as air temperature, precipitation amount, past elevations, lake levels, as well as to trace moisture sources. These studies form the field of isotope hydrology. Examples of isotope hydrology applications include the following:
Temperature reconstruction
Isotopic composition of precipitation can be used to infer changes in air temperature based on the Rayleigh process. Lower temperature corresponds to lower saturation vapor pressure, which leads to more condensation that drives the residual vapor toward isotope depletion. The resulting precipitation thus has a more negative δD and δ18O value at lower temperature. This precipitation isotope thermometer is more sensitive at lower temperatures, and widely applied at high latitudes. For example, δD and δ18O were found to have a temperature sensitivity of 8‰/°C and 0.9‰/°C in Antarctic snow, and a sensitivity of 5.6‰/°C and 0.69‰/°C across Arctic sites. [148] δD and δ18O of ice cores in Greenland, Antarctica and alpine glaciers are important archives of temperature change in the geological past.
Precipitation amount effect
In contrast to temperature control at high latitudes, the isotopic composition of precipitation in the tropics is mainly influenced by rainfall amount (negative correlation). This "amount effect" is also observed for summer precipitation in the subtropics. [41] [148] Willi Dansgaard, who first proposed the term "amount effect", suggested several possible reasons for the correlation: (1) As cooling and condensation progress, the rainfall isotopic composition reflects an integrated isotopic depletion by the Rayleigh process; (2) A small amount of rainfall is more likely to be influenced by evaporation and exchange with surrounding moisture, which tend to make it more isotopically enriched. At low latitudes, the amount effect for δ18O is around −1.6‰ per 100 mm precipitation increase at island stations, and −2.0‰ per 100 mm at continental stations. [148] It was also noted that the amount effect was most pronounced when comparing isotopic composition of monthly precipitation at different places in the tropics. [148] The amount effect is also expected for hydrogen isotopes, but there are not as many calibration studies. Across southeast Asia, the δD sensitivity to monthly precipitation amount varies between −15 and −25‰/100mm depending on location. [149] In temperate regions, the isotopic composition of precipitation is dominated by rainfall amount in summer, but more controlled by temperature in the winter. [148] The amount effect may also be complicated by changes in regional moisture sources. [150] Reconstructions of rainfall amount in the tropics in the geological past are mostly based on δ18O of speleothems [151] [152] or δD of biogenic lipids, [153] [154] both of which are thought of as proxies for the isotopic composition of precipitation.
Applications
Isotope hydrology
Hydrogen and oxygen isotopes also work as tracers for water budget in terrestrial reservoirs, including lakes, rivers, groundwater and soil water. For a lake, both the amount of water in the lake and the isotopic composition of the water are determined by a balance between inputs (precipitation, stream and ground water inflow) and outputs (evaporation, stream and ground water outflow). [142] The isotopic composition of lake water can often be used to track evaporation, which causes isotope enrichment in the lake water, as well as a δD-δ18O slope that is shallower than the meteoric water line. [155] The isotopic composition of river water is highly variable and have complicated sources over different timescales, but can generally be treated as a two-endmember mixing problem, a base-flow endmember (mainly ground water recharge) and an overland-flow endmember (mainly storm events). The isotope data suggest that the long-term integrated base-flow endmember is more important in most rivers, even during peak flows in summer. [142] Systematic river isotope data were collected across the world by the Global Network of Isotopes in Rivers (GNIR) [2].The isotopic composition of groundwater can also be used to trace its sources and flow paths. An example is a groundwater isotope mapping study in Sacramento, California, which showed lateral flow of river water with a distinct isotope composition into the groundwater that developed a significant water table depression due to pumping for human use. [156] The same study also showed an isotopic signal of agricultural water being recharged into the giant alluvial aquifer in California's Central Valley. [156] Finally, the isotopic composition of soil water is important for the study of plants. Below the water table, the soil has a relatively constant source of water with a certain isotopic composition. Above the water table, the isotopic composition of soil water is enriched by evaporation until a maximum at the surface. The vertical profile of isotopic composition of soil water is maintained by the diffusion of both liquid and vapor water. [157] A comparison of soil water and plant xylem water δD can be used to infer the depth at which plant roots get water from the soil. [158]
Paleo-reconstruction
Ice core records

The isotopic composition of ice cores from continental ice sheets and alpine glaciers have been developed as temperature proxies since the 1950s. Samuel Epstein was one of the first to demonstrate the applicability of this proxy by measuring oxygen isotopes in Antarctic snow, and also pointed out complications in the stable isotope-temperature correlation caused by the history of the air masses from which the snow formed. [160] Ice cores in Greenland and Antarctica can be thousands of meters thick and record snow isotopic composition of the past few glacial-interglacial cycles. Ice cores can be dated by layer counting on the top and ice flow modeling at depth, with additional age constraints from volcanic ash. [161] Cores from Greenland and Antarctica can be aligned in age at high-resolution by comparing globally well-mixed trace gas (e.g. CH4) concentrations in the air bubbles trapped in the cores. [162] Some of the first ice core records from Greenland and Antarctica with age estimates go back to the last 100,000 years, and showed a depletion in δD and δ18O in the last ice age. [163] [164] The ice core record has since been extended to the last 800,000 years in Antarctica, [165] and at least 250,000 years in Greenland. [166] One of the best δD-based ice core temperature records is from the Vostok ice core in Antarctica, which goes back to 420,000 years. [159] The δD-temperature (of the inversion layer where snow forms) conversion in east Antarctica based on modern spatial gradient of δD (9‰/°C) is ΔTI=(ΔδDice-8Δδ18Osw)/9, which takes into account variations in seawater isotopic composition caused by global ice volume changes. [159] Many local effects can influence ice δD in addition to temperature. These effects include moisture origin and transport pathways, evaporation conditions and precipitation seasonality, which can be accounted for in more complicated models. [167] Nevertheless, the Vostok ice core record shows some very important results: (1) A consistent δD depletion of ~70‰ during the last four glacial periods compared to interglacial times, corresponding to a cooling of 8 °C in Antarctica; (2) A consistent drop of atmospheric CO2 concentration by 100 ppmv and CH4 drop by ~300 ppbv during glacial times relative to interglacials, suggesting a role of greenhouse gases in regulating global climate; (3) Antarctic air temperature and greenhouse gas concentration changes precede global ice volume and Greenland air temperature changes during glacial terminations, and greenhouse gases may be an amplifier of insolation forcing during glacial-interglacial cycles. [159] Greenland ice core isotope records, in addition to showing glacial-interglacial cycles, also shows millennial-scale climate oscillations that may reflect reorganization in ocean circulation caused by ice melt charges. [166] [168] [169] [170] There have also been ice core records generated in alpine glacials on different continents. A record from the Andes Mountains in Peru shows a temperature decrease of 5-6 °C in the tropics during the last ice age. [171] A record from the Tibetan plateau shows a similar isotope shift and cooling during the last ice age. [172] Other existing alpine glacial isotope records include Mount Kilimanjaro in Tanzania, Mount Altai and West Belukha Plateau in Russia, Mount Logan in Canada, the Fremont Glacier in Wyoming, USA, and the Illimani Ice Core in Bolivia, most of which cover an interval of the Holocene epoch. [3]
Biomolecules
The isotopic compositions of biomolecules preserved in the sedimentary record can be used as a proxy for paleoenvironment reconstructions. Since water is the primary hydrogen source for photoautotrophs, the hydrogen isotope composition of their biomass can be related to the composition of their growth water and thereby used to gain insight into some properties of ancient environments. [173] Studying hydrogen isotopes can be very valuable, as hydrogen is more directly related to climate than other relevant stable isotope systems. However, hydrogen atoms bonded to oxygen, nitrogen, or sulfur atoms are exchangeable with environmental hydrogen, which makes this system less straightforward [174] [ref to earlier H exchange section]. To study the hydrogen isotope composition of biomolecules, it is preferable to use compounds where the hydrogen is largely bound to carbon, and therefore not exchangeable on experimental timescales. By this criterion, lipids are a much better subject for hydrogen isotope studies than sugars or amino acids.
The net fractionation between source water and lipids is denoted as εl/w, and can be represented as

where w refers to the water, and l refers to the lipids.
While the δD of source water is the biggest influence on the δD of lipids, [175] discrepancies between fractionation factor values obtained from the slope and from the intercept of the regression suggest that the relationship is more complex than a two-pool fractionation. [176] In other words, there are multiple fractionation steps that must be taken into account in understanding the isotopic composition of lipids.
Cellulose
The carbon-bonded hydrogen isotopic composition of cellulose, as inherited from leaf water, has the potential of preserving the original meteoric water signal. This was first demonstrated in the 1970s. [25] [177] In a systematic survey across North America, tree cellulose δD was found to have a temperature sensitivity of 5.8‰/°C, similar to precipitation δD sensitivity of 5.6‰/°C. [178] This spatial correlation may be complicated by local effects of soil evaporation and leaf transpiration, [178] and the spatial gradient may not be representative of temporal changes in tree ring cellulose at a single place. The mechanism that generates the δD signal in cellulose from meteoric water is not completely understood, but at least includes leaf water transpiration, synthesis of carbohydrates, synthesis of cellulose from photosynthetic sugars, and exchange of sugars with xylem water. [179] Modeling studies show that observed tree ring cellulose δD can be produced when 36% of the hydrogen in sugars can exchange with xylem water, and effects such as humidity and rainfall seasonality may complicate the cellulose δD proxy. [179] Despite these complications, tree ring δD have been used for paleoclimate reconstructions of the past few millennia. For example, a tree ring cellulose δD records from pine trees in the White Mountains, California shows a 50‰ depletion from 6800 year ago to present. The cooling trend since the mid-Holocene thermal maximum is consistent with ice core and pollen records, but the corresponding magnitude of cooling is elusive due to complicated influences from local effects such as humidity and soil water composition. [180] The meaning of isotopes in cellulose and its applications is still an area of active study.
Plant leaf waxes

Terrestrial plants make leaf waxes to coat the surfaces of their leaves as an adaptation to minimize water loss. These waxes are largely straight-chain n-alkyl lipids. They are insoluble, non-volatile, chemically inert, and resistant to degradation, making them easily preserved in the sedimentary record, and therefore good targets as biomarkers. [181]
The main water source for terrestrial plants is soil water, which largely resembles the hydrogen isotope composition of rain water, but varies between environments and with enrichment by precipitation, depletion by evaporation, and exchange with atmospheric water vapor. There can be a significant offset between the δD value of source water and the δD value of leaf water at the site of lipid biosynthesis. No fractionation is associated with water uptake by roots, a process usually driven by capillary tension, with the one exception of xerophytes that burn ATP to pump water in extremely arid environments (with a roughly 10‰ depletion). [182] However, leaf water can be substantially enriched relative to soil water due to transpiration, an evaporative process which is influenced by temperature, humidity, and the composition of surrounding water vapor. The leaf water hydrogen isotope composition can be described with a modified Craig-Gordon model, [183] where ΔDe is the steady state enrichment of leaf water, εeq is the temperature-dependent equilibrium fractionation between liquid water and vapor, εk is the kinetic isotope effect from diffusion between leaf internal air space and the atmosphere, ΔDv is the leaf/air disequilibrium, ea is atmospheric vapor pressure, and ei is internal leaf vapor pressure.

The Péclet effect, which describes the opposing forces of advection and diffusion can be added to the model as

where E is the transpiration rate, L is the length scale of transport, C is the concentration of water, and D is the diffusion coefficient.

While the role of rain water δD as the fundamental control on the final δD of lipids is well documented, [184] the importance of fractionation effects from rain water to soil water and leaf water on εl/w is appreciated but remains poorly understood. [173] [185]
Organic biomolecules are generally depleted relative to the δD of leaf water. [173] However, differences between organisms, biosynthetic pathways, and biological roles of different molecules can lead to huge variability in fractionation; the diversity of lipid biomarkers spans a 600‰ range of δD values. [186] Lipid biosynthesis is biochemically complex, involving multiple enzyme-dependent steps that can lead to isotope fractionations. There are three major pathways of lipid biosynthesis, known as the mevalonate pathway, the acetogenic pathway, and the 1-deoxyD-xylulose-5-phosphate/2-methylerythroyl-4-phosphate pathway. [187] The acetogenic pathway is responsible for the production of n-alkyl lipids like leaf waxes, and is associated with a smaller δD depletion relative to source water than the other two lipid biosynthesis pathways. [32] [188] While leaf water is the main source of hydrogen in leaf biomolecules, relatively depleted hydrogen from acetate or NADPH is often added during biosynthesis, and contributes to the hydrogen composition of the final molecule. Secondary hydrogen exchange reactions, meaning hydrogenation and dehydrogenation reactions outside of the primary biosynthetic pathway, also contribute substantially to the variability of lipid hydrogen isotope composition [189]
It is important to note that biological differences in fractionation stem not only from biochemical differences between different molecules, but also from physiological differences between different organisms. For example, the δD values of multiple leaf wax molecules are enriched in shrubs (median ~ -90‰) relative to trees (median ~ -135‰), which themselves are enriched relative to both C3 (median ~ -160‰) and C4 grasses (median ~ -140‰). [173] Between individual species, substantial variation of δD values have been documented. [190] [191] [192] [193] Other physiological factors that contribute to variable leaf wax δD values include the seasonal timing of leaf development, [194] response to external stress or environmental variability, [195] and the presence or absence of stomata [184]
It can be difficult to distinguish between physiological factors and environmental factors, when many physiological adaptations are directly related to environment.
Several environmental factors have been shown to contribute to leaf wax δD variability, in addition to environmental effects on the δD of source water. Humidity is known to impact lipid δD values at moderate humidity levels, but not at particularly high (>80%) or low (<40%) humidity levels, and a broad trend of enriched δD values, meaning smaller εl/w, is seen in arid regions. [173] [175] [190] Temperature and sunlight intensity, both correlated to geographic latitude, have strong effects on the rates of metabolism and transpiration, and by extension on εl/w. [196] Additionally, the average chain length of leaf wax molecules varies with geographic latitude, and εl/w has been shown to increase with increasing chain length [184]
When using biomarkers as a proxy for reconstructing ancient environments, it is important to be aware of the biases inherent in the sedimentary record. Leaf matter incorporated into sediment is largely deposited during the autumn, so seasonal variations in leaf waxes must be considered accordingly. [184] Furthermore, sediments average leaf waxes over lots of different plants in both space and time, making it difficult to calibrate the biological constraints on εl/w. [173] Finally, preservation of biomolecules in the geologic record does not faithfully represent whole ecosystems, and there is always the threat of hydrogen exchange, particularly if the sediments are subjected to high temperatures.
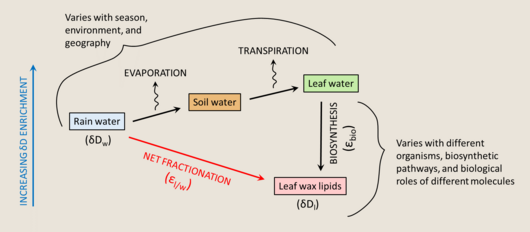
The hydrogen isotope composition of leaf waxes can be summarized as the δD of rain water, with three main fractionation steps- evaporation from soil water, transpiration from leaf water, and lipid biosynthesis, which can be combined and measured as the net fractionation, or εl/w. [173] With the application of ever-improving measurement techniques for single molecules, and correlation with other independent proxies in the geological record that can help constrain some variables, investigating the hydrogen isotope composition of leaf waxes can be extremely productive. Leaf wax δD data has been successfully applied to improving our understanding of climate driven changes in terrestrial hydrology, by demonstrating that ocean circulation and surface temperature have a significant effect on continental precipitation. [197] [198] Leaf wax δD values have also been used as records of paleoaltimetry to reconstruct the elevation gradients in ancient mountain ranges based on the effect of altitude on rain water δD. [199] [200]
Alkenones
Another group of molecules frequently used in paleoreconstructions are alkenones, long-chain largely unsaturated lipids produced exclusively by coccolithophores. Coccolithophores are marine haptophyte algae, and include the globally iconic species Emiliania huxleyi, one of the main CaCO3 producers in the ocean. The δD values of alkenones are highly correlated to the δD values of sea water, and therefore can be used to reconstruct paleoenvironmental properties that constrain the isotopic composition of sea water. The most notable reconstruction that alkenone δD values are applied to is the salinity of ancient oceans.
.png)
Both the δD values of sea water and the fractionations associated with hyptophyte biochemistry (εbio) are fairly well understood, so alkenones can be readily used to observe the secondary effect of salinity on δD. [201] There is a well established positive linear correlation between salinity and εl/w, on the order of a ~3‰ change in fractionation per salinity unit. [202] Hypothesized mechanisms for this effect include enrichment of D in intracellular water due to reduced exchange with extracellular water at higher salinity, [203] removal of H from intracellular water due to increased production of solutes to maintain osmotic pressure at higher salinity, [204] and lower haptophyte growth rates at higher salinity [173]
Alkenone δD values have been used successfully to reconstruct past salinity changes in the Mediterranean Sea., [205] Black Sea, [206] [207] Panama Basin, [208] and Mozambique Channel. [201] As an extension of salinity, this data was also used to draw further conclusions about ancient environments, such as ancient freshwater flooding events, [205] [206] and the evolution of plankton in response to environmental changes [207]
Stable isotope paleoaltimetry
The possibility of using water isotope depletion with elevation to reconstruct paleoaltimetry was demonstrated as early as the late 1960s, when Caltech geochemist Samuel Epstein tried to collect rainwater at different elevations in a single storm. [209] The δ18O and δD lapse rates vary within -1 to -5‰/km and -10 to -40‰/km respectively, but can vary with locations and seasons, and are not exactly linear with altitude. [210] [211] [212] One of the first studies in stable isotope paleoaltimetry demonstrated a meteoric water δD signature of -90 to -139‰ in fluid inclusions in quartz and adularia in an epithermal gold-silver deposit in Nevada, and suggested the applicability of stable isotopes in reconstruction of ancient topography in the Great Basin. [213] The hydrogen and oxygen isotopes of hydrous silicate minerals have since then been used to reconstruct topographic histories in mountain ranges across the world, including the North American Cordillera, the Rocky Mountains, the Himalayas, the European Alps, and Southern Alps in New Zealand. [209] Lab experiments with clay minerals have shown that the hydrogen and oxygen isotope compositions are relatively resistant to alteration at moderate temperature (<100 °C), and can preserve the original meteoric water signal. [214] One important effect of mountain ranges on rainfall stable isotopes is the rain shadow effect, in which an isotopic depletion happens in precipitation on the leeward side compared to the windward side. A change in the difference in isotopic composition of precipitation on the two sides of a mountain can be used to infer the magnitude of the rain shadow effect. [209] In one such study, an isotope enrichment was observed in smectite on the east side of the Sierra Nevada in California from mid- Miocene to late Pliocene, suggesting a decrease in elevation during this period. [215] Another study found δD values around -140‰ in muscovite in the North America Cordillera during the early Eocene, which would suggest an elevation 1000m higher than today at the time. [216] In addition to hydrous minerals, hydrogen isotopes in biomarkers such as leaf waxes have also been developed for paleoaltimetry studies. The δD lapse rate in leaf waxes (-21‰/km) falls in the range of meteoric water observations. [212] [217] As an example study, leaf wax δD data have been used to confirm hydrous mineral paleoaltimetry for the high elevation of the Sierra Nevada during the Eocene. [200]
Fossil fuels
The hydrogen isotope composition of oil, gas and coal is an important geochemical tool to study the formation, storage, migration and many other processes. The hydrogen isotopic signal of fossil fuels results from both inheritance of source material and water as well as fractionations during hydrocarbon generation and subsequent alteration by processes such as isotopic exchange or biodegradation. When interpreting hydrogen isotopic data of sedimentary organic matter one must take all the processes that might have an isotope effect into consideration.
Almost all of the organic hydrogen is exchangeable to some extent. Isotopic exchange of organic hydrogen will reorder the distribution of deuterium and often incorporate external hydrogen. Generally, more mature materials are more substantially exchanged. With effective exchange, aliphatic hydrogen can finally reach isotopic equilibrium at the final stage. Equilibrium fractionation factor varies among different hydrogen sites. For example, aliphatic hydrogen isotope fractionation depends on the carbon atom that the hydrogen atom bonds with. To the first order, alkyl hydrogen isotope composition follows this trend: δD Primary carbon < δD Secondary carbon < δD Tertiary carbon. [218] The fractionation factors between carbon sites also decrease with increasing temperature. This can be potentially used as a thermo-history indicator. [141] The fractionation between whole molecule and water can be estimated by averaging all hydrogen-positions, and this leads to a relatively small variation of equilibrium fractionation between different groups of hydrocarbons and water. A theoretical prediction estimated this to be −80‰ to −95‰ for steranes, −90‰ to −95‰ for hopanes, and −70‰ to −95‰ for typical cycloparaffins between 0 °C to 100 °C. [219] At the temperature of the oil window and gas window, the equilibrium fractionation between different group of organic molecules is relatively small, as compared with large primary signals.
The study of hydrogen isotopes of fossil fuels has been applied as proxies and tools in the following aspects:
- Reconstruction of paleoenvironments of the sources. Because of the high-sensitivity of D content of terrestrial water to hydrological cycles, organic δD can reflect the environment of source formation. To the first order, D/H ratios of coals and n-alkanes from oils have been demonstrated to correlate with paleolatitude.
- Source correlation. Marine and lacustrine environments are characterized by distinctly different δD values. Many studies have tried to relate measured δD with source types. For methane, D concentration and clumped isotopes is particularly diagnostic of sources.
- Possible maturity indicators. For example, isoprenoids synthesized by plants are strongly depleted in D(See "Observed variations in isotopic abundance" section), typically ~100‰ to n-alkyl lipids. [220] This gap tends to decrease as rock matures because of the higher D/H exchange rates of isoprenoids. The correlation of δD difference between pristane, phytane and n-alkanes and other maturity indicators has been established across a wide maturity range. [221] [222] Another possible maturity indicator based on the "isotope slope" of δD vs. n-alkane chain length was proposed by Tang et al. [223]
- Quantitative apportionment. Since alkanes are main components of oil and gas, the isotopic data of n-alkanes have been used to study their migration and mixing. The advantage of hydrogen isotopes over carbon is higher resolution because of larger fractionation. Studying the clumped isotopes of methane provides a new dimension of mixing-constraints. The mixing line in the clumped isotope notation space is a curve rather than a straight line.
- Fingerprinting pollutant/ oil spills.
Kerogens and coals
The first stage that sedimentary organic matter (SOM) experiences after deposition is diagenesis. During diagenesis, biological decomposition can alter the D/H ratio of organics. Several experimental studies have shown that some biodegraded materials become slightly enriched in D(less than 50‰). Most organics become kerogen by the end of diagenesis. Generally, δD of kerogen spans a wide range. Many factors contribute to the kerogen we observe in geological records, including:
- Source water hydrogen isotope patterns: For example, lake systems are more sensitive to hydrological cycles than marine environments.
- Differential fractionation for various organisms and metabolic pathways: differences in organic composition can also reflect in primary signal.
- Isotopic exchange, H loss and H addition: This can involve mixing water-derived D with the primary signal.
- Generation of bitumen, oil and gas: There's a fractionation between the product and kerogen.
Research on the Australian basins showed that δD of lacustrine algal sourced kerogen with terrestrial contributions varies from −105‰ to −200‰, and δD of kerogen from near-coastal depositional environment has a narrower range from −75‰ to −120‰. [224] The smaller span in D/H ratios of coastal kerogen is thought to reflect the relatively stable regional climate. Pedentchouk and his colleagues reported δD values of -70‰ to -120‰ in immature to low mature kerogen from early Cretaceous lacustrine sediments in West Africa. [221]
Coals are from type III kerogen mostly derived from terrestrial plants, which should have a primary D/H signal sensitive to local meteoric water. Reddings et al. analyzed coals from various origins and found them randomly scatter across the range of −90‰ to −170‰. [225] Rigby et al. found D contents decrease from -70‰ to -100‰ with increasing maturity in coal from Bass Basin and attributed this to latter exchange with low D water. [226] Smith et al. studied H isotopes of coal samples from Antarctica and Australia. They found a strong negative correlation between δD and inferred paleolatitude. For coal samples originating from near equatorial regions, δD is around −50‰, while for those originating from polar regions, δD is around −150‰. [227] This δD trend along latitude is consistent meteoric water trend and thus is an evidence that coals can preserve much of the original signals.
There are two types of approach to study the alteration of D/H ratios of kerogen during catagenesis: (1) Laboratory incubation of organic matter that enables mechanistic study with controlled experiments. (2) Natural sample measurement that provides information of combined effects over geological timescales. The complex composition and chemistry of kerogen complicates the results. Nevertheless, most research on hydrogen isotopes of kerogen show D enrichment with increasing maturity. Type II kerogen(marine derived) from New Albany Shale is reported to have δD rise from −120‰ to −70‰ as vitrinite reflectance increase from 0.3% to 1.5%. [228] Two main mechanisms have been proposed for enrichment. One of them is kinetic fractionation during hydrocarbon generation while the other is isotopic exchange with surrounding water. Anhydrous incubation experiments have shown that the products are generally more depleted in D than their precursors, causing enrichment in residual kerogen. Schimmelmann et al. studied the relationship between terrestrially-derived oil and their source rock kerogens from four Australian Basins. They found that on average the oil is depleted to corresponding kerogen by 23‰. [224] Hydrous incubation experiments suggest that 36–79% of bulk organic hydrogen may come from water at moderate maturity. While still under debate, it appears likely that incorporation of water hydrogen isotopes is the more dominant process for kerogen D- enrichment during catagenesis. [46]
In summary, D content of kerogen and coals are complicated and hard to resolve due to the complex chemistry. Nevertheless, studies have found the possible correlation between coal δD and paleo-latitude.
Natural gas
Commonly, hydrogen isotope composition of natural gas from the same well has a trend of δDmethane < δDethane < δDpropane < δDC4+. This is because most natural gas is thought to generated by step-wise thermal cracking that is mostly irreversible and thus governed by normal kinetic isotope effects that favor light isotopes. The same trend, known as "the normal order", [229] holds for carbon isotopes of natural gas. For example, Angola gas is reported to have a methane δD range of −190‰ to −140‰, an ethane δD of −146‰ to −107‰, a propane δD of −116‰ to −90‰, and a butane δD of −118‰ to −85‰. [230] However, some recent studies show that opposite patterns could also exist, meaning δDmethane > δDethane > δDpropane. This phenomenon is often referred to as 'isotopic reversal' or 'isotopic rollover'. The isotopic order could also be partially reversed, like δDmethane > δDethane < δDpropane or δDmethane < δDethane > δDpropane. [229] Burruss et al. found that in the deepest samples of northern Appalachian basin the hydrogen isotopic order for methane and ethane is reversed. [231] Liu et al., also found partial reversal in oil-related gas from the Tarim Basin. [229] The mechanism causing this reversal is still unknown. Possible explanations include mixing between gases of different maturities and sources, oxidation of methane, etc. Jon Telling et al., synthesized isotopically reversed (in both C and H) low-molecular alkanes using gas-phase radical recombination reactions in electrical discharge experiments, providing another possible mechanism. [232]
Methane is a major component of natural gas. Geosphere methane is intriguing for the large input of microbial methanogenesis. This process exhibits a strong isotope effect, resulting in greater D-depletion in methane relative to other hydrocarbons. δD ranges from −275‰ to −100‰ in thermogenic methane, and from −400‰ to −150‰ in microbial methane. [95] Also, methane formed by marine methanogens is generally enriched in D relative to methane from freshwater methanogens. δD of methane has been plotted together with other geochemical tools(like δ13C, gas wetness) to categorize and identify natural gas. A δD-δ13C diagram (sometimes referred to as CD diagram, Whiticar diagram, or Schoell diagram ) is widely used to place methane in one of the three distinct groups: thermogenic methane that is higher in both δ13C and δD; marine microbial methane that is more depleted in 13C and freshwater microbial methane that is more depleted in D. Hydrogenotrophic methanogenesis produces less D-depleted methane relative to acetoclastic methanogenesis. The location where the organism lives and substrate concentration also affect isotopic composition: rumen methanogenesis, which occurs in a more closed system and with higher partial pressures of hydrogen, exhibits a greater fractionation (−300 to −400‰) than wetland methanogenesis (−250 to −170‰). [233] [234]

Recent advances in analytical chemistry have enabled high-precision measurements of multiply substituted isotopologues (or 'clumped isotopologues') like 13CH3D. This emerge as a novel tool for studying methane formation. This proxy is based on the abundance of clumped isotopologues of methane, which should be enriched compared to the stochastic distribution at thermodynamic equilibrium because the reduced zero-point energy for heavy-heavy isotope bonding is more than twice the reduced zero-point energy of heavy-light isotope bonding. [235] The extent of enrichment decreases with increasing temperature, as higher entropy tends to randomize isotope distribution. Stolper et al. established this temperature calibration using laboratory equilibrated methane and field methane from known formation temperature, and applied this to several gas reservoirs to study natural gas formation and mixing. [236] Wang et al. also reported strong non-equilibrium isotope effect in methane clumped isotopes from lab-cultured methanogens and field samples. [237] These methane samples have relatively low abundance of clumped isotopologues, sometimes even lower than the stochastic distribution. This indicates that there are irreversible steps in enzymatic reactions during methanogenesis [237] that fractionation against clumped isotopologues to create the depleted signal. Isotope clumping in methane has proven a robust proxy, and scientists are now moving towards higher-order alkane molecules like ethane for further work. [238]
Oil
Oil is generally a product of thermal breakdown of type I and type II kerogen during catagenesis. The deuterium content should reflect the source kerogen signal, generation fractionation, isotopic exchange and other maturation effects. The thermal maturation at the oil window can erase much of the primary signals of hydrogen isotopes. The formation of oil involves breaking C-C and C-H bonds, resulting in depletion of 13C and D in the products and enrichment in the residual reactants due to kinetic isotope effects. Yongchun Tang and his colleagues modeled this process based on laboratory-calibrated kinetics data and found that the frequency factor ratio for D/H is 1.07. [239] Moreover, oil is also affected by the isotope fractionation from phase-change. However, the behavior of oil gas-liquid fractionation differs from water as the vapor phase of oil is enriched in D. [51] This will deplete residual oil as it gets evaporated. Biological degradation of oil is also expected to fractionate hydrogen isotopes, as enzymatic breaking of C-H bond have a normal kinetic isotope effect. Several degradation experiments show that this fractionation is generally mild, ranging from −11‰ to −79‰. [51] This process should also enrich partially degraded oil. Finally, oil stored in a reservoir often had migrated through subsurface (also known as "geochromatography") from another source region, interacting with water. No data has been published to confirm the fractionation associated with migration, yet theoretical prediction shows that this is likely to be very small. [51]
Many studies of natural samples have shown slight increases in δD with thermal maturity. Amane Waseda reported δD of oil samples in northeast Japan to increase from around −130‰ to around −110‰ with higher maturity. [240] At low thermal maturity, dos Santos Neto and Hayes reported δD of saturate fraction of oil in Portiguar Basin derived from a lacustrine environment is -90‰, and from a marine-evaporitic environment is -120‰ to −135‰. [46] [85]
The bulk analysis of oil, which yields a complicated mixture of organic compounds, obscures much of the valuable information. Switching to compound-specific study greatly expanded our understanding of hydrogen isotopes of oil. Analyzing deuterium content at the compound level avoids problems from differences in exchange rates, simplifies sources and products relationships, and draws a much more detailed picture. [51] δD of n-alkanes are generally thought to be representative of oil as they are the major components. Schimmelmann et al. confirmed that alkane fractions have almost the same D/H ratios as whole oils. [224] Depending on source material type and maturity, δD of n-alkanes can vary from −100‰ to −180‰. A common phenomenon of various oil and matured rock derived n-alkanes is a trend of increasing δD with chain length. For example, Li et al. analyzed oils from the Western Canada Sedimentary Basin and found δD increased between 20‰ and 40‰ from C13 to C27. [241] This "isotope slope" is an artifact of kinetic fractionation associated with thermal cracking of carbon chains. This trend has been experimentally reproduced and theoretically modeled by Tang et al. [223]
N-alkanes are also known to preserve detailed information of source material. Li et al. studied oils from the marine-derived Upper Cretaceous Second White Speckled Shale and found strong depleted signal around −180‰ in C12-C18. The low δD of this marine samples was explained by the discharge of a large high latitude river. [241] Schimmelmann et al. found that the δD of the oil sampled from coaly facies of the Crayfish group reaches down to −230‰ where as those sampled from algal facies of the same group are around −100‰. Such huge variation is hard to be explained by any other causes than Australia splitting from the Antarctic continent during late Cretaceous. [51] Another special case reported by xiong et al. [242] studied Ordovician carbonates from Bohai Bay Basin. They found big differences between δD of n-alkanes exists, reflecting that the original signal is preserved rather than being homogenized. The result is not obvious as the sample is very mature(inferred vitrinite reflectance R0 up to 2.3). Thus this is a strong evidence that carbonate systems have much lower catalytic efficiency of hydrogen exchange on hydrocarbons. Strong enrichment(~40‰) in odd carbon numbered alkanes to even carbon numbered alkanes is also found in some subset of samples and the reason is unclear at this point. This odd-even effect is also observed in immature clastic sediments. [243]
Ecohydrology
The field of ecohydrology is concerned with the interaction between ecosystems and water cycling, from measuring the small scale drainage of water into soil to tracking the broad movements of water evaporating off from trees. Because deuterium acts as a conservative tracer, it works well for tracking water movement through plants and ecosystems. Although water movement in single-process phenomena such as evaporation is relatively simple to track, many systems (e.g. cloud forests) in the environment have multiple sources and tracking water movement becomes more complicated. [244] Isotope spiking can also be done to determine water transport through soil and into plants via injection of deuterated water directly into the ground. [245]
Stable isotope analysis of xylem water can be used to follow the movement of water from soil into the plants and therefore provide a record of the depth of water acquisition. An advantage to using xylem water is that in theory, the deuterium content should directly reflect the input water without being affected by leaf transpiration. For example, Dawson and Ehleringer used this approach to determine whether trees that grow next to streams are using the surface waters from that stream. [246] Water from the surface would have the same isotopic composition as the stream, while water from farther below in the ground would be from past precipitation inputs. In this case, younger trees had a xylem water isotopic composition very close to the adjacent stream and likely used surface waters to get established. Older trees had depleted xylem water relative to the stream, reflecting that they source their water from deeper underground. [246] Other stable isotope studies have also determined that plants in redwood forests do not just take up water from their roots but acquire a significant proportion of water via stomatal uptake on leaves. [247]
Plant water can be used to characterize other plant physiological processes that affect the hydrologic cycle; for example, leaf waters are widely used for modeling transpiration [248] and water-use efficiency. [249] In transpiration, the Craig-Gordon model for lake water enrichment through evaporation [250] has been found experimentally to fit well for modelling leaf water enrichment. [251] Transpiration can be measured by direct injection of deuterated water into the base of the tree, trapping all water vapor transpired from the leaves and measuring the subsequent condensate. [252] Water use can also be measured and is calculated from a heavy water injection as follows:
- , [253]

Where WU is the water use in kilograms/day, M is the mass of deuterated water injected in grams, T is the final day of the experiment, Ci is the concentration of deuterium at time interval i in grams/kilogram, and Δti is the length of time interval i in days. Although the calculated water use via thermal dissipation probing of some tropical plants such as bamboos correlates strongly with measured water use found by tracking D2O movement, the exact values are not the same. [253] In fact, with leguminous tree species Gliricidia sepium, which produces a heartwood, transpired water did not even correlate strongly with injected D2O concentrations, which would further complicate water use measurements from direct injections. This possibly occurred because heartwoods could accumulate heavy water rather than move the water directly through xylem and to leaves. [253]
Water use efficiency (WUE), which is the ratio of carbon fixation to transpiration, has previously been associated with 13C/12C ratios using the following equation:
- , [249]

In this equation,
, φ is the fraction of fixed carbon that is respired, pCO2 is the partial pressure of CO2 in the atmosphere, εcarb is the fractionation of carboxylation, and εdiff is the fractionation of diffusion in air. The relation of δD in plant leaf waxes to δ13C has been empirically measured and results in a negative correlation of δD to water use efficiency. This can be explained in part by lower water use efficiency being associated with higher transpiration rates. Transpiration exhibits a normal isotope effect, causing enrichment of deuterium in plant leaf water and therefore enrichment of leaf waxes.

![[1]](https://web.archive.org/web/20160803144955/http://wateriso.utah.edu/waterisotopes/media/IsoMaps/jpegs/h_Global/hma_global.jpg)
Ecology
Migration patterns
Deuterium abundance can be useful in tracking migration of various animals. [254] Animals with metabolically inert tissue (e.g. feathers or hair) will have synthesized that tissue using hydrogen from source water and food but ideally not incorporate subsequent water over the course of the migration. Because δD tends to vary geographically, the difference between animal tissue δD and post-migration water δD, after accounting for the biological fractionation of assimilation, can provide information regarding animal movement. In monarch butterflies, for example, wing chitin is metabolically inert after it has been built, so it can reflect the isotopic composition of the environmental water at the time and location of wing growth. This then creates a record of butterfly origin and can be used to determine migration distance. [255] This approach can also be used in bats and birds, using hair and feathers, respectively. [256] [257] Since rainwater becomes depleted as elevation is increased, this method can also track altitudinal migration. However, this is technically difficult to do, and the resolution appears to be too poor to track small altitudinal changes. [257] Deuterium is most useful in tracking movement of species between areas with large continental water variation, because species movement can be complicated by the similarity of local water δD values between different geographic regions. For example, source water from Baja California may have the same δD as water from Maine. [258] Further, a proportion of the hydrogen isotope composition within the tissue can exchange with water and complicate the interpretation of measurements. In order to determine this percentage of isotopic exchange, which varies according to local humidity levels, standards of metabolically inert tissue from the species of interest can be constructed and equilibrated to local conditions. This allows measured δD from different geographic regions to be compared against each other. [259]
Trophic interactions
Assimilation of diet into tissue has a tissue-specific fractionation known as the trophic discrimination factor. Diet sources can be tracked through a food web via deuterium isotope profiles, although this is complicated by deuterium having two potential sources – water and food. Food more strongly impacts δD than does exchange with surrounding water, and that signal is seen across trophic levels. [260] However, different organisms derive organic hydrogen in varying ratios of water to food: for example, in quail, 20-30% of organic hydrogen was from water and the remainder from food. The precise percentage of hydrogen from water was dependent on tissue source and metabolic activity. [261] In chironomids, 31-47% of biomass hydrogen derived from water, [260] and in microbes as much as 100% of fatty acid hydrogen can be derived from water depending on substrate. [186] In caterpillars, diet δD from organic matter correlates linearly with tissue δD. The same relationship does not appear to hold consistently for diet δD from water, however – water derived from either the caterpillar or its prey plant is more deuterium enriched than their organic material. Going up trophic levels from prey (plant) to predator (caterpillar) results in an isotopic enrichment. [262] This same trend of enrichment is seen in many other animals - carnivores, omnivores, and herbivores - and appears to follow 15N relative abundances. Carnivores at the same trophic level tend to exhibit the same level of 2H enrichment. [263] Because, as mentioned earlier, the amount of organic hydrogen produced from water varies between species, a model of trophic level related to absolute fractionation is difficult to make if the participating species are not known. Consistency in measuring the same tissues is also important, as different tissues fractionate deuterium differently. In aquatic systems, tracking trophic interactions is valuable for not only understanding the ecology of the system, but also for determining the degree of terrestrial input. [33] [264] The patterns of deuterium enrichment consistent within trophic levels is a useful tool for assessing the nature of these interactions in the environment. [33]
Microbial metabolism
Biological deuterium fractionation through metabolism is very organism and pathway dependent, resulting in a wide variability in fractionations. [186] [265] Despite this, some trends still hold. Hydrogen isotopes tend to fractionate very strongly in autotrophs relative to heterotrophs during lipid biosynthesis - chemoautotrophs produce extremely depleted lipids, with the fractionation ranging from roughly −200 to −400‰. [266] This has been observed both in laboratory-grown cultures fed a known quantity of deuterated water and in the environment. [186] [267] Proteins, however, do not follow as significant a trend, with both heterotrophs and autotrophs capable of generating large and variable fractionations. [266] In part, kinetic fractionation of the lighter isotope during formation of reducing equivalents NADH and NADPH result in lipids and proteins that are isotopically lighter.
Salinity appears to play a role in the degree of deuterium fractionation as well; more saline waters affect growth rate, the rate of hydrogen exchange, and evaporation rate. All of these factors influence lipid δD upon hydrogen being incorporated into biomass. In coccolithophores Emiliania huxleyi and Gephyrocapsa oceanica, alkenone δD has been found to correlate strongly to organism growth rate divided by salinity. [202] The relationship between deuterium fractionation and salinity could potentially be used in paleoenvironment reconstruction with preserved lipids in the rock record to determine, for example, ocean salinity at the time of organismal growth. However, the degree of fractionation is not necessarily consistent between organisms, complicating the determination of paleosalinity with this method. [202] There also appears to be a negative correlation between growth rate and fractionation in these coccolithophores. Further experiments on unicellular algae Eudorina unicocca and Volvox aureus show no effect of growth rate (controlled by nitrogen limitation) on fatty acid δD. However, sterols become more D-depleted as growth rate increases, [268] in agreement with alkenone isotopic composition in coccolithophores. Overall, although there are some strong trends with lipid δD, the specific fractionations are compound-specific. As a result, any attempt to create a salinometer through δD measurements will necessarily be specific to a single compound type.
Environmental chemistry
An important goal of environmental chemistry is tracing the source and degradation of pollutants. Various methods have been employed for fingerprinting pools of environmental pollutants such as the bulk chemical composition of a spill, [269] isotope ratios of the bulk chemical mixture, [270] or isotope ratios of individual constituent compounds. Stable isotopes of carbon and hydrogen can be used as complementary fingerprinting techniques for natural gas. [271] Recently, the D/H ratio of hydrocarbons from the Deepwater Horizon oil spill was used to verify that their origin was likely from the Macondo well. [272] Hydrogen isotope ratios have also been used as a measure of the relative amount of biodegradation that has occurred in oil reservoirs in China, [273] and studies on pure cultures of n-alkane degrading organisms have shown a chain-length dependence on the amount of hydrogen isotope fractionation during degradation. [274] Additional studies have also shown hydrogen isotope effects in the degradation of Methyl tert-butyl ether [275] and Toluene [276] [277] that have been suggested to be useful in the evaluation of the level of degradation of these polluting compounds in the environment. In both cases the residual unreacted compounds became enriched in deuterium to a few tens of per mil, with variations exhibited between different organisms and degree of reaction completeness. These observations of heavy residual compounds have been applied to field observations of biodegradation reactions such as the removal of benzene and ethylbenzene, [278] which imparted a D/H fractionation of 27 and 50 per mil, respectively. Additionally analysis of o-xylene in a polluted site showed high residual D/H ratios after biodegradation, consistent with activation of C-H bonds being a rate limiting step in this process [279]
Source attribution and forensics
Stable isotope ratios have found uses in various instances where the authenticity or origin of a chemical compound is called into question. Such situations include assessing the authenticity of food, wine and natural flavors; drug screening in sports (see doping); pharmaceuticals; illicit drugs; and even helping identify human remains. In these cases it is often not sufficient to detect or quantify a certain compound, since the question is the origin of the compound. The strength of hydrogen isotope analysis in answering these questions is that in many cases the D/H ratio of a natural product is related to the natural water D/H values in the area where the product was formed (see: Hydrologic cycle). Since D/H ratios vary significantly between different geographic areas, this can serve as a powerful tool in locating the original source of many different substance.
Food and flavor authentication
Foods, flavorings and scents are often sold with the guarantee that chemical additives come from natural sources. This claim becomes difficult to evaluate when the chemical compound has a known structure and is readily synthesized in the lab. Authentication of claims regarding the origins of these chemicals has made good use of various stable isotopes, including those of hydrogen. Combined carbon and hydrogen isotope analysis has been used to test the authenticity of (E)-methyl cinnamate, [280] γ-decalactone and δ-decalactone. [281] Hydrogen and nitrogen isotope ratios have been used for the authentication of alkylpyrazines used as "natural" coffee flavorings. [282]
Doping
The isotope ratio of carbon in the steroids of athletes has been used to determine whether these steroids originated from the body of the athlete or an exogenous source. This test has been used in a number of high-profile anti-doping cases and has various benefits over simply characterizing the concentration of various compounds. Attempts are being made to create similar tests based on stable hydrogen isotopes [283] which could be used to complement the existing testing methods. One concern with this method was that the natural steroids produced by the human body may vary significantly based on the deuterium content of drinking water, leading to false detection of doping based on hydrogen isotope differences. This concern has been addressed in a recent study which concluded that the effect of D/H ratio of drinking water did not pose an insurmountable source of error for this anti-doping testing strategy. [284]
Pharmaceutical copies
The pharmaceutical industry has revenues in the hundreds of billions of dollars a year globally. With such a large industry counterfeiting and copyright infringement are serious issues, and hydrogen isotope fingerprinting has become a useful tool in verifying the authenticity of various drugs. As described in the preceding sections, the utility of D/H ratios highest when combined with measurements of other isotope ratios as well. In an early study on the stable isotope compositions of tropicamide, hydrocortisone, quinine and tryptophan, carbon, nitrogen, oxygen and hydrogen stable isotopes were analyzed by EA-IRMS and clear distinctions were able to be made between manufacturers and even batches of the drugs based on their isotope signatures. [285] In this study it was determined that the hydrogen and oxygen isotope ratios were the two best fingerprints for distinguishing between different drug sources. A follow-up study analyzing naproxen from various lots and manufacturers also showed similar ability to distinguish between sources of the drugs. [286] The use of these isotope signatures could not only be used to distinguish between different manufacturers, but also between different synthetic pathways for the same compound. [287] These studies relied on the natural variations that occurred in the synthesis of these drugs, but other studies have used starting ingredients that are intentionally labelled D and 13C, and showed that these labels could be traced into the final pharmaceutical product. [288] D/H ratios can also be determined for specific sites in a drug by 2H NMR, and has been used to distinguish between different synthetic methods for ibuprofen and naproxen in one study, [289] and prozac and fluoxetine in another. [290] These studies show that bulk D/H ratio information for EA-IRMS, and site-specific D/H ratios from 2H NMR have great utility for pharmaceutical drug authenticity testing.
Illicit drugs
The sources and production mechanisms of illegal drugs has been another area that has seen successful application of hydrogen isotope characterization. Usually, as with other applications of stable isotope techniques, results are best when combination of multiple stable isotopes are compared with one another. δ2H, δ13C and δ15N have been used together to analyze tablets of MDA and MDMA and has successfully identified differences which could be used to differentiate between different sources or production mechanisms. [291] The same combination of stable isotopes with the addition of δ18O was applied to heroin and associated packaging and could successfully distinguish between different samples. [292] Analysis using deuterium NMR was also able to shed light on the origin and processing of both cocaine and heroin. [293] In the case of heroin this site-specific natural isotopic fraction measured by deuterium NMR (SNIF-NMR) method could be used for determining the geographic origin of the molecule by analyzing so-called natural sites (which were present in the morphine from which heroin is made), as well as gaining information on the synthesis process by analyzing the artificial sites (added during drug processing).
Provenance of human remains
The geographical variation in D/H ratio in human drinking water is recorded in hair. Studies have shown a very strong relation between an individual's hair and drinking water D/H ratios. [294]
Since tap water D/H ratio has a strong dependence on geography, a person's hair D/H ratio can be used to determine regions in which they were most likely living during hair growth. This idea has been used in criminal investigations to try and constrain the movements of a person prior to their death, in much the same way D/H ratios have been used to track animal migrations. By analyzing sections of hair of varying ages it is possible to determine in what D/H regions a person was living at a specific time prior to their death. [295]
See also
References
- ^ Urey, Harold C. (1932-01-01). "A Hydrogen Isotope of Mass 2". Physical Review. 39 (1): 164–165. Bibcode: 1932PhRv...39..164U. doi: 10.1103/PhysRev.39.164.
- ^ Chadwick, J. (1933-10-01). "Bakerian Lecture. The Neutron". Proceedings of the Royal Society of London A: Mathematical, Physical and Engineering Sciences. 142 (846): 1–25. Bibcode: 1933RSPSA.142....1C. doi: 10.1098/rspa.1933.0152.
- ^ "The Nobel Prize in Chemistry 1934". www.nobelprize.org. Retrieved 2016-05-13.
- ^ a b "Lawrence and His Laboratory: Episode: A Productive Error". www2.lbl.gov. Retrieved 2016-05-13.
- ^ Alvarez, Luis W.; Cornog, Robert (1939-09-15). "Helium and Hydrogen of Mass 3". Physical Review. 56 (6): 613. Bibcode: 1939PhRv...56..613A. doi: 10.1103/PhysRev.56.613.
- ^ Lucas, L.L.; Unterweger, M.P. (2000-07-01). "Comprehensive review and critical evaluation of the half-life of tritium". Journal of Research of the National Institute of Standards and Technology. 105 (4): 541–9. doi: 10.6028/jres.105.043. PMC 4877155. PMID 27551621.
- ^ Wishart, D. S.; Sykes, B. D.; Richards, F. M. (1992-02-01). "The chemical shift index: a fast and simple method for the assignment of protein secondary structure through NMR spectroscopy". Biochemistry. 31 (6): 1647–1651. CiteSeerX 10.1.1.539.2952. doi: 10.1021/bi00121a010. PMID 1737021.
- ^ Caligiani, A.; Acquotti, D.; Palla, G.; Bocchi, V. (2007-02-28). "Identification and quantification of the main organic components of vinegars by high resolution 1H NMR spectroscopy". Analytica Chimica Acta. 585 (1): 110–119. doi: 10.1016/j.aca.2006.12.016. PMID 17386654.
- ^ Pake, G. E. (1948-04-01). "Nuclear Resonance Absorption in Hydrated Crystals: Fine Structure of the Proton Line". The Journal of Chemical Physics. 16 (4): 327–336. Bibcode: 1948JChPh..16..327P. doi: 10.1063/1.1746878.
- ^ "Ray-Freeman.org | The Dawn of NMR". www.ray-freeman.org. Archived from the original on 2016-03-09. Retrieved 2016-05-13.
- ^ Dufourc, Erick J.; Parish, Edward J.; Chitrakorn, Sarawanee; Smith, Ian C. P. (1984-12-01). "Structural and dynamical details of cholesterol-lipid interaction as revealed by deuterium NMR". Biochemistry. 23 (25): 6062–6071. doi: 10.1021/bi00320a025.
- ^ Martin, Gérard J.; Akoka, Serge; Martin, Maryvonne L. (2008-01-01). Webb, Graham A. (ed.). SNIF-NMR—Part 1: Principles. Springer Netherlands. pp. 1651–1658. doi: 10.1007/1-4020-3910-7_185. ISBN 9781402038945.
- ^ Allen, Benjamin D.; Cintrat, Jean-Christophe; Faucher, Nicolas; Berthault, Patrick; Rousseau, Bernard; O'Leary, Daniel J. (2005-01-01). "An Isosparteine Derivative for Stereochemical Assignment of Stereogenic (Chiral) Methyl Groups Using Tritium NMR: Theory and Experiment". Journal of the American Chemical Society. 127 (1): 412–420. doi: 10.1021/ja045265i. PMID 15631492.
- ^ "Tritium Production - Nuclear Weapons". fas.org. Archived from the original on 2016-05-03. Retrieved 2016-05-13.
- ^ a b "Operation Greenhouse". nuclearweaponarchive.org. Retrieved 2016-05-13.
- ^ "Congress to Address Helium-3 Shortage Hurting Scientific Research and Nuclear Security". Popular Science. 20 April 2010. Retrieved 2016-05-13.
- ^ Eveleth, Rose. "Nuclear Bombs Made It Possible to Carbon Date Human Tissue". Smithsonian. Retrieved 2016-05-13.
-
^ Laboratory, US Department of Commerce, NOAA, Earth System Research.
"ESRL Global Monitoring Division - Education and Outreach". www.esrl.noaa.gov-US. Retrieved 2016-05-13.
{{
cite web}}
: CS1 maint: multiple names: authors list ( link) - ^ England, Matthew H.; Maier-Reimer, Ernst (2001-02-01). "Using chemical tracers to assess ocean models". Reviews of Geophysics. 39 (1): 29–70. Bibcode: 2001RvGeo..39...29E. doi: 10.1029/1998RG000043. hdl: 21.11116/0000-0005-0A65-F. S2CID 42081518.
- ^ Craig, Harmon (May 26, 1961). "Isotopic Variations in Meteoric Waters" (PDF). Science. 133 (3465): 1702–1703. Bibcode: 1961Sci...133.1702C. doi: 10.1126/science.133.3465.1702. PMID 17814749. S2CID 34373069.
- ^ Zborowski, G; Ponticorvo, L; Rittenberg, D (1967-10-01). "On the constancy of deuterium fractionation in the biosynthesis of fatty acids since the miocene period". Proceedings of the National Academy of Sciences of the United States of America. 58 (4): 1660–1663. Bibcode: 1967PNAS...58.1660Z. doi: 10.1073/pnas.58.4.1660. PMC 223976. PMID 5237893.
- ^ Smith, Bruce; Epstein, Samuel (1970). "Biogeochemistry of the stable isotopes of hydrogen and carbon in salt marsh biota". Plant Physiology. 46 (5): 738–742. doi: 10.1104/pp.46.5.738. PMC 396670. PMID 16657539.
- ^ Schiegl, W. E.; Vogel, J. C. (1970-01-01). "Deuterium content of organic matter". Earth and Planetary Science Letters. 7 (4): 307–313. Bibcode: 1970E&PSL...7..307S. doi: 10.1016/0012-821X(69)90041-7.
- ^ Estep, Marilyn F.; Hoering, Thomas C. (1980-08-01). "Biogeochemistry of the stable hydrogen isotopes". Geochimica et Cosmochimica Acta. 44 (8): 1197–1206. Bibcode: 1980GeCoA..44.1197E. doi: 10.1016/0016-7037(80)90073-3.
- ^ a b c Epstein, Samuel; Yapp, Crayton J.; Hall, John H. (1976-05-01). "The determination of the D/H ratio of non-exchangeable hydrogen in cellulose extracted from aquatic and land plants". Earth and Planetary Science Letters. 30 (2): 241–251. Bibcode: 1976E&PSL..30..241E. doi: 10.1016/0012-821X(76)90251-X.
- ^ Sternberg, Leonel; Deniro, Michael J.; Ajie, Henry (1984-01-01). "Stable hydrogen isotope ratios of saponifiable lipids and cellulose nitrate from cam, C3 and C4 plants". Phytochemistry. 23 (11): 2475–2477. doi: 10.1016/S0031-9422(00)84078-9.
- ^ Schoell, Martin (1980-05-01). "The hydrogen and carbon isotopic composition of methane from natural gases of various origins". Geochimica et Cosmochimica Acta. 44 (5): 649–661. Bibcode: 1980GeCoA..44..649S. doi: 10.1016/0016-7037(80)90155-6.
- ^ a b Sessions, Alex L. (2016-06-01). "Factors controlling the deuterium contents of sedimentary hydrocarbons". Organic Geochemistry. 96: 43–64. Bibcode: 2016OrGeo..96...43S. doi: 10.1016/j.orggeochem.2016.02.012.
- ^ Wang, David T.; Gruen, Danielle S.; Lollar, Barbara Sherwood; Hinrichs, Kai-Uwe; Stewart, Lucy C.; Holden, James F.; Hristov, Alexander N.; Pohlman, John W.; Morrill, Penny L. (2015-04-24). "Nonequilibrium clumped isotope signals in microbial methane". Science. 348 (6233): 428–431. Bibcode: 2015Sci...348..428W. doi: 10.1126/science.aaa4326. hdl: 1721.1/95903. PMID 25745067. S2CID 206634401.
- ^ Eiler, John M. (2007-10-30). ""Clumped-isotope" geochemistry—The study of naturally-occurring, multiply-substituted isotopologues". Earth and Planetary Science Letters. 262 (3–4): 309–327. Bibcode: 2007E&PSL.262..309E. doi: 10.1016/j.epsl.2007.08.020.
- ^ Eiler, John M. (2011-12-01). "Paleoclimate reconstruction using carbonate clumped isotope thermometry". Quaternary Science Reviews. 30 (25–26): 3575–3588. Bibcode: 2011QSRv...30.3575E. doi: 10.1016/j.quascirev.2011.09.001.
- ^ a b Sessions, Alex L.; Burgoyne, Thomas W.; Schimmelmann, Arndt; Hayes, John M. (1999-09-01). "Fractionation of hydrogen isotopes in lipid biosynthesis". Organic Geochemistry. 30 (9): 1193–1200. Bibcode: 1999OrGeo..30.1193S. doi: 10.1016/S0146-6380(99)00094-7.
- ^ a b c Doucett, Richard R.; Marks, Jane C.; Blinn, Dean W.; Caron, Melanie; Hungate, Bruce A. (2007-06-01). "Measuring terrestrial subsidies to aquatic food webs using stable isotopes of hydrogen". Ecology. 88 (6): 1587–1592. doi: 10.1890/06-1184. PMID 17601150.
- ^ Eiler, John M.; Clog, Matthieu; Magyar, Paul; Piasecki, Alison; Sessions, Alex; Stolper, Daniel; Deerberg, Michael; Schlueter, Hans-Juergen; Schwieters, Johannes (2013-02-01). "A high-resolution gas-source isotope ratio mass spectrometer". International Journal of Mass Spectrometry. 335: 45–56. Bibcode: 2013IJMSp.335...45E. doi: 10.1016/j.ijms.2012.10.014.
- ^ Hayes, John M. "An introduction to isotopic calculations." Woods Hole Oceanographic Institution, Woods Hole, MA 2543 (2004).
- ^ Rolston, J. H.; Den Hartog, J.; Butler, J. P. (1976). "The deuterium isotope separation factor between hydrogen and liquid water". The Journal of Physical Chemistry. 80 (10): 1064–1067. doi: 10.1021/j100551a008.
- ^ "Origin of the Elements". www2.lbl.gov. Retrieved 2016-05-13.
- ^ Borexino Collaboration (2014-08-28). "Neutrinos from the primary proton-proton fusion process in the Sun". Nature. 512 (7515): 383–386. Bibcode: 2014Natur.512..383B. doi: 10.1038/nature13702. PMID 25164748. S2CID 205240340.
- ^ Dingwall, S.; Mills, C.E.; Phan, N.; Taylor, K.; Boreham, D.R. (2011-02-22). "Human Health and the Biological Effects of Tritium in Drinking Water: Prudent Policy Through Science – Addressing the ODWAC New Recommendation". Dose-Response. 9 (1): 6–31. doi: 10.2203/dose-response.10-048.Boreham. PMC 3057633. PMID 21431084.
- ^ "Spin classification of particles". hyperphysics.phy-astr.gsu.edu. Retrieved 2016-05-13.
- ^
a
b
c
d
e Rozanski, Kazimierz; Araguas-Araguas, Luis; Gonfiantini, Roberto (1993). Isotopic patterns in modern global precipitation. Geophysical Monograph Series. Vol. 78. pp. 1–36.
Bibcode:
1993GMS....78....1R.
doi:
10.1029/GM078p0001.
ISBN
9781118664025.
{{ cite book}}:|journal=ignored ( help) - ^ McQuarrie, Donald A (2007). Quantum Chemistry. University Science Books. ISBN 978-1891389504.
- ^ Fisher, Matthew P. A.; Weichman, Peter B.; Grinstein, G.; Fisher, Daniel S. (1989-07-01). "Boson localization and the superfluid-insulator transition" (PDF). Physical Review B. 40 (1): 546–570. Bibcode: 1989PhRvB..40..546F. doi: 10.1103/PhysRevB.40.546. PMID 9990946.
- ^ Hutchinson, John S.; Iii, Edwin L. Sibert; Hynes, James T. (1984-08-01). "Quantum dynamics of energy transfer between bonds in coupled Morse oscillator systems". The Journal of Chemical Physics. 81 (3): 1314–1326. Bibcode: 1984JChPh..81.1314H. doi: 10.1063/1.447763.
- ^ Young, Edward D.; Galy, Albert; Nagahara, Hiroko (2002-03-15). "Kinetic and equilibrium mass-dependent isotope fractionation laws in nature and their geochemical and cosmochemical significance". Geochimica et Cosmochimica Acta. 66 (6): 1095–1104. Bibcode: 2002GeCoA..66.1095Y. doi: 10.1016/S0016-7037(01)00832-8.
- ^ a b c d Schimmelmann, Arndt; Sessions, Alex (2006). "Hydrogen isotopic (D/H) composition of organic matter during diagenesis and thermal maturation" (PDF). Annu. Rev. Earth Planet. Sci. 34: 501–533. Bibcode: 2006AREPS..34..501S. doi: 10.1146/annurev.earth.34.031405.125011.
- ^ Sessions, Alex (2004). "Isotopic exchange of carbon-bound hydrogen over geologic timescales". GCA. 68 (7): 1545–1559. Bibcode: 2004GeCoA..68.1545S. doi: 10.1016/j.gca.2003.06.004.
- ^ O'Neil, James R; Kharaka, Yousif K (1976-02-01). "Hydrogen and oxygen isotope exchange reactions between clay minerals and water". Geochimica et Cosmochimica Acta. 40 (2): 241–246. Bibcode: 1976GeCoA..40..241O. doi: 10.1016/0016-7037(76)90181-2.
- ^ Klopper, Wim.; Kutzelnigg, Werner. (1990-07-01). "MP2-R12 calculations on the relative stability of carbocations". The Journal of Physical Chemistry. 94 (14): 5625–5630. doi: 10.1021/j100377a040.
- ^ "Mythical Carbocations?". chemistry.umeche.maine.edu. Archived from the original on 2015-10-25. Retrieved 2016-05-13.
- ^ a b c d e f g Sessions, Alex (2016). "Factors controlling the deuterium contents of sedimentary hydrocarbons". Organic Geochemistry. 96: 43–64. Bibcode: 2016OrGeo..96...43S. doi: 10.1016/j.orggeochem.2016.02.012.
- ^ Hopfner, A (October 1969). "Vapor Pressure Isotope Effects". Angewandte Chemie. 8 (10): 689–699. doi: 10.1002/anie.196906891.
- ^ Modified by inserting the data from [Clog, Matthieu; Aubaud, Cyril; Cartigny, Pierre; Dosso, Laure (2013). "The hydrogen isotopic composition and water content of southern Pacific MORB: A reassessment of the D/H ratio of the depleted mantle Reservoir". Planetary Science Letters 381: 156–165.] and [Englebrecht A. C., Sachs J. P. (2005) Determination of sediment provenance at drift sites using hydrogen isotopes and unsaturation ratios in allkenones. Geochimina et Cosmochimica Acta, Vol. 69, No. 17, pp. 4253–4265] on the map from http://waterisotopes.org
- ^ Clog, Matthieu; Aubaud, Cyril; Cartigny, Pierre; Dosso, Laure (2013). "The hydrogen isotopic composition and water content of southern Pacific MORB: A reassessment of the D/H ratio of the depleted mantle Reservoir" (PDF). Planetary Science Letters. 381: 156–165. Bibcode: 2013E&PSL.381..156C. doi: 10.1016/j.epsl.2013.08.043. S2CID 54747800.
- ^ Englebrecht, A.C. & Sachs, J.P. (2005) Determination of sediment provenance at drift sites using hydrogen isotopes and unsaturation ratios in allkenones. Geochimina et Cosmochimica Acta, Vol. 69, No. 17, pp. 4253–4265
- ^ Modified by inserting data values on the map from Annu.Rev.Earth Planet.Sci.2010.38:161–187
- ^ a b Lecuyer, C; et al. (1998). "The Hydrogen isotope composition of seawater and the global water cycle". Chemical Geology. 145 (3–4): 249–261. Bibcode: 1998ChGeo.145..249L. doi: 10.1016/s0009-2541(97)00146-0.
- ^ Masson-Delmotte, V et al. (2008) A Review of Antarctic Surface Snow Isotopic Composition: Observations, Atmospheric Circulation, and Isotopic Modeling. American Meteorological Society. 3359–3387.
- ^ Modified by inserting the data from a paper [Frankenberg C. et al. (2009) Dynamic Processes Governing Lower-Tropospheric HDO/H2O Ratios as Observed from Space and Ground. Science 325, 1374–1377.] on the map from Annu.Rev.Earth Planet.Sci.2010.38:161–187
- ^ Frankenberg, C.; Yoshimura, K.; Warneke, T.; Aben, I.; Butz, A.; Deutscher, N.; Griffith, D.; Hase, F.; Notholt, J.; Schneider, M.; Schrijver, H.; Röckmann, T. (2009). "Dynamic Processes Governing Lower-Tropospheric HDO/H2O-nl Ratios as Observed from Space and Ground". Science. 325 (5946): 1374–1377. Bibcode: 2009Sci...325.1374F. doi: 10.1126/science.1173791. PMID 19745148. S2CID 13043951.
- ^ White, J.W.C. & Gedzelman, S.D. (1984) The isotopic composition of atmospheric water vapor and the concurrent meteorological conditions. JGR: Atmospheres. Vol. 89. Issue D3. 4937–4939.
- ^ Sacese et al.
- ^ See Section 6. Hydrologic Cycle for more details.
- ^ Modified by inserting the data from waterisotopes.org on the map
- ^ a b "WaterIsotopes.org". wateriso.utah.edu.
- ^ a b Clark, Ian; Fritz, Peter. "Environmental Isotopes in Hydrogeology". mysite.science.uottawa.ca.
- ^ See Section 6.1. Isotopic fractionation in the hydrologic cycle for more details.
- ^ Modified by inserting the data values from waterisotopes.org on the map from Annu.Rev.Earth Planet.Sci.2010.38:161–187.
- ^ Sachse, D (2012). "Molecular Paleohydrology: Interpreting the Hydrogen-Isotopic Composition of Lipid Biomarkers from Photosynthesizing Organisms" (PDF). Annu. Rev. Earth Planet. Sci. 40 (1): 221–249. Bibcode: 2012AREPS..40..221S. doi: 10.1146/annurev-earth-042711-105535.
- ^ a b See Section 7.1. Isotope hydrology for more details.
- ^ a b c d Zhang, Z; et al. (2008). "Hydrogen isotope fractionation in freshwater and marine algae: II. Temperature and nitrogen limited growth rate effects". Organic Geochemistry. 40 (3): 428–439. Bibcode: 2009OrGeo..40..428Z. doi: 10.1016/j.orggeochem.2008.11.002.
- ^ Sauer P. E. et al., (2000) Compound-specific D/H ratios of lipid biomarkers from sediments as a proxy for environmental and climatic conditions. Geochimica et Cosmochimica Acta. Vol. 65, No. 2, pp. 213–222.
- ^ Sachs J.P. (2014) Hydrogen Isotope Signatures in the Lipids of Phytoplankton. In: Holland H.D. and Turekian K.K. (eds.) Treatise on Geochemistry, Second Edition, vol. 12, pp. 79–94. Oxford: Elsevier.
- ^ a b c Sessions, A.L. (2002) Hydrogen isotope fractionation in lipids of the methane-oxidizing bacterium Methylococcus capsulatus. Geochimica et Cosmochimica Acta, 66. 22: 3955–3969.
- ^ See Section 7.5.3. Microbial metabolism for more details.
- ^ a b c d Sachse, D; et al. (2012). "Molecular Paleohydrology: Interpreting the Hydrogen-Isotopic Composition of Lipid Biomarkers from Photosynthesizing Organisms" (PDF). Annu. Rev. Earth Planet. Sci. 40 (1): 221–249. Bibcode: 2012AREPS..40..221S. doi: 10.1146/annurev-earth-042711-105535.
- ^ See Section 7.2.2.2. Plant leaf waxes for more details.
- ^ a b c Schmidt, H.L.; Werner, R.A.; Eisenreich, W. (2003). "Systematics of D patterns in natural compounds and its importance for the elucidation of biosynthetic pathways". Phytochemistry Reviews. 2 (1–2): 61–85. Bibcode: 2003PChRv...2...61S. doi: 10.1023/b:phyt.0000004185.92648.ae. S2CID 12943614.
- ^ Sessions, A.L. et al. (1999) Fractionation of hydrogen isotopes in lipid biosynthesis. Organic Geochemistry. 30. 1193–1200
- ^ Zhang, B.L.; et al. (2002). "Hydrogen isotopic profile in the characterization of sugars. Influence of the metabolic pathway". J Agric Food Chem. 50 (6): 1574–1580. doi: 10.1021/jf010776z. PMID 11879039.
- ^ Hou et al., 2008
- ^ a b Soto, D. X., Wassenaar, L. I., Hobson, K. A., (2013) Stable hydrogen and oxygen isotopes in aquatic food webs are tracers of diet and provenance. Functional Ecology. Vol. 27. Issue. 2. 535–543.
- ^ See Section 7.3.3. Oil for more details.
- ^ Waseda, Amane (1993). "Effect of maturity on carbon and hydrogen isotopes of crude oils in Northeast Japan". Journal of the Japanese Association for Petroleum Technology. 58 (3): 199–208. doi: 10.3720/japt.58.199.
- ^ a b dos Santos Neto, EV; Hayes, JM (1999). "Use of hydrogen and carbon stable isotopes characterizing oils from the Portiguar Basin in Northeastern Brazil". AAPG Bulletin. 83 (3): 496–518. doi: 10.1306/00aa9be2-1730-11d7-8645000102c1865d.
- ^ Modified by inserting the data from [Englebrecht, A. C. Sachs. J. P. (2005) Determination of sediment provenance at drift sites using hydrogen isotopes and unsaturation ratios in alkenones. Geochimica et Cosmochimica Acta. 69. 17:4253–4265.] on the map from Annu.Rev.Earth Planet.Sci.2010.38:161–187.
- ^ Englebrecht, A.C. & Sachs. J.P. (2005) Determination of sediment provenance at drift sites using hydrogen isotopes and unsaturation ratios in alkenones. Geochimica et Cosmochimica Acta. 69. 17:4253–4265.
- ^ See Section 7.2.2.3. Alkenones for more details.
- ^ Modified by inserting the data from papers by Redding (1980), Rigby and Smith (1981), and Smith (1983) on the map from Annu.Rev.Earth Planet.Sci.2010.38:161–187.
- ^ See Section 7.3.1. Kerogens and Coals for more details.
- ^ Redding, C.E. (1980). "Hydrogen and carbon isotopic composition of coals and kerogens". Physics and Chemistry of the Earth. 12: 711–723. Bibcode: 1980PCE....12..711R. doi: 10.1016/0079-1946(79)90152-6.
- ^ Rigby, D.; Batts, B.D.; Smith, J.W. (1981). "The effect of maturation on the isotopic composition of fossil fuels". Organic Geochemistry. 3 (1–2): 29–36. Bibcode: 1981OrGeo...3...29R. doi: 10.1016/0146-6380(81)90010-3.
- ^ Smith, J.W. (1983). "D/H ratio of coals and palaeolatitude of their deposition". Nature. 302 (5906): 322–323. Bibcode: 1983Natur.302..322S. doi: 10.1038/302322a0. S2CID 4317372.
- ^ See Section 7.3.2. Natural gas for more details.
- ^ a b Whiticar, Michael (1999). "Carbon and hydrogen isotope systematics of bacterial formation and oxidation of methane". Chemical Geology. 161 (1–3): 291–314. Bibcode: 1999ChGeo.161..291W. doi: 10.1016/S0009-2541(99)00092-3.
- ^ Hoefs, J. (2009). Stable isotope geochemistry (6th ed.). doi: 10.1007/978-3-540-70708-0
- ^ References in a more detailed format are included in the main text.
- ^ Sheppard, S. M. F., Gilg, H. A. (1996) Stable Isotope Geochemistry of Clay Minerals. Clay Minerals. 31, 1–24.
- ^ Hoefs, J. (2009). Stable isotope geochemistry (6th ed.). doi: 10.1007/978-3-540-70708-0
- ^ Robert, F. 2006. Solar System Deuterium/Hydrogen Ratio. Meteorites and the Early Solar System II, D. S. Lauretta and H. Y. McSween Jr. (eds.), University of Arizona Press, Tucson, 943 pp., p.341-351
- ^ Pinti, Daniele (2011). Deuterium/Hydrogen Ratio, Encyclopedia of Astrobiology. Berlin Heidelberg: Springer-Verlag.
- ^ "Deuterium-to-hydrogen ratio in the Solar System".
- ^ McKeegan, K. D., Leshin, L. A. (2001) Stable Isotope Variations in Extraterrestrial Materials. Reviews in Mineralogy and Geochemistry. 43. (1)
- ^ a b Sessions, Alex L. (2006-08-01). "Isotope-ratio detection for gas chromatography". Journal of Separation Science. 29 (12): 1946–1961. doi: 10.1002/jssc.200600002. PMID 16970194.
- ^ Hoefs, Jochen (2009), Stable Isotope Geochemistry (PDF) (6th ed.), Springer-Verlag Berlin Heidelberg, doi: 10.1007/978-3-540-70708-0, ISBN 978-3-642-08960-2
- ^ Bigeleisen, Jacob; Perlman, M. L.; Prosser, H. C. (1952-08-01). "Conversion of Hydrogenic Materials to Hydrogen for Isotopic Analysis". Analytical Chemistry. 24 (8): 1356–1357. doi: 10.1021/ac60068a025.
- ^ Godfrey, John D. (1962-12-01). "The deuterium content of hydrous minerals from the East-Central Sierra Nevada and Yosemite National Park". Geochimica et Cosmochimica Acta. 26 (12): 1215–1245. Bibcode: 1962GeCoA..26.1215G. doi: 10.1016/0016-7037(62)90053-4.
- ^ Graff, Jack; Rittenberg, David (1952-05-01). "Microdetermination of Deuterium in Organic Compounds". Analytical Chemistry. 24 (5): 878–881. doi: 10.1021/ac60065a032.
- ^ Friedman, Irving (1953-08-01). "Deuterium content of natural waters and other substances". Geochimica et Cosmochimica Acta. 4 (1): 89–103. Bibcode: 1953GeCoA...4...89F. doi: 10.1016/0016-7037(53)90066-0.
- ^ Schimmelmann, Arndt; DeNiro, Michael J. (1993-03-01). "Preparation of organic and water hydrogen for stable isotope analysis: effects due to reaction vessels and zinc reagent". Analytical Chemistry. 65 (6): 789–792. doi: 10.1021/ac00054a024.
- ^ Gehre, M.; Hoefling, R.; Kowski, P.; Strauch, G. (1996-01-01). "Sample Preparation Device for Quantitative Hydrogen Isotope Analysis Using Chromium Metal". Analytical Chemistry. 68 (24): 4414–4417. doi: 10.1021/ac9606766.
- ^ Redrawn figure referred to http://www.uwyo.edu/sif/instrumentation/tcea.html
- ^ Gehre, Matthias; Renpenning, Julian; Gilevska, Tetyana; Qi, Haiping; Coplen, Tyler B.; Meijer, Harro A. J.; Brand, Willi A.; Schimmelmann, Arndt (2015-05-19). "On-Line Hydrogen-Isotope Measurements of Organic Samples Using Elemental Chromium: An Extension for High Temperature Elemental-Analyzer Techniques" (PDF). Analytical Chemistry. 87 (10): 5198–5205. doi: 10.1021/acs.analchem.5b00085. PMID 25874646.
- ^ Kuder, Tomasz; Philp, Paul (2013-02-05). "Demonstration of Compound-Specific Isotope Analysis of Hydrogen Isotope Ratios in Chlorinated Ethenes". Environmental Science & Technology. 47 (3): 1461–1467. Bibcode: 2013EnST...47.1461K. doi: 10.1021/es303476v. PMID 23294482.
- ^ Gehre, Matthias; Renpenning, Julian; Gilevska, Tetyana; Qi, Haiping; Coplen, Tyler B.; Meijer, Harro A. J.; Brand, Willi A.; Schimmelmann, Arndt (2015). "On-Line Hydrogen-Isotope Measurements of Organic Samples Using Elemental Chromium: An Extension for High Temperature Elemental-Analyzer Techniques" (PDF). Analytical Chemistry. 87 (10): 5198–5205. doi: 10.1021/acs.analchem.5b00085. PMID 25874646.
- ^ Sauer, Peter E.; Schimmelmann, Arndt; Sessions, Alex L.; Topalov, Katarina (2009-04-15). "Simplified batch equilibration for D/H determination of non-exchangeable hydrogen in solid organic material". Rapid Communications in Mass Spectrometry. 23 (7): 949–956. Bibcode: 2009RCMS...23..949S. doi: 10.1002/rcm.3954. PMID 19241415.
- ^ Matthews, D. E.; Hayes, J. M. (1978-09-01). "Isotope-ratio-monitoring gas chromatography-mass spectrometry". Analytical Chemistry. 50 (11): 1465–1473. doi: 10.1021/ac50033a022.
- ^ a b Begley, Ian S.; Scrimgeour, Charles M. (1997-04-01). "High-Precision δ2H and δ18O Measurement for Water and Volatile Organic Compounds by Continuous-Flow Pyrolysis Isotope Ratio Mass Spectrometry". Analytical Chemistry. 69 (8): 1530–1535. doi: 10.1021/ac960935r.
- ^ a b Hilkert, A. W.; Douthitt, C. B.; Schlüter, H. J.; Brand, W. A. (1999-07-15). "Isotope ratio monitoring gas chromatography/Mass spectrometry of D/H by high temperature conversion isotope ratio mass spectrometry". Rapid Communications in Mass Spectrometry. 13 (13): 1226–1230. Bibcode: 1999RCMS...13.1226H. doi: 10.1002/(sici)1097-0231(19990715)13:13<1226::aid-rcm575>3.0.co;2-9. PMID 10407302.
-
^ Burgoyne, Thomas W.; Hayes, John M. (1998-12-01). "Quantitative Production of H
2 by Pyrolysis of Gas Chromatographic Effluents". Analytical Chemistry. 70 (24): 5136–5141. doi: 10.1021/ac980248v. - ^ Tobias, Herbert J.; Goodman, Keith J.; Blacken, Craig E.; Brenna, J. Thomas. (1995-07-01). "High-Precision D/H Measurement from Hydrogen Gas and Water by Continuous-Flow Isotope Ratio Mass Spectrometry". Analytical Chemistry. 67 (14): 2486–2492. doi: 10.1021/ac00110a025. PMID 8686878.
- ^ Bergamaschi, Peter; Schupp, Michael; Harris, Geoffrey W. (1994-11-20). "High-precision direct measurements of 13CH4/12CH4 and 12CH3D/12CH4 ratios in atmospheric methane sources by means of a long-path tunable diode laser absorption spectrometer". Applied Optics. 33 (33): 7704–16. Bibcode: 1994ApOpt..33.7704B. doi: 10.1364/AO.33.007704. PMID 20962979.
- ^ O'Keefe, Anthony; Deacon, David A. G. (1988-12-01). "Cavity ring-down optical spectrometer for absorption measurements using pulsed laser sources". Review of Scientific Instruments. 59 (12): 2544–2551. Bibcode: 1988RScI...59.2544O. doi: 10.1063/1.1139895.
- ^ Kerstel, E. R. Th.; van Trigt, R.; Reuss, J.; Meijer, H. A. J. (1999-12-01). "Simultaneous Determination of the 2H/1H, 17O/16O, and 18O/16O Isotope Abundance Ratios in Water by Means of Laser Spectrometry" (PDF). Analytical Chemistry. 71 (23): 5297–5303. doi: 10.1021/ac990621e. hdl: 11370/7d521457-d577-4369-9d3e-b014903523de. PMID 21662727.
- ^ Brand, Willi A.; Geilmann, Heike; Crosson, Eric R.; Rella, Chris W. (2009-06-30). "Cavity ring-down spectroscopy versus high-temperature conversion isotope ratio mass spectrometry; a case study on δ2H and δ18O of pure water samples and alcohol/water mixtures". Rapid Communications in Mass Spectrometry. 23 (12): 1879–1884. Bibcode: 2009RCMS...23.1879B. doi: 10.1002/rcm.4083. PMID 19449320.
-
^ Martin, Gérard J.; Akoka, Serge; Martin, Maryvonne L. (1 January 2008). SNIF-NMR—Part 1: Principles. pp. 1651–1658.
doi:
10.1007/1-4020-3910-7_185.
ISBN
978-1-4020-3894-5.
{{ cite book}}:|journal=ignored ( help) - ^ Martin, Gerard J.; Martin, Maryvonne L.; Mabon, Francoise.; Michon, Marie Jo. (November 1982). "Identification of the origin of natural alcohols by natural abundance hydrogen-2 nuclear magnetic resonance". Analytical Chemistry. 54 (13): 2380–2382. doi: 10.1021/ac00250a057.
- ^
a
b
c Martin, Maryvonne; Zhang, Benli; Martin, Gérard J. (1 January 2008). SNIF-NMR—Part 2: Isotope Ratios as Tracers of Chemical and Biochemical Mechanistic Pathways. pp. 1659–1667.
doi:
10.1007/1-4020-3910-7_186.
ISBN
978-1-4020-3894-5.
{{ cite book}}:|journal=ignored ( help) - ^ a b Schmidt, Hanns-Ludwig; Werner, Roland A.; Eisenreich, Wolfgang (January 2003). "Systematics of 2H patterns in natural compounds and its importance for the elucidation of biosynthetic pathways". Phytochemistry Reviews. 2 (1–2): 61–85. Bibcode: 2003PChRv...2...61S. doi: 10.1023/B:PHYT.0000004185.92648.ae. S2CID 12943614.
-
^ Martin, Gérard J.; Martin, Maryvonne L.; Remaud, Gérald (1 January 2008). SNIF-NMR—Part 3: From Mechanistic Affiliation to Origin Inference. pp. 1669–1680.
doi:
10.1007/1-4020-3910-7_187.
ISBN
978-1-4020-3894-5.
{{ cite book}}:|journal=ignored ( help) - ^ a b Berdagué, Philippe; Lesot, Philippe; Jacob, Jérémy; Terwilliger, Valery J.; Le Milbeau, Claude (15 January 2016). "Contribution of NAD 2D-NMR in liquid crystals to the determination of hydrogen isotope profile of methyl groups in miliacin" (PDF). Geochimica et Cosmochimica Acta. 173: 337–351. Bibcode: 2016GeCoA.173..337B. doi: 10.1016/j.gca.2015.10.004.
- ^ a b Ehlers, Ina; Augusti, Angela; Betson, Tatiana R.; Nilsson, Mats B.; Marshall, John D.; Schleucher, Jürgen (22 December 2015). "Detecting long-term metabolic shifts using isotopomers: CO2-driven suppression of photorespiration in C3 plants over the 20th century". Proceedings of the National Academy of Sciences. 112 (51): 15585–15590. Bibcode: 2015PNAS..11215585E. doi: 10.1073/pnas.1504493112. PMC 4697390. PMID 26644588.
- ^ Lesot, Philippe; Serhan, Zeinab; Billault, Isabelle (25 November 2010). "Recent advances in the analysis of the site-specific isotopic fractionation of metabolites such as fatty acids using anisotropic natural-abundance 2H NMR spectroscopy: application to conjugated linolenic methyl esters". Analytical and Bioanalytical Chemistry. 399 (3): 1187–1200. doi: 10.1007/s00216-010-4394-0. PMID 21107978. S2CID 8646294.
- ^ Zhang, Ben-Li; Yunianta; Vallet, Claude; Martin, Yves-Loı̈c; Martin, Maryvonne L. (April 1997). "Natural Abundance Isotopic Fractionation in the Fermentation Reaction: Influence of the Fermentation Medium". Bioorganic Chemistry. 25 (2): 117–129. doi: 10.1006/bioo.1997.1060.
- ^ Duan, Jia-Rong; Billault, Isabelle; Mabon, Françoise; Robins, Richard (2 August 2002). "Natural Deuterium Distribution in Fatty Acids Isolated from Peanut Seed Oil: A Site-Specific Study by Quantitative 2H NMR Spectroscopy". ChemBioChem. 3 (8): 752–9. doi: 10.1002/1439-7633(20020802)3:8<752::AID-CBIC752>3.0.CO;2-G. PMID 12203973. S2CID 20650087.
- ^ Keppler, Frank; Hamilton, John T. G.; McRoberts, W. Colin; Vigano, Ivan; Braß, Marc; Röckmann, Thomas (June 2008). "Methoxyl groups of plant pectin as a precursor of atmospheric methane: evidence from deuterium labelling studies". New Phytologist. 178 (4): 808–814. doi: 10.1111/j.1469-8137.2008.02411.x. PMID 18346110.
- ^ Derwish, G. a. W.; Galli, A.; Giardini-Guidoni, A.; Volpi, G. G. (15 November 1964). "Mass-Spectrometric Study of Ion—Molecule Reactions in Propane". The Journal of Chemical Physics. 41 (10): 2998–3005. Bibcode: 1964JChPh..41.2998D. doi: 10.1063/1.1725665.
- ^ "Panorama Nu Instruments Ltd". nu-ins.com. Archived from the original on 2016-06-05. Retrieved 2016-05-14.
- ^ Eiler, John M.; Clog, Matthieu; Magyar, Paul; Piasecki, Alison; Sessions, Alex; Stolper, Daniel; Deerberg, Michael; Schlueter, Hans-Juergen; Schwieters, Johannes (February 2013). "A high-resolution gas-source isotope ratio mass spectrometer". International Journal of Mass Spectrometry. 335: 45–56. Bibcode: 2013IJMSp.335...45E. doi: 10.1016/j.ijms.2012.10.014.
- ^ Stolper, D.A.; Sessions, A.L.; Ferreira, A.A.; Santos Neto, E.V.; Schimmelmann, A.; Shusta, S.S.; Valentine, D.L.; Eiler, J.M. (February 2014). "Combined 13C–D and D–D clumping in methane: Methods and preliminary results". Geochimica et Cosmochimica Acta. 126: 169–191. Bibcode: 2014GeCoA.126..169S. doi: 10.1016/j.gca.2013.10.045.
- ^ a b Ponton, Camilo. "Experiments constraining blocking temperatures of H isotope exchange in propane and ethane".
- ^ a b c d Criss, Robert (1999). Principles of Stable Isotope Distribution. New York: Oxford University Press. ISBN 978-0-19-511775-2.
- ^ Craig, Harmon; Gordon, Louis (1965). "Deuterium and oxygen 18 variations in the ocean and the marine atmosphere". Stable Isotopes in Oceanographic Studies and Paleotemperatures.
- ^ Majoube, M. (1971). "Fractionnement en oxygene 18 et en deuterium entre l'eau et sa vapeur". J. Chim. Phys. 68: 1423–1436. Bibcode: 1971JCP....68.1423M. doi: 10.1051/jcp/1971681423.
- ^
a
b Clark, Ian; Fritz, Peter (1997). Environmental Isotopes in Hydrogeology. Vol. 80. CRC Press LLC. p. 217.
Bibcode:
1999EOSTr..80..217Z.
doi:
10.1029/99EO00169.
ISBN
978-1566702492.
{{ cite book}}:|journal=ignored ( help) - ^ Rayleigh, Lord (1902). "On the distillation of binary mixtures". Philos. Mag. Series 6. 4 (23): 521–537. doi: 10.1080/14786440209462876.
- ^ Craig, Harmon (1961). "Isotopic variations in meteoric waters". Science. 133 (3465): 1702–1703. Bibcode: 1961Sci...133.1702C. doi: 10.1126/science.133.3465.1702. PMID 17814749. S2CID 34373069.
- ^ a b c d e Dansgaard, Willi (1964). "Stable isotopes in precipitation". Tellus. 16 (4): 436–468. Bibcode: 1964Tell...16..436D. doi: 10.1111/j.2153-3490.1964.tb00181.x.
- ^ Araguas-Araguas, Luis; Froehlich, Klaus; Rozanski, Kazimierz (1998). "Stable isotope composition of precipitation over southeast Asia". Journal of Geophysical Research. 103 (D22): 28, 721–28, 742. Bibcode: 1998JGR...10328721A. doi: 10.1029/98jd02582.
- ^ Cobb, Kim M.; Adkins, Jess F.; Partin, Judson W.; Clark, Brian (2007-11-30). "Regional-scale climate influences on temporal variations of rainwater and cave dripwater oxygen isotopes in northern Borneo". Earth and Planetary Science Letters. 263 (3–4): 207–220. Bibcode: 2007E&PSL.263..207C. doi: 10.1016/j.epsl.2007.08.024.
- ^ Partin, Judson W. (2007). "Millennial-scale trends in west Pacific warm pool hydrology since the Last Glacial Maximum". Nature. 449 (7161): 452–456. Bibcode: 2007Natur.449..452P. doi: 10.1038/nature06164. PMID 17898765. S2CID 128764777.
- ^ Wang, Y.J. (2001). "A high-resolution absolutely-dated late Pleistocene monsoon record from Hulu Cave, China". Science. 294 (5550): 2345–2348. Bibcode: 2001Sci...294.2345W. doi: 10.1126/science.1064618. PMID 11743199. S2CID 26237893.
- ^ Tierney, J. E.; Oppo, D. W.; LeGrande, A. N.; Huang, Y.; Rosenthal, Y.; Linsley, B. K. (2012-10-16). "The influence of Indian Ocean atmospheric circulation on Warm Pool hydroclimate during the Holocene epoch". Journal of Geophysical Research: Atmospheres. 117 (D19): D19108. Bibcode: 2012JGRD..11719108T. doi: 10.1029/2012JD018060. hdl: 1912/5587. S2CID 30352947.
- ^ Niedermeyer, Eva M.; Sessions, Alex L.; Feakins, Sarah J.; Mohtadi, Mahyar (2014-07-01). "Hydroclimate of the western Indo-Pacific Warm Pool during the past 24,000 years". Proceedings of the National Academy of Sciences. 111 (26): 9402–9406. Bibcode: 2014PNAS..111.9402N. doi: 10.1073/pnas.1323585111. PMC 4084490. PMID 24979768.
-
^ GONFIANTINI, ROBERTO (1986-01-01). FONTES, J.Ch. (ed.). Chapter 3 - ENVIRONMENTAL ISOTOPES IN LAKE STUDIES A2 - FRITZ, P. Handbook of Environmental Isotope Geochemistry. Amsterdam: Elsevier. pp. 113–168.
doi:
10.1016/b978-0-444-42225-5.50008-5.
ISBN
9780444422255.
{{ cite book}}:|journal=ignored ( help) - ^ a b Criss, R. E.; Davisson, M. L. (1996-04-15). "Isotopic imaging of surface water/groundwater interactions, Sacramento Valley, California". Journal of Hydrology. 178 (1–4): 205–222. Bibcode: 1996JHyd..178..205C. doi: 10.1016/0022-1694(96)83733-4.
- ^ Barnes, C. J.; Allison, G. B. (1983-01-01). "The distribution of deuterium and 18O in dry soils". Journal of Hydrology. 60 (1): 141–156. Bibcode: 1983JHyd...60..141B. doi: 10.1016/0022-1694(83)90018-5.
- ^ Meinzer, Frederick (1999). "Partitioning of soil water among canopy trees in a seasonally dry tropical forest". Oecologia. 121 (3): 293–301. Bibcode: 1999Oecol.121..293M. doi: 10.1007/s004420050931. PMID 28308316. S2CID 20985036.
- ^ a b c d Petit, J. R.; Jouzel, J.; Raynaud, D.; Barkov, N. I.; Barnola, J.-M.; Basile, I.; Bender, M.; Chappellaz, J.; Davis, M. (1999). "Climate and atmospheric history of the past 420,000 years from the Vostok ice core, Antarctica". Nature. 399 (6735): 429–436. Bibcode: 1999Natur.399..429P. doi: 10.1038/20859. S2CID 204993577.
- ^ Epstein, Samuel; Sharp, Robert (1963). "Oxygen-isotope ratios in Antarctic snow, firn and ice". The Journal of Geology. 71 (6): 698–720. Bibcode: 1963JG.....71..698E. doi: 10.1086/626950. S2CID 128786034.
- ^ Lorius, C.; Jouzel, J.; Ritz, C.; Merlivat, L.; Barkov, N. I.; Korotkevich, Y. S.; Kotlyakov, V. M. (1985-08-15). "A 150,000-year climatic record from Antarctic ice". Nature. 316 (6029): 591–596. Bibcode: 1985Natur.316..591L. doi: 10.1038/316591a0. S2CID 4368173.
- ^ Blunier, Thomas; Brook, Edward J. (2001-01-05). "Timing of Millennial-Scale Climate Change in Antarctica and Greenland During the Last Glacial Period". Science. 291 (5501): 109–112. Bibcode: 2001Sci...291..109B. doi: 10.1126/science.291.5501.109. PMID 11141558.
- ^ Dansgaard, Willi (1969). "One thousand centuries of climatic record from Camp Century on the Greenland ice sheet". Science. 166 (3903): 366–370. Bibcode: 1969Sci...166..377D. doi: 10.1126/science.166.3903.377. PMID 17796550. S2CID 9674822.
- ^ Epstein, Samuel; Sharp, R.P.; Gow, A.J. (1970). "Antarctic Ice Sheet: Stable Isotope Analyses of Byrd Station Cores and Interhemispheric Climatic Implications". Science. 168 (3939): 1570–1572. Bibcode: 1970Sci...168.1570E. doi: 10.1126/science.168.3939.1570. PMID 17759337. S2CID 32636862.
- ^ Augustin, Laurent; Barbante, Carlo; Barnes, Piers R. F.; Barnola, Jean Marc; Bigler, Matthias; Castellano, Emiliano; Cattani, Olivier; Chappellaz, Jerome; Dahl-Jensen, Dorthe (2004-06-10). "Eight glacial cycles from an Antarctic ice core". Nature. 429 (6992): 623–628. Bibcode: 2004Natur.429..623A. doi: 10.1038/nature02599. PMID 15190344.
- ^ a b Dansgaard, W. (1993). "Evidence for general instability of past climate from a 250-kyr ice-core record" (PDF). Nature. 364 (6434): 218–220. Bibcode: 1993Natur.364..218D. doi: 10.1038/364218a0. S2CID 4304321.
- ^ Buizert, Christo; Gkinis, Vasileios; Severinghaus, Jeffrey P.; He, Feng; Lecavalier, Benoit S.; Kindler, Philippe; Leuenberger, Markus; Carlson, Anders E.; Vinther, Bo (2014-09-05). "Greenland temperature response to climate forcing during the last deglaciation". Science. 345 (6201): 1177–1180. Bibcode: 2014Sci...345.1177B. doi: 10.1126/science.1254961. PMID 25190795. S2CID 206558186.
- ^ Greenland Ice-core Project (GRIP) Members (1993-07-15). "Climate instability during the last interglacial period recorded in the GRIP ice core" (PDF). Nature. 364 (6434): 203–207. Bibcode: 1993Natur.364..203G. doi: 10.1038/364203a0.
- ^ Heinrich, Hartmut (1988). "Origin and consequences of cyclic ice rafting in the Northeast Atlantic Ocean during the past 130,000 years". Quaternary Research. 29 (2): 142–152. Bibcode: 1988QuRes..29..142H. doi: 10.1016/0033-5894(88)90057-9. S2CID 129842509.
- ^ Broecker, Wallace S. (1994-12-01). "Massive iceberg discharges as triggers for global climate change". Nature. 372 (6505): 421–424. Bibcode: 1994Natur.372..421B. doi: 10.1038/372421a0. S2CID 4303031.
- ^ Thompson, L. G.; Mosley-Thompson, E.; Davis, M. E.; Lin, P.-N.; Henderson, K. A.; Cole-Dai, J.; Bolzan, J. F.; Liu, K.-b (1995-07-07). "Late Glacial Stage and Holocene Tropical Ice Core Records from Huascarán, Peru". Science. 269 (5220): 46–50. Bibcode: 1995Sci...269...46T. doi: 10.1126/science.269.5220.46. PMID 17787701. S2CID 25940751.
- ^ Thompson, L.G. (1997). "Tropical Climate Instability: The Last Glacial Cycle from a Qinghai-Tibetan Ice Core". Science. 276 (5320): 1821–1825. doi: 10.1126/science.276.5320.1821.
- ^ a b c d e f g h i Sachse, Dirk; Billault, Isabelle; Bowen, Gabriel J.; Chikaraishi, Yoshito; Dawson, Todd E.; Feakins, Sarah J.; Freeman, Katherine H.; Magill, Clayton R.; McInerney, Francesca A. (2012-01-01). "Molecular Paleohydrology: Interpreting the Hydrogen-Isotopic Composition of Lipid Biomarkers from Photosynthesizing Organisms" (PDF). Annual Review of Earth and Planetary Sciences. 40 (1): 221–249. Bibcode: 2012AREPS..40..221S. doi: 10.1146/annurev-earth-042711-105535.
- ^ Schimmelmann, Arndt; Sessions, Alex L.; Mastalerz, Maria (2006-01-01). "Hydrogen Isotopic (d/H) Composition of Organic Matter During Diagenesis and Thermal Maturation" (PDF). Annual Review of Earth and Planetary Sciences. 34 (1): 501–533. Bibcode: 2006AREPS..34..501S. doi: 10.1146/annurev.earth.34.031405.125011.
- ^ a b Hou, Juzhi; D'Andrea, William J.; Huang, Yongsong (2008-07-15). "Can sedimentary leaf waxes record D/H ratios of continental precipitation? Field, model, and experimental assessments". Geochimica et Cosmochimica Acta. 72 (14): 3503–3517. Bibcode: 2008GeCoA..72.3503H. doi: 10.1016/j.gca.2008.04.030.
- ^ Sessions, Alex L.; Hayes, John M. (2005-02-01). "Calculation of hydrogen isotopic fractionations in biogeochemical systems". Geochimica et Cosmochimica Acta. 69 (3): 593–597. Bibcode: 2005GeCoA..69..593S. doi: 10.1016/j.gca.2004.08.005.
- ^ Schiegl, W. E. (1974-10-18). "Climatic significance of deuterium abundance in growth rings of Picea". Nature. 251 (5476): 582–584. Bibcode: 1974Natur.251..582S. doi: 10.1038/251582a0. S2CID 4179399.
- ^ a b Yapp, Crayton; Epstein, Samuel (1982). "Climatic significance of the hydrogen isotope ratios in tree cellulose". Nature. 297 (5868): 236–239. Bibcode: 1982Natur.297..636Y. doi: 10.1038/297636a0. S2CID 42877790.
- ^ a b Roden, John; Lin, Guanghui; Ehleringer, James (2000). "A mechanistic model for interpretation of hydrogen and oxygen isotope ratios in tree-ring cellulose". Geochimica et Cosmochimica Acta. 64 (1): 21–35. Bibcode: 2000GeCoA..64...21R. doi: 10.1016/s0016-7037(99)00195-7.
- ^ Feng, Xiaohong; Epstein, Samuel (1994). "Climate implications of an 8000-year hydrogen isotope time series from bristlecone pine trees". Science. 265 (5175): 1079–1081. Bibcode: 1994Sci...265.1079F. doi: 10.1126/science.265.5175.1079. PMID 17832901. S2CID 15976057.
- ^ Eglinton, Timothy I.; Eglinton, Geoffrey (2008-10-30). "Molecular proxies for paleoclimatology". Earth and Planetary Science Letters. 275 (1–2): 1–16. Bibcode: 2008E&PSL.275....1E. doi: 10.1016/j.epsl.2008.07.012.
- ^ Ellsworth, Patrick Z.; Williams, David G. (2007-01-17). "Hydrogen isotope fractionation during water uptake by woody xerophytes". Plant and Soil. 291 (1–2): 93–107. doi: 10.1007/s11104-006-9177-1. S2CID 27533990.
- ^ Farquhar, Graham D.; Cernusak, Lucas A.; Barnes, Belinda (2007-01-01). "Heavy water fractionation during transpiration". Plant Physiology. 143 (1): 11–18. doi: 10.1104/pp.106.093278. PMC 1761995. PMID 17210909.
- ^ a b c d Sachse, Dirk; Radke, Jens; Gleixner, Gerd (2006-04-01). "δD values of individual n-alkanes from terrestrial plants along a climatic gradient – Implications for the sedimentary biomarker record". Organic Geochemistry. 37 (4): 469–483. doi: 10.1016/j.orggeochem.2005.12.003.
- ^ Sauer, Peter E.; Eglinton, Timothy I.; Hayes, John M.; Schimmelmann, Arndt; Sessions, Alex L. (2001-01-15). "Compound-specific D/H ratios of lipid biomarkers from sediments as a proxy for environmental and climatic conditions1". Geochimica et Cosmochimica Acta. 65 (2): 213–222. Bibcode: 2001GeCoA..65..213S. doi: 10.1016/S0016-7037(00)00520-2.
- ^ a b c d Zhang, Xinning; Gillespie, Aimee L.; Sessions, Alex L. (2009-08-04). "Large D/H variations in bacterial lipids reflect central metabolic pathways". Proceedings of the National Academy of Sciences. 106 (31): 12580–12586. Bibcode: 2009PNAS..10612580Z. doi: 10.1073/pnas.0903030106. PMC 2722351. PMID 19617564.
- ^ Chikaraishi, Yoshito; Naraoka, Hiroshi; Poulson, Simon R. (2004-05-01). "Hydrogen and carbon isotopic fractionations of lipid biosynthesis among terrestrial (C3, C4 and CAM) and aquatic plants". Phytochemistry. 65 (10): 1369–1381. doi: 10.1016/j.phytochem.2004.03.036. PMID 15231410.
- ^ Chikaraishi, Yoshito; Naraoka, Hiroshi (2003-06-01). "Compound-specific δD – δ13C analyses of n-alkanes extracted from terrestrial and aquatic plants". Phytochemistry. 63 (3): 361–371. doi: 10.1016/S0031-9422(02)00749-5. PMID 12737985.
- ^ Behrouzian, B.; Buist, P.H. (2003-02-01). "Mechanism of fatty acid desaturation: a bioorganic perspective". Prostaglandins, Leukotrienes and Essential Fatty Acids. 68 (2): 107–112. doi: 10.1016/s0952-3278(02)00260-0. PMID 12538074.
- ^ a b Feakins, Sarah J.; Sessions, Alex L. (2010-12-01). "Crassulacean acid metabolism influences D/H ratio of leaf wax in succulent plants". Organic Geochemistry. 41 (12): 1269–1276. doi: 10.1016/j.orggeochem.2010.09.007.
- ^ Chikaraishi, Yoshito; Naraoka, Hiroshi (2007-02-01). "δ13C and δD relationships among three n-alkyl compound classes (n-alkanoic acid, n-alkane and n-alkanol) of terrestrial higher plants". Organic Geochemistry. 38 (2): 198–215. doi: 10.1016/j.orggeochem.2006.10.003.
- ^ Hou, Juzhi; D'Andrea, William J.; MacDonald, Dana; Huang, Yongsong (2007-06-01). "Hydrogen isotopic variability in leaf waxes among terrestrial and aquatic plants around Blood Pond, Massachusetts (USA)". Organic Geochemistry. 38 (6): 977–984. Bibcode: 2007OrGeo..38..977H. doi: 10.1016/j.orggeochem.2006.12.009.
- ^ Pedentchouk, Nikolai; Sumner, William; Tipple, Brett; Pagani, Mark (2008-08-01). "δ13C and δD compositions of n-alkanes from modern angiosperms and conifers: An experimental set up in central Washington State, USA". Organic Geochemistry. Advances in Organic Geochemistry 2007Proceedings of the 23rd International Meeting on Organic Geochemistry. 39 (8): 1066–1071. doi: 10.1016/j.orggeochem.2008.02.005.
- ^ Kahmen, Ansgar; Dawson, Todd E.; Vieth, Andrea; Sachse, Dirk (2011-10-01). "Leaf wax n-alkane δD values are determined early in the ontogeny of Populus trichocarpa leaves when grown under controlled environmental conditions". Plant, Cell & Environment. 34 (10): 1639–1651. doi: 10.1111/j.1365-3040.2011.02360.x. PMID 21696403.
- ^ Sachse, Dirk; Kahmen, Ansgar; Gleixner, Gerd (2009-06-01). "Significant seasonal variation in the hydrogen isotopic composition of leaf-wax lipids for two deciduous tree ecosystems (Fagus sylvativa and Acerpseudoplatanus)". Organic Geochemistry. 40 (6): 732–742. Bibcode: 2009OrGeo..40..732S. doi: 10.1016/j.orggeochem.2009.02.008.
- ^ Yang, Hong; Pagani, Mark; Briggs, Derek E. G.; Equiza, M. A.; Jagels, Richard; Leng, Qin; LePage, Ben A. (2009-04-08). "Carbon and hydrogen isotope fractionation under continuous light: implications for paleoenvironmental interpretations of the High Arctic during Paleogene warming". Oecologia. 160 (3): 461–470. Bibcode: 2009Oecol.160..461Y. doi: 10.1007/s00442-009-1321-1. PMID 19352720. S2CID 11540486.
- ^ Schefuß, Enno; Schouten, Stefan; Schneider, Ralph R. (2005). "Climatic controls on central African hydrology during the past 20,000 years". Nature. 437 (7061): 1003–1006. Bibcode: 2005Natur.437.1003S. doi: 10.1038/nature03945. PMID 16222296. S2CID 4397896.
- ^ Tierney, Jessica E.; Russell, James M.; Huang, Yongsong; Damsté, Jaap S. Sinninghe; Hopmans, Ellen C.; Cohen, Andrew S. (2008-10-10). "Northern Hemisphere Controls on Tropical Southeast African Climate During the Past 60,000 Years". Science. 322 (5899): 252–255. Bibcode: 2008Sci...322..252T. doi: 10.1126/science.1160485. PMID 18787132. S2CID 7364713.
- ^ Polissar, Pratigya J.; Freeman, Katherine H.; Rowley, David B.; McInerney, Francesca A.; Currie, Brian S. (2009-09-30). "Paleoaltimetry of the Tibetan Plateau from D/H ratios of lipid biomarkers". Earth and Planetary Science Letters. 287 (1–2): 64–76. Bibcode: 2009E&PSL.287...64P. doi: 10.1016/j.epsl.2009.07.037.
- ^ a b Hren, M. T.; Pagani, M.; Erwin, D. M.; Brandon, M. (2010). "Biomarker reconstruction of the early Eocene paleotopography and paleoclimate of the northern Sierra Nevada". Geology. 38 (1): 7–10. Bibcode: 2010Geo....38....7H. doi: 10.1130/g30215.1.
- ^ a b Kasper, Sebastian; van der Meer, Marcel T. J.; Castañeda, Isla S.; Tjallingii, Rik; Brummer, Geert-Jan A.; Sinninghe Damsté, Jaap S.; Schouten, Stefan (2015-01-01). "Testing the alkenone D/H ratio as a paleo indicator of sea surface salinity in a coastal ocean margin (Mozambique Channel)" (PDF). Organic Geochemistry. 78: 62–68. Bibcode: 2015OrGeo..78...62K. doi: 10.1016/j.orggeochem.2014.10.011.
- ^ a b c Schouten, S.; Ossebaar, J.; Schreiber, K.; Kienhuis, M. V. M.; Langer, G.; Benthien, A.; Bijma, J. (2006-03-15). "The effect of temperature, salinity and growth rate on the stable hydrogen isotopic composition of long chain alkenones produced by Emiliania huxleyi and Gephyrocapsa oceanica" (PDF). Biogeosciences. 3 (1): 113–119. Bibcode: 2006BGeo....3..113S. doi: 10.5194/bg-3-113-2006.
- ^ Sachse, Dirk; Sachs, Julian P. (2008-02-01). "Inverse relationship between D/H fractionation in cyanobacterial lipids and salinity in Christmas Island saline ponds". Geochimica et Cosmochimica Acta. 72 (3): 793–806. Bibcode: 2008GeCoA..72..793S. doi: 10.1016/j.gca.2007.11.022.
- ^ Sachs, Julian P.; Schwab, Valérie F. (2011-01-15). "Hydrogen isotopes in dinosterol from the Chesapeake Bay estuary". Geochimica et Cosmochimica Acta. 75 (2): 444–459. Bibcode: 2011GeCoA..75..444S. doi: 10.1016/j.gca.2010.10.013.
- ^ a b van der Meer, Marcel T. J.; Baas, Marianne; Rijpstra, W. Irene C.; Marino, Gianluca; Rohling, Eelco J.; Sinninghe Damsté, Jaap S.; Schouten, Stefan (2007-10-30). "Hydrogen isotopic compositions of long-chain alkenones record freshwater flooding of the Eastern Mediterranean at the onset of sapropel deposition". Earth and Planetary Science Letters. 262 (3–4): 594–600. Bibcode: 2007E&PSL.262..594V. doi: 10.1016/j.epsl.2007.08.014.
- ^ a b van der Meer, Marcel T.J.; Sangiorgi, Francesca; Baas, Marianne; Brinkhuis, Henk; Sinninghe Damsté, Jaap S.; Schouten, Stefan (2008-03-30). "Molecular isotopic and dinoflagellate evidence for Late Holocene freshening of the Black Sea". Earth and Planetary Science Letters. 267 (3–4): 426–434. Bibcode: 2008E&PSL.267..426V. doi: 10.1016/j.epsl.2007.12.001.
- ^ a b Coolen, Marco J. L.; Orsi, William D.; Balkema, Cherel; Quince, Christopher; Harris, Keith; Sylva, Sean P.; Filipova-Marinova, Mariana; Giosan, Liviu (2013-05-21). "Evolution of the plankton paleome in the Black Sea from the Deglacial to Anthropocene". Proceedings of the National Academy of Sciences of the United States of America. 110 (21): 8609–8614. Bibcode: 2013PNAS..110.8609C. doi: 10.1073/pnas.1219283110. PMC 3666672. PMID 23650351.
- ^ Pahnke, Katharina; Sachs, Julian P.; Keigwin, Lloyd; Timmermann, Axel; Xie, Shang-Ping (2007-12-01). "Eastern tropical Pacific hydrologic changes during the past 27,000 years from D/H ratios in alkenones". Paleoceanography. 22 (4): PA4214. Bibcode: 2007PalOc..22.4214P. doi: 10.1029/2007PA001468. hdl: 1912/3454.
- ^ a b c Mulch, Andreas; Chamberlain, C. Page (2007-10-01). "Stable Isotope Paleoaltimetry in Orogenic Belts – The Silicate Record in Surface and Crustal Geological Archives". Reviews in Mineralogy and Geochemistry. 66 (1): 89–118. Bibcode: 2007RvMG...66...89M. doi: 10.2138/rmg.2007.66.4.
- ^ Gonfiantini, Roberto (2001). "The altitude effect on the isotopic composition of tropical rains". Chemical Geology. 181 (1–4): 147–167. Bibcode: 2001ChGeo.181..147G. doi: 10.1016/s0009-2541(01)00279-0.
- ^ Rowley, David (2001). "A new approach to stable isotope-based paleoaltimetry: implications for paleoaltimetry and paleohypsometry of the high Himalaya since the late Miocene". Earth and Planetary Science Letters. 188 (1–2): 253–268. Bibcode: 2001E&PSL.188..253R. doi: 10.1016/s0012-821x(01)00324-7.
- ^ a b Jia, Guodong (2008). "Soil n-alkane δD vs. altitude gradients along Mount Gongga, China". Geochimica et Cosmochimica Acta. 72 (21): 5165–5174. Bibcode: 2008GeCoA..72.5165J. doi: 10.1016/j.gca.2008.08.004.
- ^ O'Neil, James R.; Silberman, Miles L. (1974). "Stable isotope relations in epithermal Au-Ag deposits". Economic Geology. 69 (6): 902–909. Bibcode: 1974EcGeo..69..902O. doi: 10.2113/gsecongeo.69.6.902.
- ^ O'Neil, James; Kharaka, Yousif (1976). "Hydrogen and oxygen isotope exchange reactions between clay minerals and water". Geochimica et Cosmochimica Acta. 40 (2): 241–246. Bibcode: 1976GeCoA..40..241O. doi: 10.1016/0016-7037(76)90181-2.
- ^ Poage, M. A.; Chamberlain, C. P. (2002-08-01). "Stable isotopic evidence for a Pre-Middle Miocene rain shadow in the western Basin and Range: Implications for the paleotopography of the Sierra Nevada". Tectonics. 21 (4): 16–1. Bibcode: 2002Tecto..21.1034P. doi: 10.1029/2001TC001303.
- ^ Mulch, Andreas; Teyssier, Christian; Cosca, Michael A.; Vanderhaeghe, Olivier; Vennemann, Torsten W. (2004). "Reconstructing paleoelevation in eroded orogens". Geology. 32 (6): 525. Bibcode: 2004Geo....32..525M. doi: 10.1130/g20394.1.
- ^ Feakins, Sarah J.; Bentley, Lisa Patrick; Salinas, Norma; Shenkin, Alexander; Blonder, Benjamin; Goldsmith, Gregory R.; Ponton, Camilo; Arvin, Lindsay J.; Wu, Mong Sin (2016-06-01). "Plant leaf wax biomarkers capture gradients in hydrogen isotopes of precipitation from the Andes and Amazon". Geochimica et Cosmochimica Acta. 182: 155–172. Bibcode: 2016GeCoA.182..155F. doi: 10.1016/j.gca.2016.03.018.
- ^ Wang, Ying (2009). "Equilibrium 2H/1H fractionations in organic molecules. II: Linear alkanes, alkenes, ketones, carboxylic acids, esters, alcohols and ethers". GCA. 73 (23): 7076–7086. Bibcode: 2009GeCoA..73.7076W. doi: 10.1016/j.gca.2009.08.018.
- ^ Wang, Ying (2013). "Equilibrium 2H/1H fractionation in organic molecules: III. Cyclic ketones and hydrocarbons". GCA. 107: 82–95. Bibcode: 2013GeCoA.107...82W. doi: 10.1016/j.gca.2013.01.001.
- ^ Sessions, Alex (1999). "Fractionation of hydrogen isotopes in lipid biosynthesis". Organic Geochemistry. 30 (9): 1193–1200. Bibcode: 1999OrGeo..30.1193S. doi: 10.1016/S0146-6380(99)00094-7.
- ^ a b Pedentchouk, Nikolai (2006). "Different response of δD values of n-alkanes, isoprenoids, and kerogen during thermal maturation". GCA. 70 (8): 2063–2072. Bibcode: 2006GeCoA..70.2063P. doi: 10.1016/j.gca.2006.01.013.
- ^ Dawson, Daniel; Grice, Kliti; Alexander, Robert; Edwards, Dianne (July 2007). "The effect of source and maturity on the stable isotopic compositions of individual hydrocarbons in sediments and crude oils from the Vulcan Sub-basin, Timor Sea, Northern Australia". Organic Geochemistry. 38 (7): 1015–1038. Bibcode: 2007OrGeo..38.1015D. doi: 10.1016/j.orggeochem.2007.02.018.
- ^ a b Tang, Yongchun; Huang, Yongsong; Ellis, Geoffrey S.; Wang, Yi; Kralert, Paul G.; Gillaizeau, Bruno; Ma, Qisheng; Hwang, Rong (September 2005). "A kinetic model for thermally induced hydrogen and carbon isotope fractionation of individual n-alkanes in crude oil". Geochimica et Cosmochimica Acta. 69 (18): 4505–4520. Bibcode: 2005GeCoA..69.4505T. doi: 10.1016/j.gca.2004.12.026.
- ^ a b c Schimmelmann, Arndt (2004). "D/H ratios in terrestrially sourced petroleum systems". Organic Geochemistry. 35 (10): 1169–1195. Bibcode: 2004OrGeo..35.1169S. doi: 10.1016/j.orggeochem.2004.05.006.
- ^ Redding, C.E. (1980). "Hydrogen and carbon isotopic composition of coals and kerogens". Physics and Chemistry of the Earth. 12: 711–723. Bibcode: 1980PCE....12..711R. doi: 10.1016/0079-1946(79)90152-6.
- ^ Rigby, D.; Batts, B.D.; Smith, J.W. (January 1981). "The effect of maturation on the isotopic composition of fossil fuels". Organic Geochemistry. 3 (1–2): 29–36. Bibcode: 1981OrGeo...3...29R. doi: 10.1016/0146-6380(81)90010-3.
- ^ Smith, J.W. (1983). "D/H ratio of coals and palaeolatitude of their deposition". Nature. 302 (5906): 322–323. Bibcode: 1983Natur.302..322S. doi: 10.1038/302322a0. S2CID 4317372.
- ^ Lis, Grzegorz (2006). "D/H ratios and hydrogen exchangeability of type-II kerogens with increasing thermal maturity". Organic Geochemistry. 37 (3): 342–353. Bibcode: 2006OrGeo..37..342L. doi: 10.1016/j.orggeochem.2005.10.006.
- ^ a b c Liu, Quanyou (2008). "Hydrogen isotope composition of natural gases from the Tarim Basin and its indication of depositional environments of the source rocks". Science in China Series D: Earth Sciences. 51 (2): 300–311. Bibcode: 2008ScChD..51..300L. doi: 10.1007/s11430-008-0006-7. S2CID 140549821.
- ^ Prinzhofer, Alain (1995). "Genetic and post-genetic molecular and isotopic fractionations in natural gases". Chemical Geology. 126 (3–4): 281–290. Bibcode: 1995ChGeo.126..281P. doi: 10.1016/0009-2541(95)00123-9.
- ^ Burruss, R.C. (2010). "Carbon and hydrogen isotopic reversals in deep basin gas: Evidence for limits to the stability of hydrocarbons". Organic Geochemistry. 41 (12): 1285–1296. doi: 10.1016/j.orggeochem.2010.09.008.
- ^ Telling, Jon (2013). "Carbon and Hydrogen Isotopic Composition of Methane and C2 + Alkanes in Electrical Spark Discharge: Implications for Identifying Sources of Hydrocarbons in Terrestrial and Extraterrestrial Settings". Astrobiology. 13 (5): 483–490. Bibcode: 2013AsBio..13..483T. doi: 10.1089/ast.2012.0915. PMID 23683048.
- ^ Flanagan, Lawrence B.; Ehleringer, James R.; Pataki, Diane E. (2004-12-15). Stable Isotopes and Biosphere – Atmosphere Interactions: Processes and Biological Controls. Academic Press. ISBN 9780080525280.
- ^ Bilek, R. S.; Tyler, S. C.; Kurihara, M.; Yagi, K. (July 2001). "Investigation of cattle methane production and emission over a 24-hour period using measurements of δ13C and δD of emitted CH4 and rumen water". Journal of Geophysical Research. 106 (D14): 2156–2202. Bibcode: 2001JGR...10615405B. doi: 10.1029/2001JD900177.
- ^ Eiler, John (2007). ""Clumped-isotope" geochemistry—The study of naturally-occurring, multiply-substituted isotopologues". Earth and Planetary Science Letters. 262 (3–4): 309–327. Bibcode: 2007E&PSL.262..309E. doi: 10.1016/j.epsl.2007.08.020.
- ^ Stolper, Daniel (2014). "Formation temperatures of thermogenic and biogenic methane" (PDF). Science. 344 (6191): 1500–1503. Bibcode: 2014Sci...344.1500S. doi: 10.1126/science.1254509. PMID 24970083. S2CID 31569235.
- ^ a b Wang, David (2015). "Nonequilibrium clumped isotope signals in microbial methane". Science. 348 (6233): 428–431. Bibcode: 2015Sci...348..428W. doi: 10.1126/science.aaa4326. hdl: 1721.1/95903. PMID 25745067. S2CID 206634401.
- ^ Clog, M.D. (2014). "Ethane C-C clumping in natural gas : a proxy for cracking processes?". AGU Fall Meeting Abstracts. 2014: 54A–06. Bibcode: 2014AGUFMPP54A..06C.
- ^ Tang, Y.; Perry, J. K.; Jenden, P. D.; Schoell, M. (1 August 2000). "Mathematical modeling of stable carbon isotope ratios in natural gases†". Geochimica et Cosmochimica Acta. 64 (15): 2673–2687. Bibcode: 2000GeCoA..64.2673T. doi: 10.1016/S0016-7037(00)00377-X.
- ^ Waseda, Amane (1993). "Effect of maturity on carbon and hydrogen isotopes of crude oils in Northeast Japan". Journal of the Japanese Association for Petroleum Technology. 58 (3): 199–208. doi: 10.3720/japt.58.199.
- ^ a b Li, Maowen; Huang, Yongsong; Obermajer, Mark; Jiang, Chunqing; Snowdon, Lloyd R; Fowler, Martin G (December 2001). "Hydrogen isotopic compositions of individual alkanes as a new approach to petroleum correlation: case studies from the Western Canada Sedimentary Basin". Organic Geochemistry. 32 (12): 1387–1399. Bibcode: 2001OrGeo..32.1387L. doi: 10.1016/S0146-6380(01)00116-4.
- ^ Xiong, Yongqiang (2007). "Compound-specific C- and H-isotope compositions of enclosed organic matter in carbonate rocks: Implications for source identification of sedimentary organic matter and paleoenvironmental reconstruction". Applied Geochemistry. 22 (11): 2553–2565. Bibcode: 2007ApGC...22.2553X. doi: 10.1016/j.apgeochem.2007.07.009.
- ^ Dawson, Daniel; Grice, Kliti; Wang, Sue X; Alexander, Robert; Radke, Jens (February 2004). "Stable hydrogen isotopic composition of hydrocarbons in torbanites (Late Carboniferous to Late Permian) deposited under various climatic conditions". Organic Geochemistry. 35 (2): 189–197. Bibcode: 2004OrGeo..35..189D. doi: 10.1016/j.orggeochem.2003.09.004.
- ^ Goldsmith, Gregory R.; Muñoz-Villers, Lyssette E.; Holwerda, Friso; McDonnell, Jeffrey J.; Asbjornsen, Heidi; Dawson, Todd E. (2012-11-01). "Stable isotopes reveal linkages among ecohydrological processes in a seasonally dry tropical montane cloud forest". Ecohydrology. 5 (6): 779–790. doi: 10.1002/eco.268. S2CID 58905575.
- ^ Koeniger, Paul; Leibundgut, Christian; Link, Timothy; Marshall, John D. (2010-01-01). "Stable isotopes applied as water tracers in column and field studies". Organic Geochemistry. Stable Isotopes in Biogeosciences (III). 41 (1): 31–40. Bibcode: 2010OrGeo..41...31K. doi: 10.1016/j.orggeochem.2009.07.006.
- ^ a b Dawson, Todd E.; Ehleringer, James R. (1991-03-28). "Streamside trees that do not use stream water". Nature. 350 (6316): 335–337. Bibcode: 1991Natur.350..335D. doi: 10.1038/350335a0. S2CID 4367205.
- ^ Limm, Emily Burns; Simonin, Kevin A.; Bothman, Aron G.; Dawson, Todd E. (2009-09-01). "Foliar water uptake: a common water acquisition strategy for plants of the redwood forest". Oecologia. 161 (3): 449–459. Bibcode: 2009Oecol.161..449L. doi: 10.1007/s00442-009-1400-3. PMC 2727584. PMID 19585154.
- ^ Farquhar, Graham D.; Cernusak, Lucas A.; Barnes, Belinda (2007-01-01). "Heavy Water Fractionation during Transpiration". Plant Physiology. 143 (1): 11–18. doi: 10.1104/pp.106.093278. PMC 1761995. PMID 17210909.
- ^ a b Hou, Juzhi; D'Andrea, William J.; MacDonald, Dana; Huang, Yongsong (2007-08-01). "Evidence for water use efficiency as an important factor in determining the δD values of tree leaf waxes". Organic Geochemistry. 38 (8): 1251–1255. doi: 10.1016/j.orggeochem.2007.03.011.
- ^ Craig, Harmon; Gordon, Louis Irwin (1965-01-01). Deuterium and Oxygen 18 Variations in the Ocean and the Marine Atmosphere. Consiglio nazionale delle richerche, Laboratorio de geologia nucleare.
- ^ Roden, John S.; Ehleringer, James R. (1999-08-01). "Observations of Hydrogen and Oxygen Isotopes in Leaf Water Confirm the Craig-Gordon Model under Wide-Ranging Environmental Conditions". Plant Physiology. 120 (4): 1165–1174. doi: 10.1104/pp.120.4.1165. PMC 59350. PMID 10444100.
- ^ Calder, Ian R. (1992-01-01). "Deuterium tracing for the estimation of transpiration from trees Part 2. Estimation of transpiration rates and transpiration parameters using a time-averaged deuterium tracing method". Journal of Hydrology. 130 (1): 27–35. Bibcode: 1992JHyd..130...27C. doi: 10.1016/0022-1694(92)90101-Z.
- ^ a b c Schwendenmann, Luitgard; Dierick, Diego; Köhler, Michael; Hölscher, Dirk (2010-07-01). "Can deuterium tracing be used for reliably estimating water use of tropical trees and bamboo?". Tree Physiology. 30 (7): 886–900. doi: 10.1093/treephys/tpq045. PMID 20516485.
- ^ Hobson, Keith A. (1999-08-01). "Tracing origins and migration of wildlife using stable isotopes: a review". Oecologia. 120 (3): 314–326. Bibcode: 1999Oecol.120..314H. doi: 10.1007/s004420050865. PMID 28308009. S2CID 10231727.
- ^ Flockhart, D. T. Tyler; Wassenaar, Leonard I.; Martin, Tara G.; Hobson, Keith A.; Wunder, Michael B.; Norris, D. Ryan (2013-10-07). "Tracking multi-generational colonization of the breeding grounds by monarch butterflies in eastern North America". Proceedings of the Royal Society of London B: Biological Sciences. 280 (1768): 20131087. doi: 10.1098/rspb.2013.1087. PMC 3757963. PMID 23926146.
- ^ Pylant, Cortney L.; Nelson, David M.; Keller, Stephen R. (2014-10-16). "Stable hydrogen isotopes record the summering grounds of eastern red bats (Lasiurus borealis)". PeerJ. 2: e629. doi: 10.7717/peerj.629. PMC 4203026. PMID 25337458.
- ^ a b Hardesty, Jessica L.; Fraser, Kevin C. (2010-03-01). "Using deuterium to examine altitudinal migration by Andean birds". Journal of Field Ornithology. 81 (1): 83–91. doi: 10.1111/j.1557-9263.2009.00264.x.
- ^ Fritz, P. (2013-10-22). The Terrestrial Environment, B. Elsevier. ISBN 9781483289830.
- ^ Cryan, Paul M.; Bogan, Michael A.; Rye, Robert O.; Landis, Gary P.; Kester, Cynthia L. (2004-10-20). "Stable Hydrogen Isotope Analysis of Bat Hair as Evidence for Seasonal Molt and Long-Distance Migration". Journal of Mammalogy. 85 (5): 995–1001. doi: 10.1644/BRG-202.
- ^ a b Soto, David X.; Wassenaar, Leonard I.; Hobson, Keith A. (2013-04-01). "Stable hydrogen and oxygen isotopes in aquatic food webs are tracers of diet and provenance". Functional Ecology. 27 (2): 535–543. doi: 10.1111/1365-2435.12054.
- ^ Hobson, Keith A.; Atwell, Lisa; Wassenaar, Leonard I. (1999-07-06). "Influence of drinking water and diet on the stable-hydrogen isotope ratios of animal tissues". Proceedings of the National Academy of Sciences of the United States of America. 96 (14): 8003–8006. Bibcode: 1999PNAS...96.8003H. doi: 10.1073/pnas.96.14.8003. PMC 22177. PMID 10393937.
- ^ Peters, Jacob M.; Wolf, Nathan; Stricker, Craig A.; Collier, Timothy R.; Rio, Carlos Martínez del (2012-03-28). "Effects of Trophic Level and Metamorphosis on Discrimination of Hydrogen Isotopes in a Plant-Herbivore System". PLOS ONE. 7 (3): e32744. Bibcode: 2012PLoSO...732744P. doi: 10.1371/journal.pone.0032744. PMC 3314649. PMID 22470423.
- ^ Birchall, Jennifer; O'Connell, Tamsin C.; Heaton, Tim H. E.; Hedges, Robert E. M. (2005-09-01). "Hydrogen isotope ratios in animal body protein reflect trophic level". Journal of Animal Ecology. 74 (5): 877–881. doi: 10.1111/j.1365-2656.2005.00979.x.
- ^ Solomon, Christopher T.; Cole, Jonathan J.; Doucett, Richard R.; Pace, Michael L.; Preston, Nicholas D.; Smith, Laura E.; Weidel, Brian C. (2009-08-01). "The influence of environmental water on the hydrogen stable isotope ratio in aquatic consumers". Oecologia. 161 (2): 313–324. Bibcode: 2009Oecol.161..313S. doi: 10.1007/s00442-009-1370-5. PMID 19471971. S2CID 12098584.
- ^ Dirghangi, Sitindra S.; Pagani, Mark (2013-10-15). "Hydrogen isotope fractionation during lipid biosynthesis by Haloarcula marismortui". Geochimica et Cosmochimica Acta. 119: 381–390. Bibcode: 2013GeCoA.119..381D. doi: 10.1016/j.gca.2013.05.023.
- ^ a b Fischer, Curt R.; Bowen, Benjamin P.; Pan, Chongle; Northen, Trent R.; Banfield, Jillian F. (2013-08-16). "Stable-Isotope Probing Reveals That Hydrogen Isotope Fractionation in Proteins and Lipids in a Microbial Community Are Different and Species-Specific". ACS Chemical Biology. 8 (8): 1755–1763. doi: 10.1021/cb400210q. PMID 23713674.
- ^ Osburn, Magdalena R.; Sessions, Alex L.; Pepe-Ranney, Charles; Spear, John R. (2011-09-01). "Hydrogen-isotopic variability in fatty acids from Yellowstone National Park hot spring microbial communities". Geochimica et Cosmochimica Acta. 75 (17): 4830–4845. Bibcode: 2011GeCoA..75.4830O. doi: 10.1016/j.gca.2011.05.038.
- ^ Zhang, Zhaohui; Sachs, Julian P.; Marchetti, Adrian (2009-03-01). "Hydrogen isotope fractionation in freshwater and marine algae: II. Temperature and nitrogen limited growth rate effects". Organic Geochemistry. 40 (3): 428–439. Bibcode: 2009OrGeo..40..428Z. doi: 10.1016/j.orggeochem.2008.11.002.
- ^ Wang, Zhendi; Fingas, Merv F. (2003). "Development of oil hydrocarbon fingerprinting and identification techniques". Marine Pollution Bulletin. 47 (9–12): 423–452. Bibcode: 2003MarPB..47..423W. doi: 10.1016/S0025-326X(03)00215-7. PMID 12899888.
- ^ Kvenvolden, Keith A.; Hostettler, Frances D.; Rapp, John B.; Carlson, Paul R. (1993). "Hydrocarbons in oil residues on beaches of islands of Prince William Sound, Alaska". Marine Pollution Bulletin. 26 (1): 24–29. Bibcode: 1993MarPB..26...24K. doi: 10.1016/0025-326X(93)90593-9.
- ^ Kaplan, Isaac R.; Galperin, Yakov; Lu, Shan-Tan; Lee, Ru-Po (1997). "Forensic Environmental Geochemistry: differentiation of fuel-types, their sources and release time". Organic Geochemistry. 27 (5–6): 289–317. Bibcode: 1997OrGeo..27..289K. doi: 10.1016/S0146-6380(97)87941-7.
- ^ Reddy, C. M.; Arey, J. S.; Seewald, J. S.; Sylva, S. P.; Lemkau, K. L.; Nelson, R. K.; Carmichael, C. A.; McIntyre, C. P.; Fenwick, J.; Ventura, G. T.; Van Mooy, B. A. S.; Camilli, R. (2011). "Composition and fate of gas and oil released to the water column during the Deepwater Horizon oil spill". Proceedings of the National Academy of Sciences. 109 (50): 20229–20234. Bibcode: 2012PNAS..10920229R. doi: 10.1073/pnas.1101242108. PMC 3528605. PMID 21768331.
- ^ Sun, Yongge; Chen, Zhenyan; Xu, Shiping; Cai, Pingxia (2005). "Stable carbon and hydrogen isotopic fractionation of individual n-alkanes accompanying biodegradation: evidence from a group of progressively biodegraded oils". Organic Geochemistry. 36 (2): 225–238. Bibcode: 2005OrGeo..36..225S. doi: 10.1016/j.orggeochem.2004.09.002.
- ^ Pond, Kristy L.; Huang, Yongsong; Wang, Yi; Kulpa, Charles F. (2002). "Hydrogen Isotopic Composition of Individualn-Alkanes as an Intrinsic Tracer for Bioremediation and Source Identification of Petroleum Contamination". Environmental Science & Technology. 36 (4): 724–728. Bibcode: 2002EnST...36..724P. doi: 10.1021/es011140r. PMID 11878389.
- ^ Gray, Jennifer R.; Lacrampe-Couloume, Georges; Gandhi, Deepa; Scow, Kate M.; Wilson, Ryan D.; Mackay, Douglas M.; Sherwood Lollar, Barbara (2002). "Carbon and Hydrogen Isotopic Fractionation during Biodegradation of Methyltert-Butyl Ether". Environmental Science & Technology. 36 (9): 1931–1938. Bibcode: 2002EnST...36.1931G. doi: 10.1021/es011135n. PMID 12026973.
- ^ Morasch, B.; Richnow, H. H.; Schink, B.; Meckenstock, R. U. (2001). "Stable Hydrogen and Carbon Isotope Fractionation during Microbial Toluene Degradation: Mechanistic and Environmental Aspects". Applied and Environmental Microbiology. 67 (10): 4842–4849. Bibcode: 2001ApEnM..67.4842M. doi: 10.1128/AEM.67.10.4842-4849.2001. PMC 93239. PMID 11571192.
- ^ Ward, Julie A. M.; Ahad, Jason M. E.; Lacrampe-Couloume, Georges; Slater, Greg F.; Edwards, Elizabeth A.; Lollar, Barbara Sherwood (2000). "Hydrogen Isotope Fractionation during Methanogenic Degradation of Toluene: Potential for Direct Verification of Bioremediation". Environmental Science & Technology. 34 (21): 4577–4581. Bibcode: 2000EnST...34.4577W. doi: 10.1021/es001128j.
- ^ Mancini, Silvia A.; Lacrampe-Couloume, Georges; Jonker, Hendrikus; van Breukelen, Boris M.; Groen, Jacobus; Volkering, Frank; Sherwood Lollar, Barbara (2002-06-01). "Hydrogen Isotopic Enrichment: An Indicator of Biodegradation at a Petroleum Hydrocarbon Contaminated Field Site". Environmental Science & Technology. 36 (11): 2464–2470. Bibcode: 2002EnST...36.2464M. doi: 10.1021/es011253a. PMID 12075805.
- ^ Steinbach, Alfred; Seifert, Richard; Annweiler, Eva; Michaelis, Walter (2004-01-01). "Hydrogen and Carbon Isotope Fractionation during Anaerobic Biodegradation of Aromatic HydrocarbonsA Field Study". Environmental Science & Technology. 38 (2): 609–616. Bibcode: 2004EnST...38..609S. doi: 10.1021/es034417r. PMID 14750739.
- ^ Fink, Kathrin; Richling, Elke; Heckel, Frank; Schreier, Peter (2004). "Determination of2H/1H and13C/12C Isotope Ratios of (E)-Methyl Cinnamate from Different Sources Using Isotope Ratio Mass Spectrometry". Journal of Agricultural and Food Chemistry. 52 (10): 3065–3068. doi: 10.1021/jf040018j. PMID 15137854.
- ^ Tamura, Hirotoshi; Appel, Markus; Richling, Elke; Schreier, Peter (2005). "Authenticity Assessment of γ- and δ-Decalactone from Prunus Fruits by Gas Chromatography Combustion/Pyrolysis Isotope Ratio Mass Spectrometry (GC-C/P-IRMS)". Journal of Agricultural and Food Chemistry. 53 (13): 5397–5401. doi: 10.1021/jf0503964. PMID 15969525.
- ^ Richling, Elke; Preston, Christina; Kavvadias, Dominique; Kahle, Kathrin; Heppel, Christopher; Hummel, Silvia; König, Thorsten; Schreier, Peter (2005). "Determination of the2H/1H and15N/14N Ratios of Alkylpyrazines from Coffee Beans (Coffea arabicaL. and Coffea canephoravar.robusta) by Isotope Ratio Mass Spectrometry". Journal of Agricultural and Food Chemistry. 53 (20): 7925–7930. doi: 10.1021/jf0509613. PMID 16190651.
- ^ Piper, Thomas; Thevis, Mario; Flenker, Ulrich; Schänzer, Wilhelm (2009). "Determination of the deuterium/hydrogen ratio of endogenous urinary steroids for doping control purposes". Rapid Communications in Mass Spectrometry. 23 (13): 1917–1926. Bibcode: 2009RCMS...23.1917P. doi: 10.1002/rcm.4098. PMID 19462405.
- ^ Piper, Thomas; Degenhardt, Karoline; Federherr, Eugen; Thomas, Andreas; Thevis, Mario; Saugy, Martial (2012). "Effect of changes in the deuterium content of drinking water on the hydrogen isotope ratio of urinary steroids in the context of sports drug testing" (PDF). Analytical and Bioanalytical Chemistry. 405 (9): 2911–2921. doi: 10.1007/s00216-012-6504-7. PMID 23128907. S2CID 206911124.
- ^ Jasper, J.P.; Westenberger, B.J.; Spencer, J.A.; Buhse, L.F.; Nasr, M. (2004). "Stable isotopic characterization of active pharmaceutical ingredients". Journal of Pharmaceutical and Biomedical Analysis. 35 (1): 21–30. doi: 10.1016/S0731-7085(03)00581-8. PMID 15030876.
- ^ Wokovich, A.M.; Spencer, J.A.; Westenberger, B.J.; Buhse, L.F.; Jasper, J.P. (2005). "Stable isotopic composition of the active pharmaceutical ingredient (API) naproxen". Journal of Pharmaceutical and Biomedical Analysis. 38 (4): 781–784. doi: 10.1016/j.jpba.2005.02.033. PMID 15967309.
- ^ Jasper, J.P.; Weaner, L.E.; Duffy, B.J. (2005). "A preliminary multi-stable-isotopic evaluation of three synthetic pathways of Topiramate". Journal of Pharmaceutical and Biomedical Analysis. 39 (1–2): 66–75. doi: 10.1016/j.jpba.2005.03.011. PMID 15925470.
- ^ Felton, Linda A.; Shah, Punit P.; Sharp, Zachary; Atudorei, Viorel; Timmins, Graham S. (2010). "Stable isotope-labeled excipients for drug product identification and counterfeit detection". Drug Development and Industrial Pharmacy. 37 (1): 88–92. doi: 10.3109/03639045.2010.492397. PMID 20560792. S2CID 25064362.
- ^ Acetti, Daniela; Brenna, Elisabetta; Fronza, Giovanni; Fuganti, Claudio (2008). "Monitoring the synthetic procedures of commercial drugs by 2H NMR spectroscopy: The case of ibuprofen and naproxen". Talanta. 76 (3): 651–655. doi: 10.1016/j.talanta.2008.04.009. PMID 18585334.
- ^ Brenna, Elisabetta; Fronza, Giovanni; Fuganti, Claudio (2007). "Traceability of synthetic drugs by position-specific deuterium isotope ratio analysis". Analytica Chimica Acta. 601 (2): 234–239. doi: 10.1016/j.aca.2007.08.047. PMID 17920397.
- ^ Carter, James F.; Titterton, Emma L.; Murray, Martin; Sleeman, Richard (2002). "Isotopic characterisation of 3,4-methylenedioxyamphetamine and 3,4-methylenedioxymethylamphetamine (ecstasy)". The Analyst. 127 (6): 830–833. Bibcode: 2002Ana...127..830C. doi: 10.1039/b201496n. PMID 12146919. S2CID 7161041.
- ^ Idoine, Fay A.; Carter, James F.; Sleeman, Richard (2005). "Bulk and compound-specific isotopic characterisation of illicit heroin and cling film". Rapid Communications in Mass Spectrometry. 19 (22): 3207–3215. Bibcode: 2005RCMS...19.3207I. doi: 10.1002/rcm.2153. PMID 16220464.
- ^ Hays, Patrick A.; Remaud, Gérald S.; Jamin, Éric; Martin, Yves-Loïc (2000). "Geographic Origin Determination of Heroin and Cocaine Using Site-Specific Isotopic Ratio Deuterium NMR". Journal of Forensic Sciences. 45 (3): 552–562. doi: 10.1520/JFS14728J. PMID 10855958.
- ^ Ehleringer, J. R.; Bowen, G. J.; Chesson, L. A.; West, A. G.; Podlesak, D. W.; Cerling, T. E. (2008). "Hydrogen and oxygen isotope ratios in human hair are related to geography". Proceedings of the National Academy of Sciences. 105 (8): 2788–2793. Bibcode: 2008PNAS..105.2788E. doi: 10.1073/pnas.0712228105. PMC 2268538. PMID 18299562.
- ^ Chesson, L. A.; Tipple, B. J.; Howa, J. D.; Bowen, G. J.; Barnette, J. E.; Cerling, T. E.; Ehleringer, J. R. (2014-01-01). Turekian, Karl K. (ed.). 14.19 - Stable Isotopes in Forensics Applications A2 - Holland, Heinrich D. Oxford: Elsevier. pp. 285–317. doi: 10.1016/b978-0-08-095975-7.01224-9. ISBN 9780080983004.