| 1999 Pacific hurricane season | |
|---|---|
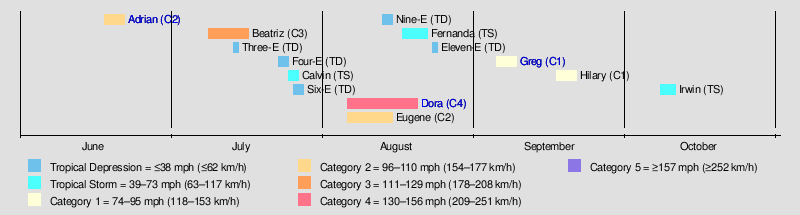
 Season summary map | |
| Seasonal boundaries | |
| First system formed | June 18, 1999 |
| Last system dissipated | October 11, 1999 |
| Strongest storm | |
| Name | Dora |
| • Maximum winds | 140 mph (220 km/h) (1-minute sustained) |
| • Lowest pressure | 943 mbar ( hPa; 27.85 inHg) |
| Seasonal statistics | |
| Total depressions | 14 |
| Total storms | 9 |
| Hurricanes | 6 |
| Major hurricanes ( Cat. 3+) | 2 |
| Total fatalities | 16 total |
| Total damage | None |
| Related articles | |
The 1999 Pacific hurricane season was one of the least active Pacific hurricane seasons on record. The season officially began on May 15 in the Eastern Pacific, and on June 1 in the Central Pacific; in both basins, it ended on November 30. These dates conventionally delimit the period during which most tropical cyclones form in the northeastern Pacific Ocean. The first tropical cyclone of the season, Hurricane Adrian, developed on June 18, while the final storm of the season, Tropical Storm Irwin, dissipated on October 11. No storms developed in the Central Pacific during the season. However, two storms from the Eastern Pacific, Dora and Eugene, entered the basin, with the former entering as a hurricane and becoming the second farthest travelling Pacific hurricane on record.
The season produced fourteen tropical cyclones and nine named storms, which was well below the average of sixteen named storms per season; this was largely due to a strong La Niña taking over much of the Pacific. However, the total of six hurricanes and two major hurricanes during the season was near the averages of eight and three, respectively. Although it remained offshore, Hurricane Adrian caused 6 deaths from flooding and rough surf in Mexico. The deadliest tropical cyclone, Hurricane Greg, killed 10 people from flooding in Mexico.
Seasonal summary
The 1999 Pacific hurricane season officially started on May 15, 1999 in the eastern Pacific, and on June 1, 1999, in the central Pacific, and lasted until November 30, 1999. These dates conventionally delimit the period of each year when most tropical cyclones form in the northeastern Pacific Ocean. [1] The 1999 Pacific hurricane season was well below average, due to the strong La Niña that was occurring at the time, which causes wind shear to be increased and water temperatures to decrease, resulting in conditions less conductive for tropical cyclones in the East Pacific. There were 14 cyclones in total, including 5 unnamed tropical depressions. Of these, 9 became a tropical storm, while 6 reached hurricane status. Further, 2 of these became major hurricanes, which is Category 3 intensity or higher on the Saffir-Simpson hurricane scale. [2]
Tropical cyclogenesis began with Hurricane Adrian, which developed on June 18. Although it remained offshore, Adrian brought rough surf and flooding to Mexico, which resulted in 6 fatalities. The storm peaked as a Category 2 before dissipating on June 22. No other tropical cyclones formed in June. Activity halted until July 9, when Hurricane Beatriz developed. Though it peaked as a Category 3 hurricane before dissipating on July 17, the storm caused no damage on land because it remained well offshore. The next system, a short-lived Tropical Depression Three-E, did not result in impact as a tropical cyclone, [2] though the precursor brought heavy rainfall and gusty winds to Central America. [3] [4] Tropical Depression Four-E, was the first of three cyclones to cross into the Central Pacific Hurricane Center's area of responsibility, which is between 140°W and the International Date Line. [5] Two other short-lived system in July, Tropical Storm Calvin and Tropical Depression Six-E, caused no damage. [2]
In August, Hurricane Dora, the strongest storm of the 1999 Pacific hurricane season, [2] produced gusty winds and large waves on Johnston Atoll and the island of Hawaii, though minimal damage was left in its wake. [5] After crossing the International Date Line on August 20, Dora became the first tropical cyclones to exist in all three basins of the North Pacific – Eastern, Central, and Western – since Hurricane John in 1994. [2] Hurricane Eugene also existed in the Eastern and Central Pacific, but dissipated on August 15 while south of the main Hawaiian Islands, well before reaching the International Date Line. Nonetheless, it produced up to 2 inches (51 mm) of rainfall on the Big Island of Hawaii. [5] In the remainder of August, there was a series of short-lived tropical cyclones that did not effect land, including Tropical Depression Nine-E, Tropical Storm Fernanda, and Tropical Depression Eleven-E. [2]
During the month of September, the deadliest tropical cyclone of the season, Hurricane Greg, was spawned near the Pacific coast of Mexico. [2] Greg which killed 10 people when it made landfall on southern Baja California. [2] [6] The hurricane and its precursor produced heavy rainfall across much of Mexico, with the highest total reaching 22.23 in (565 mm). [7] The heavy rains damaged or destroyed more than 2,000 homes. [8] The remnant moisture from the system, combined with an area of low pressure, resulted in strong thunderstorms across California, which led to numerous power outages, damage to homes and vehicles, and started many wildfires. [9] [10] [11] The other in the month of September was Hurricane Hilary, a storm that approached Baja California, but dissipated offshore on September 21, resulting in no impact. [2] The final system, Tropical Storm Irwin, produced scattered areas of heavy rainfall over Mexico in October, [12] but caused no significant flooding. [2] It dissipated on October 11, [2] over a month and a half before the official end of the season on November 30. [1]
In addition to the systems observed by the CPHC and NHC, a tropical depression formed east of the International Dateline on August 19, and quickly exited CPHC's area of responsibility; [13] [14] however, this storm was not included into CPHC database.
Systems
Hurricane Adrian
| Category 2 hurricane (SSHWS) | |

 | |
| Duration | June 18 – June 22 |
|---|---|
| Peak intensity | 100 mph (155 km/h) (1-min); 973 mbar ( hPa) |
A broad area of low pressure developed into Tropical Depression One at 0600 UTC on June 18, while situated 290 miles (470 km) southeast of Acapulco, Guerrero. Moving towards west-northwestward, the depression intensified into Tropical Storm Adrian about 12 hours later. Favorable levels of wind shear and warm sea surface temperatures (SST's) caused the storm to strengthen further. Early on June 20 Adrian intensified into a hurricane, while located about 420 miles (680 km) south-southeast of the southern tip of Baja California. About 24 hours later, Adrian reached its peak intensity with winds of 100 mph (160 km/h) and a minimum barometric pressure of 973 mbar (28.7 inHg). [15]
After reaching peak intensity on June 21, Adrian began weakening due to colder SST's and higher wind shear. Adrian fell to tropical storm status late on June 21, and further weakened to a tropical depression on June 22. Six hours later at 1800 UTC, Adrian degenerated into a swirl of low clouds while situated 300 mi (480 km) southwest of the southern tip of Baja California. Heavy rainfall produced from the storm caused minor flooding throughout Mexico. Two fatalities were directly attributed to the floods, while another person was listed as missing. Four other people were killed when they drowned in rough seas produced offshore the Mexican coastline. There is no damage estimate from the heavy rainfall or rough seas associated with the hurricane. [15]
Hurricane Beatriz
| Category 3 hurricane (SSHWS) | |

 | |
| Duration | July 9 – July 17 |
|---|---|
| Peak intensity | 120 mph (195 km/h) (1-min); 955 mbar ( hPa) |
A tropical wave developed into by 0600 UTC on July 9, while situated roughly 300 mi (480 km) south of Lázaro Cárdenas, Mexico. At this time, the depression was in an environment of strong upper-tropospheric outflow, resulting in gradual intensification. The depression was upgraded to Tropical Storm Beatriz at 1200 UTC on July 9. Steady strengthened continued and about 48 hours later, Beatriz became a Category 1 while situated roughly 560 miles (900 km) south-southwest of Cabo San Lucas. Moving westward around the southern periphery of a ridge to the north, it continued to intensify. A well-defined eye became visible on satellite imagery early on July 12. Microwave imagery a few hours later revealed that Beatriz was likely undergoing an eyewall replacement cycle and was complete by 1700 UTC. [16]
Further intensification occurred, and Beatriz became the first major hurricane of the season at 1800 UTC on July 12. At 0600 UTC the following day, the hurricane attained its peak intensity with winds of 115 mph (185 km/h) and a minimum barometric pressure of 955 mbar (28.2 inHg) while situated roughly 800 miles (1,300 km) southwest of Cabo San Lucas. Curving towards the west-northwest, Beatriz began to encounter an area of cooler sea surface temperatures, which led to gradual weakening. The hurricane weakened to a tropical storm at 0000 UTC on July 16, and further to a tropical depression by 1800 UTC that day. At 0600 UTC on July 17, Beatriz degenerated into a swirl of clouds. [16]
Tropical Depression Three-E
| Tropical depression (SSHWS) | |

 | |
| Duration | July 14 – July 15 |
|---|---|
| Peak intensity | 35 mph (55 km/h) (1-min); 1007 mbar ( hPa) |
A tropical wave moved across the Atlantic and Caribbean in early July. While crossing Central America on July 11 and July 12, the system produced gusty winds and heavy rainfall, especially in Honduras, Nicaragua, [3] and Mexico, where precipitation reached 15.75 inches (400 mm) in Coyutla, Veracruz. [4] By July 13, the wave and associated low pressure area emerged into the Pacific Ocean. The system organized further and developed into Tropical Depression Three-E at 1200 UTC on July 14, while located about 290 miles (470 km) west-southwest of Manzanillo, Mexico. It initially headed west-northwestward until July 15, when it curved west-southwestward. The depression failed to strengthen further and dissipated at 1800 UTC on July 15, while located about 460 miles (740 km) southwest of Cabo San Lucas, Mexico. [3]
Tropical Depression Four-E
| Tropical depression (SSHWS) | |

 | |
| Duration | July 23 – July 25 |
|---|---|
| Peak intensity | 35 mph (55 km/h) (1-min); 1007 mbar ( hPa) |
On July 15, a tropical wave entered the eastern Pacific Ocean. Over the following days, slow organization occurred, and it is estimated that the system became developed into Tropical Depression Four-E at 0000 UTC on July 23. Later that day, the depression reached its peak intensity with maximum sustained winds of 35 mph (56 km/h) and a minimum barometric pressure of 1,007 mbar (29.7 inHg), having failed to reach tropical storm status. [17] While moving westward, the depression entered the Central Pacific Hurricane Center's area of responsibility on July 24. [5] [17] By this time, however, the depression was already becoming disorganized and dissipated early on the following day. [17]
Tropical Storm Calvin
| Tropical storm (SSHWS) | |

 | |
| Duration | July 25 – July 27 |
|---|---|
| Peak intensity | 40 mph (65 km/h) (1-min); 1005 mbar ( hPa) |
A tropical wave crossed the Atlantic Ocean and Caribbean Sea between early and mid-July. Later in the month, the wave acquired a low-level circulation. Thus, Tropical Depression Five-E developed at 0600 UTC on July 25, while situated about 645 miles (1,038 km) south-southwest of Cabo San Lucas. Due to further organization on satellite imagery, the depression was upgraded to Tropical Storm Calvin six hours later. However, wind shear exposed the low-level circulation and halted intensification. Calvin continued west-northwestward as a sheared cyclone. [18]
According to satellite classifications, it is estimated that Calvin weakened back to a tropical depression at 0600 UTC on July 26. There was a convective burst late on July 26, though the storm did not re-strengthen. Around that time, Calvin turned northwestward in response to a mid-tropospheric trough. The burst in convection did not persist and the depression dissipated by 1200 UTC on July 27, while located well west-southwest of Baja California. A low-cloud swirl remained and subsequently continued on a west-northwesterly course for a few days. [18]
Tropical Depression Six-E
| Tropical depression (SSHWS) | |

 | |
| Duration | July 26 – July 28 |
|---|---|
| Peak intensity | 35 mph (55 km/h) (1-min); 1005 mbar ( hPa) |
A tropical wave that previously crossed the Atlantic Ocean and Caribbean Sea reached the eastern Pacific basin until late July. The system developed a surface circulation on July 26, while microwave imagery data indicated wind speeds of 37 mph (60 km/h). As a result, it is estimated that Tropical Depression Six-E developed at 1800 UTC, while located nearly 1,150 miles (1,850 km) west-southwest of the southern tip of Baja California and about 415 miles (668 km) southwest of Tropical Depression Calvin. The depression moved toward the west-northwest and encountered strong vertical wind-shear. Despite a few convective bursts, the depression remained weak and degenerated into a swirl of low clouds at 0000 UTC on July 28. [19]
Hurricane Dora
| Category 4 hurricane (SSHWS) | |

 | |
| Duration | August 6 – August 20 ( Exited basin) |
|---|---|
| Peak intensity | 140 mph (220 km/h) (1-min); 943 mbar ( hPa) |
A tropical wave moved off Africa on July 23 and crossed the Atlantic Ocean without development. However, the wave quickly increased in organization after entering the Eastern Pacific Ocean on August 4, and was designated Tropical Depression Seven-E on August 6. The depression strengthened into Tropical Storm Dora later that day. Dora continued to intensify despite upper-level wind shear, and became a hurricane on August 8. Shortly after, the hurricane moved westward into a more favorable environment and began to intensify more quickly, reaching Category 4 strength on August 10. It maintained that intensity for three days as it moved almost due west. [20]
Dora weakened to Category 1 strength as it entered the Central Pacific Hurricane Center's area of responsibility on August 14. However, it briefly restrengthened into a Category 3 as it passed south of Hawaii on August 16. Dora then began weakening for the final time as it passed south of Johnston Atoll on August 18. [20] At the atoll, Dora produced large waves and wind gusts between 40 and 45 mph (64 and 72 km/h). [5] In Hawaii, heavy surf on the Big Island forced the closure of beaches, campsites, and hiking trails in the districts of Kau and Puna. [21] On August 20, Dora crossed the International Date Line, [5] while weakening to a tropical storm. Due to vertical wind shear, it did not re-strengthen in the western Pacific basin. The storm weakened more, falling to tropical depression intensity early on August 22. Dora dissipated late on the following day, while situated several hundred miles east of Wake Island. [20]
Hurricane Eugene
| Category 2 hurricane (SSHWS) | |

 | |
| Duration | August 6 – August 15 |
|---|---|
| Peak intensity | 110 mph (175 km/h) (1-min); 964 mbar ( hPa) |
A tropical wave crossed Central America between July 28 and July 29, before entering the Pacific Ocean and slowly organizing. After the cloud pattern consolidated, it is estimated that Tropical Depression Eight-E developed at 0600 UTC on August 6, while located about 975 miles (1,569 km) southwest of Cabo San Lucas, Mexico. Twelve hours later, the depression was upgraded to Tropical Storm Eugene. It continued to deepen, reaching hurricane status late on August 8. About 24 hours later, Eugene peaked as a strong Category 2 hurricane with winds of 110 mph (180 km/h). The storm began to weaken and was downgraded to a Category 1 hurricane early on August 11. [22]
Eugene continued westward, and on August 11, it entered the Central Pacific Hurricane Center's area of responsibility. It continued to weaken and was downgraded to a tropical storm early on August 13. Eugene passed south of the Hawaiian Islands on August 14, with minimal impact noted. Minor surf occurred along the east and southeast shores of the Big Island. Additionally, 24‑hour rainfall totals over windward sections of Maui and the Big Island were near 2 inches (51 mm). The storm weakened to a tropical depression by late on August 14. At 0000 UTC on August 16, Eugene dissipated while located about 550 miles (890 km) southeast of Johnston Atoll. [5]
Tropical Depression Nine-E
| Tropical depression (SSHWS) | |

 | |
| Duration | August 13 – August 15 |
|---|---|
| Peak intensity | 35 mph (55 km/h) (1-min); 1005 mbar ( hPa) |
A tropical wave moved off the African coast on July 27 and entered the Pacific Ocean on August 6. The system continued westward without development until August 11, when convection began to increase. By 1200 UTC on August 13, the National Hurricane Center began classifying the system as Tropical Depression Nine-E. Due easterly wind shear, the depression did not further intensify as it moved on a generally west-northwesterly track. The depression had dissipated by August 15. [23]
Tropical Storm Fernanda
| Tropical storm (SSHWS) | |

 | |
| Duration | August 17 – August 22 |
|---|---|
| Peak intensity | 65 mph (100 km/h) (1-min); 994 mbar ( hPa) |
A tropical wave developed into Tropical Depression Ten-E at 0600 UTC on August 17, while located about 460 miles (740 km) in south-southwest of Socorro Island, Mexico. The depression intensified gradually due to favorable conditions. At 0000 UTC on August 18, the cyclone was upgraded to Tropical Storm Fernanda while centered about 520 miles (840 km) southwest of Socorro Island. The storm continued to slowly strengthened and 1200 UTC on August 19, Fernanda attained its peak intensity with maximum sustained winds of 65 mph (105 km/h) and a minimum barometric pressure of 994 mbar (29.4 inHg). [24]
Around the time of peak intensity on August 19, Fernanda curved west-southwest track, a motion which persisted for the remainder of its duration. While this track carried the storm over warmer SST's, increasing easterly wind shear caused Fernanda to weaken. By early on August 21, Fernanda weakened to a tropical depression. After weakening slightly further, the storm degenerated into a remnant low cloud swirl at 0000 UTC on August 23. The remnants of Fernanda persisted until finally losing its identity about 290 miles (470 km) west-southwest of Socorro Island on August 28. [24]
Tropical Depression Eleven-E
| Tropical depression (SSHWS) | |

 | |
| Duration | August 23 – August 24 |
|---|---|
| Peak intensity | 35 mph (55 km/h) (1-min); 1000 mbar ( hPa) |
A tropical wave entered the eastern Pacific on August 15 and formed a surface low pressure area south of Mexico on August 19. After consolidating and organizing somewhat, the system became Tropical Depression Eleven-E late on August 23. However, colder SST's caused convection to diminish almost immediately, while moving parallel to the southern coast of Baja California. as thunderstorm activity slowly decreased due to cool SST's. By 1200 UTC on August 24, the depression dissipated just west of the tip of Baja California, having lasted for less than 24 hours. [25] The highest rainfall total reported in Mexico was 8.27 inches (210 mm) at Los Cabos, Baja California Sur. [26]
Hurricane Greg
| Category 1 hurricane (SSHWS) | |

 | |
| Duration | September 5 – September 9 |
|---|---|
| Peak intensity | 75 mph (120 km/h) (1-min); 986 mbar ( hPa) |
The northern portion of a tropical wave in the Atlantic spawned Tropical Storm Emily, while the southern portion headed westward and crossed Central America between August 31 and September 1. Thereafter, the system emerged into the Pacific Ocean and began to organize. By 1200 UTC on September 5, Tropical Depression Twelve-E developed near Manzanillo, Mexico. Six hours later, the depression strengthened into Tropical Storm Greg. Further intensification occurred, and late on September 6, Greg was upgraded to a hurricane as winds reached 75 mph (121 km/h). However, Greg weakened to a tropical storm on September 7, while approaching Baja California. At 2100 UTC that day, it made landfall near Cabo San Lucas. The storm then curved westward and weakened over colder SST's, until dissipating on late September 9. [27]
Both Gerg and its predecessor disturbance brought heavy rain to much of Mexico. The highest report was of 22.23 inches (565 mm) in Tecomán, Colima. [7] Precipitation from Greg caused flooding in the states of Colima, Michoacán, Sinaloa, Nayarit, and Jalisco. [28] It was most severe along the Los Mezcales River. [29] The flooding killed ten people. [6] In addition, 2,000 people were rendered homeless and 2,000 others were affected in some way. [8] The remnants of Greg produced thunderstorms in California, particularly the San Francisco Bay Area. As a result, there was widespread power outages and isolated damage to houses and vehicles, as well as causing several small wildfires. Overall damage was relatively limited, however. [9] [10] [11]
Hurricane Hilary
| Category 1 hurricane (SSHWS) | |

 | |
| Duration | September 17 – September 21 |
|---|---|
| Peak intensity | 75 mph (120 km/h) (1-min); 987 mbar ( hPa) |
A tropical wave moved off the coast of western Africa into the Atlantic Ocean on August 29. It continued to move westward through the tropical waters of the Atlantic into the Caribbean. It still remained a tropical wave as it moved over Central America and began to acquire more convection and organization, from September 10 through September 11. Visible satellite imagery showed low level circulation and more organized deep convection as it became a tropical depression on September 17, while located about 475 miles (764 km) south-southeast of the southern tip of the Baja California Peninsula. [30]
The system strengthened and was upgraded to Tropical Storm Hilary at 1200 UTC on September 18. Due to the development of an eye feature and large increase in deep convection, Hilary was upgraded to hurricane on September 20, while located about 200 miles (320 km) southwest of the Baja California Peninsula. However, later that day, Hilary weakened back to a tropical storm. The storm fell further to tropical depression status on September 21. Hours later, the storm degenerated into a swirl of low-level clouds, as it bypassed Baja California on September 21. [30]
Tropical Storm Irwin
| Tropical storm (SSHWS) | |

 | |
| Duration | October 8 – October 11 |
|---|---|
| Peak intensity | 60 mph (95 km/h) (1-min); 996 mbar ( hPa) |
The southern portion of the tropical wave that previously spawned Tropical Depression Eleven in the Gulf of Mexico entered the Pacific Ocean in early October. After becoming better organized, the system developed into Tropical Depression Fourteen-E at 1200 UTC on October 8, while situated about 145 miles (233 km) south-southwest of Manzanillo, Mexico. The depression initially moved slowly north-northwestward and strengthened into Tropical Storm Irwin about six hours later. After a strong mid-tropospheric ridge developed over northern Mexico, Irwin moved northwestward and remained offshore Mexico. [31]
Early on October 9, the center of the storm passed within about 85 miles (137 km) of the coastline between Manzanillo and Cabo Corrientes. [31] The storm then curved west-northwestward and at 1800 UTC on October 9, Irwin attained peaked with winds of 60 mph (97 km/h). Stable air and increasing wind shear caused Irwin to weaken and fall to tropical depression intensity early on October 11. About 12 hours later, the storm dissipated while located about 405 miles (652 km) southwest of Cabo San Lucas. [31] While passing offshore, Irwin brought patches of heavy rainfall to some areas of Mexico, peaking at 9.92 inches (252 mm) in Coahuayutla de Guerrero, Guerrero. [12]
Storm names
The following list of names was used for named storms that formed in the North Pacific Ocean east of 140°W in 1999. [32] [33] This is the same list used for the 1993 season. [34] No names were retired from this list by the World Meteorological Organization following the season, and it was used again for the 2005 season. [35]
|
|
For storms that form in the North Pacific between 140°W to the International Date Line, the names come from a series of four rotating lists. Names are used one after the other without regard to year, and when the bottom of one list is reached, the next named storm receives the name at the top of the next list. [32] No named storms formed within the area in 1999. Named storms in the table above that crossed into the area during the season are noted (*). [36]
Season effects
This is a table of all of the tropical cyclones that formed in the 1999 Pacific hurricane season. It includes their name, duration (within the basin), peak classification and intensities, areas affected, damage, and death totals. Deaths in parentheses are additional and indirect (an example of an indirect death would be a traffic accident), but were still related to that storm. Damage and deaths include totals while the storm was extratropical, a wave, or a low, and all of the damage figures are in 1999 USD.
| Saffir–Simpson scale | ||||||
| TD | TS | C1 | C2 | C3 | C4 | C5 |
| Storm name |
Dates active | Storm
category at peak intensity |
Max 1-min wind mph (km/h) |
Min. press. ( mbar) |
Areas affected | Damage ( USD) |
Deaths | Ref(s) | ||
|---|---|---|---|---|---|---|---|---|---|---|
| Adrian | June 18–22 | Category 2 hurricane | 100 (155) | 973 | Mexico | Minimal | 6 | |||
| Beatriz | July 9–17 | Category 3 hurricane | 120 (195) | 955 | None | None | None | |||
| Three-E | July 14–15 | Tropical depression | 35 (55) | 1007 | None | None | None | |||
| Four-E | July 23–25 | Tropical depression | 35 (55) | 1007 | None | None | None | |||
| Calvin | July 25–27 | Tropical storm | 40 (65) | 1005 | None | None | None | |||
| Six-E | July 26–28 | Tropical depression | 35 (55) | 1005 | None | None | None | |||
| Dora | August 6–20 | Category 4 hurricane | 140 (220) | 943 | Hawaii, Johnston Atoll | Minimal | None | |||
| Eugene | August 6–15 | Category 2 hurricane | 110 (175) | 964 | None | None | None | |||
| Nine-E | August 13–15 | Tropical depression | 35 (55) | 1005 | None | None | None | |||
| Fernanda | August 17–22 | Tropical storm | 65 (100) | 994 | Socorro Island | None | None | |||
| Eleven-E | August 23–24 | Tropical depression | 35 (55) | 1000 | Baja California Peninsula | Minimal | None | |||
| Greg | September 5–9 | Category 1 hurricane | 75 (120) | 986 | Western Mexico, Baja California Peninsula | Unknown | 10 | |||
| Hilary | September 17–21 | Category 1 hurricane | 75 (120) | 987 | Baja California Peninsula | None | None | |||
| Irwin | October 8–11 | Tropical storm | 60 (95) | 996 | Southwestern Mexico, Guerrero | Minimal | None | |||
| Season aggregates | ||||||||||
| 14 systems | June 18 – October 11 | 140 (220) | 943 | Unknown | 16 | |||||
See also
- List of Pacific hurricanes
- Pacific hurricane season
- 1999 Atlantic hurricane season
- 1999 Pacific typhoon season
- 1999 North Indian Ocean cyclone season
- South-West Indian Ocean cyclone seasons: 1998–99, 1999–00
- Australian region cyclone seasons: 1998–99, 1999–00
- South Pacific cyclone seasons: 1998–99, 1999–00
References
- ^ a b 4. When is hurricane season? (Report). Central Pacific Hurricane Center. April 13, 2012. Archived from the original on April 6, 2010. Retrieved March 2, 2013.
- ^ a b c d e f g h i j k John L. Beven II; James L. Franklin (April 2004). Eastern North Pacific Hurricane Season of 1999. National Hurricane Center (Report). Vol. 132. American Meteorological Society. pp. 1036–1046. doi: 10.1175/1520-0493(2004)132<1036:ENPHSO>2.0.CO;2.
- ^ a b c John L. Guiney (July 25, 1999). Preliminary Report: Tropical Depression Three-E (Report). National Hurricane Center. Archived from the original on October 15, 2012. Retrieved March 1, 2013.
- ^ a b David M. Roth (May 1, 2009). Tropical Depression 03E - July 10-15, 1999 (Report). Hydrometeorological Prediction Center. Archived from the original on September 22, 2013. Retrieved March 1, 2013.
- ^ a b c d e f g Benjamin C. Hablutzel; James C. Weyman; Hans E. Rosendal; Paul A. Jendrowski; Jonathan D. Hoag; Raymond M. Tanabe. The 1999 Central Pacific Hurricane Season (Report). Central Pacific Hurricane Center. Archived from the original on December 11, 2006. Retrieved March 1, 2013.
- ^ a b "Hurricane Greg hits Mexico". BBC News. September 7, 1999. Archived from the original on April 27, 2006. Retrieved March 2, 2013.
- ^ a b David M. Roth (October 27, 2007). Hurricane Greg - September 1-10, 1999 (Report). Hydrometeorological Prediction Center. Archived from the original on September 22, 2013. Retrieved March 1, 2013.
- ^ a b EM-DAT Visualization Page. EM-DAT: The OFDA/CRED International Disaster Database (Report). Université Catholique de Louvain Brussels - Belgium. Archived from the original on December 13, 2007. Retrieved March 1, 2013.
- ^ a b David Tuller; Chuck Squatriglia (September 9, 1999). "Surprise thunderstorm booms through Bay Area". San Francisco Chronicle. Retrieved March 1, 2013.
- ^ a b Michael Dougan (September 9, 1999). "Awesome lightning display over Bay". San Francisco Examiner. Retrieved March 1, 2013.
- ^ a b Christopher Heredia (September 10, 1999). "Thunderstorm roars through but causes little damage". San Francisco Chronicle. Retrieved March 1, 2013.
- ^ a b David M. Roth (March 5, 2008). Tropical Storm Irwin - October 7-10, 1999 (Report). Hydrometeorological Prediction Center. Archived from the original on September 21, 2013. Retrieved March 1, 2013.
- ^ "Japan Meteorological Agency Best Tracks" (ZIP). Japan Meteorological Agency. 2015. Archived from the original on December 8, 2015. Retrieved November 29, 2015.
- ^ "bwp061998" (TXT). Joint Typhoon Warning Center. 1998. Archived from the original on December 8, 2015. Retrieved November 29, 2015.
- ^ a b Miles B. Lawrence (July 17, 1999). Preliminary Report: Hurricane Adrian (Report). National Hurricane Center. Archived from the original on January 30, 2011. Retrieved March 1, 2013.
- ^ a b Richard J. Pasch (November 30, 1999). Preliminary Report: Hurricane Beatriz (Report). National Hurricane Center. Archived from the original on September 24, 2012. Retrieved March 1, 2013.
- ^ a b c Jack Beven (August 3, 1999). Brief Information About Tropical Depression Four-E (Report). National Hurricane Center. Archived from the original on October 15, 2012. Retrieved March 1, 2013.
- ^ a b James L. Franklin (July 30, 1999). Preliminary Report: Tropical Storm Calvin (Report). National Hurricane Center. Archived from the original on October 15, 2012. Retrieved March 1, 2013.
- ^ Lixion A. Avila (July 31, 1999). Brief Information About Tropical Depression Six-E (Report). National Hurricane Center. Archived from the original on October 15, 2012. Retrieved March 1, 2013.
- ^ a b c Miles B. Lawrence; Todd B. Kimberlain (October 23, 1999). Preliminary Report: Hurricane Dora (Report). National Hurricane Center. Archived from the original on April 8, 2012. Retrieved March 1, 2013.
- ^ Stephen Del Greco. Storm Data and Unusual Weather Phenomena With Late Reports and Corrections: August 1999 (PDF) (Report). National Climatic Data Center. p. 52. Retrieved March 1, 2013.[ permanent dead link]
- ^ Richard J. Pasch (March 7, 2000). Preliminary Report: Hurricane Eugene (Report). National Hurricane Center. Archived from the original on October 15, 2012. Retrieved March 1, 2013.
- ^ James L. Franklin (December 14, 1999). Tropical Depression Nine-E Preliminary Report (Report). National Hurricane Center. Archived from the original on October 15, 2012. Retrieved March 1, 2013.
- ^ a b Jack Beven (November 5, 1999). Preliminary Report: Tropical Storm Fernanda (Report). National Hurricane Center. Archived from the original on October 15, 2012. Retrieved March 1, 2013.
- ^ James L. Franklin (October 7, 1999). Preliminary Report: Tropical Depression Eleven-E (Report). National Hurricane Center. Archived from the original on October 15, 2012. Retrieved March 1, 2013.
- ^ David M. Roth (June 6, 2007). Tropical Depression 11E – August 21–25, 1999 (Report). Hydrometeorological Prediction Center. Archived from the original on September 21, 2013. Retrieved March 1, 2013.
- ^ Lixion A. Avila (October 17, 1999). Preliminary Report: Hurricane Greg (Report). National Hurricane Center. Archived from the original on March 28, 2008. Retrieved March 1, 2013.
- ^ Lixion A. Avila (October 17, 1999). Preliminary Report Hurricane Greg (Report). National Hurricane Center. Archived from the original on March 28, 2008. Retrieved March 2, 2013.
- ^ 1999 Flood Archive (Report). Dartmouth Flood Observatory. May 25, 2005. Archived from the original on February 26, 2008. Retrieved March 1, 2013.
- ^ a b Miles B. Lawrence (December 1, 1999). Preliminary Report: Hurricane Hilary (Report). National Hurricane Center. Archived from the original on October 15, 2012. Retrieved March 1, 2013.
- ^ a b c Richard J. Pasch (March 7, 2000). Preliminary Report: Tropical Storm Irwin (Report). National Hurricane Center. Archived from the original on September 21, 2013. Retrieved March 1, 2013.
- ^ a b National Hurricane Operations Plan (PDF) (Report). Washington, D.C.: NOAA Office of the Federal Coordinator for Meteorological Services and Supporting Research. May 1999. pp. 3-8–9. Retrieved January 19, 2024.
- ^ Null, Jan (June 8, 1999). "Weather Corner: All About Hurricanes". San Jose Mercury News. Archived from the original on September 13, 2013. Retrieved March 1, 2013.
- ^ National Hurricane Operations Plan (PDF) (Report). Washington, D.C.: NOAA Office of the Federal Coordinator for Meteorological Services and Supporting Research. April 1993. p. 3-6. Retrieved January 19, 2024.
- ^ "Worldwide Tropical Cyclone Names". National Hurricane Center. April 5, 2005. Archived from the original on April 7, 2005. Retrieved March 1, 2013.
- ^ Benjamin Hablutzel; James Weyman; Hans Rosendal; Paul Jendrowski; Jonathan Hoag; Raymond Tanabe (July 2000). Tropical Cyclones 1999 (PDF) (Report). Honolulu, Hawaii: Central Pacific Hurricane Center. Retrieved January 31, 2024.
External links
- NHC 1999 Pacific hurricane season archive
- HPC 1999 Tropical Cyclone Rainfall pages
- Central Pacific Hurricane Center archive
Tropical cyclones of the
1999 Pacific hurricane season | ||
|---|---|---|
| ||