Hinckley and Bosworth Borough Council elections are held every four years. Hinckley and Bosworth Borough Council is the local authority for the non-metropolitan district of Hinckley and Bosworth in Leicestershire, England. Since the last boundary changes in 2003, 34 councillors are elected from 16 wards. [1]
Council elections
- 1973 Hinckley and Bosworth Borough Council election
- 1976 Hinckley and Bosworth Borough Council election
- 1979 Hinckley and Bosworth Borough Council election
- 1983 Hinckley and Bosworth Borough Council election (New ward boundaries) [2]
- 1984 Hinckley and Bosworth Borough Council election
- 1986 Hinckley and Bosworth Borough Council election (Borough boundary changes took place but the number of seats remained the same) [3]
- 1987 Hinckley and Bosworth Borough Council election
- 1991 Hinckley and Bosworth Borough Council election (Borough boundary changes took place but the number of seats remained the same) [4]
- 1995 Hinckley and Bosworth Borough Council election
- 1999 Hinckley and Bosworth Borough Council election
- 2003 Hinckley and Bosworth Borough Council election (New ward boundaries) [5]
- 2007 Hinckley and Bosworth Borough Council election
- 2011 Hinckley and Bosworth Borough Council election
- 2015 Hinckley and Bosworth Borough Council election
- 2019 Hinckley and Bosworth Borough Council election
- 2023 Hinckley and Bosworth Borough Council election
Election results
| Overall control | Conservative | Labour | Lib Dem | ||||
| 2023 | Lib Dem | 10 | 2 | 22 | |||
| 2019 | Lib Dem | 11 | 2 | 21 | |||
| 2015 | Conservative | 21 | 1 | 12 | |||
| 2011 | Lib Dem | 15 | 1 | 18 | |||
| 2007 | Lib Dem | 13 | 2 | 19 | |||
| 2003 | Conservative | 20 | 6 | 8 | |||
Results maps
-
 2015 results map
 -
 2019 results map
 -
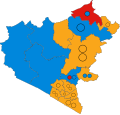 2023 results map


By-election results
1995-1999
| Party | Candidate | Votes | % | ±% | |
|---|---|---|---|---|---|
| Conservative | John Collins | 598 | 42.7 | +5.0 | |
| Liberal Democrats | Mary Pringle | 462 | 33.0 | +12.8 | |
| Labour | Stephen Hunnybun | 339 | 24.2 | -17.9 | |
| Majority | 136 | 9.7 | |||
| Turnout | 1,399 | 24.0 | |||
| Conservative hold | Swing | ||||
1999-2003
| Party | Candidate | Votes | % | ±% | |
|---|---|---|---|---|---|
| Liberal Democrats | Stuart Bray | 853 | 59.2 | +2.8 | |
| Conservative | Arthur Noon | 353 | 24.5 | -0.3 | |
| Labour | Jane Wilkins | 142 | 9.9 | -8.8 | |
| Independent | P J Hagan | 57 | 4.0 | +4.0 | |
| Independent | Mike Hall | 35 | 2.4 | +2.4 | |
| Majority | 500 | 34.7 | |||
| Turnout | 1,440 | 19.0 | |||
| Liberal Democrats hold | Swing | ||||
| Party | Candidate | Votes | % | ±% | |
|---|---|---|---|---|---|
| Liberal Democrats | Dianne Finney | 655 | 50.1 | -0.6 | |
| Conservative | Ruth Camamile | 540 | 41.3 | -8.0 | |
| Labour | T Murray | 113 | 8.6 | +8.6 | |
| Majority | 115 | 8.8 | |||
| Turnout | 1,308 | 33.3 | |||
| Liberal Democrats gain from Conservative | Swing | ||||
2003-2007
| Party | Candidate | Votes | % | ±% | |
|---|---|---|---|---|---|
| Liberal Democrats | Sandra Franks | 739 | 45.7 | +45.7 | |
| Conservative | Allan Keddy | 448 | 27.7 | -25.1 | |
| Labour | Andre Wheeler | 244 | 15.1 | -32.1 | |
| BNP | Mike Shore | 187 | 11.6 | +11.6 | |
| Majority | 291 | 18.0 | |||
| Turnout | 1,618 | 27.6 | |||
| Liberal Democrats gain from Conservative | Swing | ||||
| Party | Candidate | Votes | % | ±% | |
|---|---|---|---|---|---|
| Conservative | Peter Batty | 785 | 43.4 | -18.5 | |
| Liberal Democrats | Kenneth Charles Long | 545 | 30.1 | +30.1 | |
| BNP | Robert Crane | 247 | 13.7 | +13.7 | |
| Independent | John Hagen | 232 | 12.8 | -6.2 | |
| Majority | 240 | 13.3 | |||
| Turnout | 1,809 | 33.6 | |||
| Conservative hold | Swing | ||||
2007-2011
| Party | Candidate | Votes | % | ±% | |
|---|---|---|---|---|---|
| Liberal Democrats | Bronwen Witherford | 802 | 57.0 | -10.0 | |
| BNP | Mike Shore | 264 | 18.8 | +18.8 | |
| Conservative | Ian Coe | 226 | 16.1 | -8.7 | |
| Labour | Clark Mitchell | 116 | 8.2 | +0.0 | |
| Majority | 538 | 38.2 | |||
| Turnout | 1,408 | 29.6 | |||
| Liberal Democrats hold | Swing | ||||
| Party | Candidate | Votes | % | ±% | |
|---|---|---|---|---|---|
| Conservative | 637 | 35.2 | -0.1 | ||
| Labour | 521 | 28.8 | -11.7 | ||
| Liberal Democrats | 390 | 21.5 | +12.8 | ||
| BNP | 263 | 14.5 | -1.0 | ||
| Majority | 116 | 6.4 | |||
| Turnout | 1,811 | ||||
| Conservative hold | Swing | ||||
2015-2019
| Party | Candidate | Votes | % | ±% | |
|---|---|---|---|---|---|
| Conservative | David Macdonald | 822 | 39.0 | -4.6 | |
| Liberal Democrats | Robert Mayne | 785 | 37.3 | +8.3 | |
| Labour | Christina Emmett | 321 | 15.2 | +2.0 | |
| UKIP | Neale Smith | 120 | 5.7 | -8.5 | |
| Independent | Danny Findlay | 57 | 2.7 | +2.7 | |
| Majority | 37 | 1.8 | |||
| Turnout | 2,105 | ||||
| Conservative hold | Swing | ||||
References
- ^ "The Borough of Hinckley and Bosworth (Electoral Changes) Order 2002", legislation.gov.uk, The National Archives, SI 2002/2888, retrieved 18 August 2022
- ^ The Borough of Hinckley and Bosworth (Electoral Arrangements) Order 1980
- ^ The Leicestershire and Nottinghamshire (County and District Boundaries) Order 1985
- ^ legislation.gov.uk - The Derbyshire, Leicestershire, Lincolnshire, Nottinghamshire and Warwickshire (County Boundaries) Order 1991. Retrieved on 5 November 2015.
- ^ legislation.gov.uk - The Borough of Hinckley and Bosworth (Electoral Changes) Order 2002. Retrieved on 4 October 2015.
- ^ "Local Elections Archive Project — Markfield, Stanton and Fieldhead Ward". www.andrewteale.me.uk. Retrieved 25 August 2022.
- ^ "Former borough councillor is jailed for the murder of his partner". Hinckley Times. 3 June 2010. Retrieved 25 August 2022.
- ^ "Local Elections Archive Project — Burbage Sketchley and Stretton Ward". www.andrewteale.me.uk. Retrieved 25 August 2022.