
Havering London Borough Council in London, England is elected every four years. Since the last boundary changes in 2022, 55 councillors have been elected from 20 wards. [1]
Political control
The first election to the council was held in 1964, initially operating as a shadow authority ahead of the new system coming into full effect the following year. Political control of the council since 1964 has been held by the following parties:
| Election | Overall Control | Labour | Conservative | Ind./ Res. | Lib Dems | BNP | UKIP | |
|---|---|---|---|---|---|---|---|---|
| 1964 | No overall control | 27 | 16 | 12 | - | - | - | |
| 1968 | Conservative | 7 | 35 | 13 | - | - | - | |
| 1971 | Labour | 30 | 13 | 12 | - | - | - | |
| 1974 | No overall control | 26 | 20 | 9 | - | - | - | |
| 1978 | Conservative | 12 | 38 | 13 | - | - | - | |
| 1982 | Conservative | 12 | 37 | 9 | 5 | - | - | |
| 1986 | No overall control | 20 | 28 | 10 | 5 | - | - | |
| 1990 | No overall control | 25 | 19 | 13 | 6 | - | - | |
| 1994 | No overall control | 31 | 11 | 17 | 4 | - | - | |
| 1998 | No overall control | 29 | 14 | 17 | 3 | - | - | |
| 2002 | No overall control | 9 | 26 | 18 | 1 | - | - | |
| 2006 | Conservative | 2 | 34 | 16 | 1 | 1 | - | |
| 2010 | Conservative | 5 | 33 | 16 | - | - | - | |
| 2014 | No overall control | 1 | 22 | 24 | - | - | 7 | |
| 2018 | No overall control | 5 | 25 | 24 | - | - | - | |
| 2022 | No overall control | 9 | 23 | 23 | - | - | - | |
Council elections
- 1964 Havering London Borough Council election
- 1968 Havering London Borough Council election
- 1971 Havering London Borough Council election
- 1974 Havering London Borough Council election
- 1978 Havering London Borough Council election (boundary changes increased the number of seats by eight) [2]
- 1982 Havering London Borough Council election
- 1986 Havering London Borough Council election
- 1990 Havering London Borough Council election
- 1994 Havering London Borough Council election (boundary changes took place but the number of seats remained the same) [n 1] [n 2]
- 1998 Havering London Borough Council election
- 2002 Havering London Borough Council election (boundary changes reduced the number of seats by nine) [3] [4]
- 2006 Havering London Borough Council election
- 2010 Havering London Borough Council election
- 2014 Havering London Borough Council election
- 2018 Havering London Borough Council election
- 2022 Havering London Borough Council election (boundary changes increased the number of seats by one) [5]
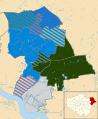
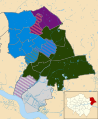
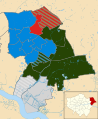
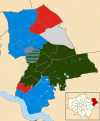
Borough result maps
-
 2002 results map
 -
 2006 results map
 -
 2010 results map
 -
 2014 results map
 -
 2018 results map
 -
 2022 results map


Wards
Wards were established for Havering when it came into existence on 1 April 1965. The first elections of ward councillors took place in 1964. [6] These boundaries were also used for the 1968, 1971 and 1974 elections. For the 1978 elections the ward boundaries were revised. [2] These boundaries were then also used at the 1982, 1986 and 1990 elections.
For the May 1994 elections there were minor adjustments to London borough boundaries, which affected the area and population of some Havering wards. [7] [8] These boundaries were also used at the 1998 elections. The ward boundaries were revised at the May 2002 elections. [4] These boundaries were also used at the 2006, 2010, 2014 and 2018 elections. The current ward boundaries came into effect at the May 2022 elections. [9]
By-election results
1964-1968
There were no by-elections. [10]
1968-1971
| Party | Candidate | Votes | % | ±% | |
|---|---|---|---|---|---|
| Conservative | F. J. Orrin | 968 | |||
| Conservative | C. J. Kemp | 967 | |||
| Independent Ratepayers | L. E. Jackson | 137 | |||
| Labour | A. E. Mills | 128 | |||
| Labour | C. J. Connor | 123 | |||
| Independent Ratepayers | R. C. Vickers | 123 | |||
| Turnout | 20.5% | ||||
| Conservative hold | Swing | ||||
| Conservative hold | Swing | ||||
| Party | Candidate | Votes | % | ±% | |
|---|---|---|---|---|---|
| Conservative | S. O. New | 839 | |||
| Independent | E. Bates | 183 | |||
| Labour | R. E. Whitworth | 58 | |||
| Turnout | 20.1% | ||||
| Party | Candidate | Votes | % | ±% | |
|---|---|---|---|---|---|
| Conservative | D. G. Peters | 1258 | |||
| Independent Ratepayers | T. S. C. Dix | 668 | |||
| Labour | G. W. Saunders | 279 | |||
| Liberal | B. A. Grant | 141 | |||
| Turnout | 27.7% | ||||
| Party | Candidate | Votes | % | ±% | |
|---|---|---|---|---|---|
| Labour | W. F. Cole | 1365 | |||
| Conservative | N. F. Symonds | 1189 | |||
| Communist | H. S. Reeves | 75 | |||
| Turnout | 26.7% | ||||
| Party | Candidate | Votes | % | ±% | |
|---|---|---|---|---|---|
| Labour | S. G. Heath-Coleman | 986 | |||
| Conservative | R. E. Ramsey | 199 | |||
| Communist | R. Cohen | 56 | |||
| Independent | K. W. Roe | 53 | |||
| Turnout | 19.1% | ||||
| Party | Candidate | Votes | % | ±% | |
|---|---|---|---|---|---|
| Conservative | A. Gladwin | 1462 | |||
| Labour | R. S. Kilbey | 339 | |||
| Turnout | 17.4% | ||||
1971-1974
| Party | Candidate | Votes | % | ±% | |
|---|---|---|---|---|---|
| Labour | A. E. Mills | 1,248 | |||
| Conservative | E. Joslin | 489 | |||
| Communist | H. S. Reeves | 20 | |||
| Turnout | 16.0% | ||||
| Party | Candidate | Votes | % | ±% | |
|---|---|---|---|---|---|
| Labour | W. C. Mills | 1,633 | |||
| Conservative | Mrs M. E. Noyes | 161 | |||
| Liberal | T. Hurlstone | 77 | |||
| Turnout | 19.4% | ||||
| Party | Candidate | Votes | % | ±% | |
|---|---|---|---|---|---|
| Labour | D. R. O'Flynn | 1,014 | |||
| Conservative | Mrs A. M. North | 170 | |||
| Liberal | B. A. Grant | 38 | |||
| Turnout | 17.8% | ||||
| Party | Candidate | Votes | % | ±% | |
|---|---|---|---|---|---|
| Labour | Mrs M. M. Rudlin | 1,299 | |||
| Conservative | L. J. Reilly | 116 | |||
| Communist | R. Cohen | 56 | |||
| Dwarf | C. G. Thomson | 22 | |||
| Liberal | T. W. Keeper | 21 | |||
| Turnout | 20.5% | ||||
| Party | Candidate | Votes | % | ±% | |
|---|---|---|---|---|---|
| Conservative | T. L. Kemp | 1,088 | |||
| Labour | Mrs I. S. Whysall | 437 | |||
| Independent Ratepayers | J. A. Bates | 241 | |||
| Liberal | B. G. Sell | 128 | |||
| Turnout | 17.9% | ||||
| Party | Candidate | Votes | % | ±% | |
|---|---|---|---|---|---|
| Labour | G. F. Cox | 1,249 | |||
| Conservative | Mrs W. L. Whittingham | 860 | |||
| Turnout | 27.1% | ||||
| Party | Candidate | Votes | % | ±% | |
|---|---|---|---|---|---|
| Independent Ratepayers | R. Knell | 1,708 | |||
| Conservative | Mrs M. E. Noyes | 707 | |||
| Labour | S. V. Jack | 633 | |||
| Liberal | A. E. Rabone | 154 | |||
| Turnout | 27.8% | ||||
1974-1978
| Party | Candidate | Votes | % | ±% | |
|---|---|---|---|---|---|
| Labour | Reginald J. Whiting | 1,195 | |||
| Conservative | Stephen G. Brabner | 326 | |||
| Liberal | David J. Ingle | 239 | |||
| Turnout | 25.0 | ||||
| Party | Candidate | Votes | % | ±% | |
|---|---|---|---|---|---|
| Conservative | Leonard J. Trott | 2,118 | |||
| Labour | John P. Scott | 325 | |||
| Liberal | Keith A. Brewington | 251 | |||
| Independent Ratepayers Association | Ian H. Wilkes | 80 | |||
| Turnout | 25.9 | ||||
1978-1982
1982-1986
1986-1990
1990-1994
| Party | Candidate | Votes | % | ±% | |
|---|---|---|---|---|---|
| Labour | Dereck A. Smith | 1,714 | 54.1 | ||
| Liberal Democrats | Terry Hurlestone | 845 | 26.7 | ||
| Conservative | Eric Nicholls | 607 | 19.2 | ||
| Turnout | 39.9 | ||||
| Labour hold | Swing | ||||
The by-election was called following the resignation of Cllr. Sean L. Willis.
| Party | Candidate | Votes | % | ±% | |
|---|---|---|---|---|---|
| Labour | Dennis J. Cook | 982 | 54.2 | ||
| Liberal Democrats | Terry E. Hurlstone | 441 | 24.4 | ||
| Conservative | John C. Nicholls | 388 | 21.4 | ||
| Turnout | 28.1 | ||||
| Labour hold | Swing | ||||
The by-election was called following the resignation of Cllr. Mark A. Flewitt.
| Party | Candidate | Votes | % | ±% | |
|---|---|---|---|---|---|
| Conservative | Marjorie F. Ramsey | 851 | 51.2 | ||
| Residents | Ian H. Wilkes | 427 | 25.7 | ||
| Labour | Francis E. Bland | 365 | 22.0 | ||
| Ind. Conservative | Malcom T. Brace | 18 | 1.1 | ||
| Turnout | 29.2 | ||||
| Conservative hold | Swing | ||||
The by-election was called following the resignation of Cllr. Alice E. Smith.
| Party | Candidate | Votes | % | ±% | |
|---|---|---|---|---|---|
| Residents | Jean H. Mitchell | 1,190 | 62.9 | ||
| Labour | Keith E. Darvill | 490 | 25.9 | ||
| Conservative | Ian M. Woodward | 212 | 11.2 | ||
| Turnout | 33.4 | ||||
| Residents hold | Swing | ||||
The by-election was called following the resignation of Cllr. William A. Remfry.
1994-1998
There were no by-elections. [14]
1998-2002
| Party | Candidate | Votes | % | ±% | |
|---|---|---|---|---|---|
| Conservative | Gordon Scott-Morris | 990 | 58.1 | +12.5 | |
| Havering Residents Association | John F. Shrimpton | 541 | 31.8 | +0.4 | |
| Labour | Leonard W. Street (Jnr) | 138 | 8.1 | -14.9 | |
| Socialist Alliance | Peter J. Alder | 34 | 2.0 | +2.0 | |
| Majority | 449 | 16.3 | |||
| Turnout | 1,703 | 29.0 | |||
| Conservative hold | Swing | ||||
The by-election was called following the death of Cllr. Norman F. Symonds.
| Party | Candidate | Votes | % | ±% | |
|---|---|---|---|---|---|
| Labour | Sean Willis | 582 | 46.2 | -14.4 | |
| Conservative | Edward C. Bates | 240 | 19.0 | -1.5 | |
| Havering Residents Association | Eric J. Staggs | 139 | 11.0 | +11.0 | |
| Independent | Neil R. M. Stanton | 135 | 10.7 | +10.7 | |
| Liberal Democrats | Henry J. Wilson | 91 | 7.2 | +7.2 | |
| UKIP | Terry P. Murray | 74 | 5.9 | +5.9 | |
| Majority | 342 | 27.2 | |||
| Turnout | 1,261 | 15.2 | |||
| Labour hold | Swing | ||||
The by-election was called following the death of Cllr. Ruby M. Latham.
2002-2006
| Party | Candidate | Votes | % | ±% | |
|---|---|---|---|---|---|
| Labour | Harry A. Webb | 771 | 35.3 | +2.3 | |
| Conservative | Maureen M. Carter | 640 | 29.3 | +15.8 | |
| Rainham & Wennington Independent Residents Group | Anthony J. J. Turvey | 491 | 22.5 | -31.1 | |
| Green | David J. Peacock | 127 | 5.8 | +5.8 | |
| National Liberal | David Durrant | 93 | 4.3 | +4.3 | |
| UKIP | Terry P. Murray | 62 | 2.8 | +2.8 | |
| Majority | 131 | 6.0 | |||
| Turnout | 2,184 | 23.6 | |||
| Labour gain from Rainham & Wennington Independent Residents Group | Swing | ||||
The by-election was called following the resignation of Cllr. Brian M. Clarke.
| Party | Candidate | Votes | % | ±% | |
|---|---|---|---|---|---|
| Labour | Anthony J. Ellis | 805 | 31.2 | -4.1 | |
| Conservative | Maureen M. Carter | 776 | 30.1 | +0.8 | |
| BNP | Mark Blunden | 549 | 21.3 | +21.3 | |
| Rainham & Wennington Independent Residents Group | Graham K. Croft | 265 | 10.3 | -12.2 | |
| National Liberal | David W. Durant | 93 | 3.6 | -0.7 | |
| Green | Martin Mannion | 89 | 3.5 | -2.3 | |
| Majority | 29 | 1.1 | |||
| Turnout | 2,577 | 28.5 | |||
| Labour gain from Rainham & Wennington Independent Residents Group | Swing | ||||
The by-election was called following the resignation of Cllr. Wayne A. Redgrave.
2006-2010
| Party | Candidate | Votes | % | ±% | |
|---|---|---|---|---|---|
| Havering Residents Association | Mike Winter | 993 | 32.0 | -3.6 | |
| Conservative | Gary G. Murphy | 583 | 18.8 | -15.7 | |
| BNP | Mark J. Logan | 580 | 18.7 | +18.7 | |
| Labour | Bryan T. Vincent | 511 | 16.5 | +0.7 | |
| National Liberal | David W. Durant | 184 | 5.9 | -0.8 | |
| UKIP | Lawrence J. Webb | 169 | 5.5 | +5.5 | |
| Liberal Democrats | Angela A. Kawa | 80 | 2.6 | +2.6 | |
| Majority | 410 | 13.2 | |||
| Turnout | 3,100 | 29.6 | |||
| Havering Residents Association hold | Swing | ||||
The by-election was called following the resignation of Cllr. Brenda J. Riddle.
| Party | Candidate | Votes | % | ±% | |
|---|---|---|---|---|---|
| Conservative | Lynden A. Thorpe | 1828 | |||
| Havering Residents Association | Denis H. Stevens | 310 | |||
| Labour | Peter J. Mcinerney | 210 | |||
| Liberal | Gregory H. Campbell | 170 | |||
| UKIP | Terry P. Murray | 134 | |||
| Turnout | |||||
| Conservative hold | Swing | ||||
The by-election was called following the death of Cllr. Edward Cahill.
| Party | Candidate | Votes | % | ±% | |
|---|---|---|---|---|---|
| BNP | Mark Logan | 865 | 38.0 | +9.8 | |
| Labour | Yve Cornell | 741 | 32.5 | +6.6 | |
| Conservative | Malcolm G. Fox | 489 | 21.5 | -5.5 | |
| UKIP | Lawrence J. Webb | 70 | 3.1 | -7.6 | |
| Liberal | David W. Durant | 62 | 2.7 | +2.7 | |
| Liberal Democrats | Ian V. Sanderson | 52 | 2.3 | +2.3 | |
| Majority | 124 | 5.5 | |||
| Turnout | 2,279 | 22.6 | |||
| BNP hold | Swing | ||||
The by-election was called following the resignation of Cllr. Alan H. Bailey.
| Party | Candidate | Votes | % | ±% | |
|---|---|---|---|---|---|
| Independent | Michael D. Burton | 661 | 27.0 | +7.9 | |
| BNP | Anthony A. Steff | 518 | 21.2 | +21.2 | |
| Conservative | Christopher P. R. Ryan | 438 | 17.9 | -4.7 | |
| Labour | Graham M. Carr | 416 | 17.0 | -5.9 | |
| South Hornchurch Independent Residents Group | Reg Whitney | 287 | 11.7 | -12.8 | |
| UKIP | Craig J. Litwin | 64 | 2.6 | +2.6 | |
| English Democrat | Dr. Peter Thorogood | 28 | 1.1 | +1.1 | |
| Residents' Association of London | Malvin P. Brown | 17 | 0.7 | -4.5 | |
| Independent | Mark R. Whitehead | 17 | 0.7 | +0.7 | |
| Majority | 143 | 5.8 | |||
| Turnout | 2,446 | 23.8 | |||
| Independent gain from Residents | Swing | ||||
The by-election was called following the death of Cllr. Leonard F. Long.
| Party | Candidate | Votes | % | ±% | |
|---|---|---|---|---|---|
| Havering Residents Association | John C. Wood | 1,413 | 32.0 | ||
| Conservative | Garry L. Pain | 891 | 20.2 | ||
| BNP | Michael Joyce | 771 | 17.5 | ||
| Labour | Graham M. Carr | 455 | 10.3 | ||
| Say No to European Union | Lawrence J. Webb | 433 | 9.8 | ||
| Liberal | David W. Durant | 291 | 6.6 | ||
| Liberal Democrats | Keith I. Taffs | 159 | 3.6 | ||
| Majority | 522 | 11.8 | |||
| Turnout | 4,413 | 42.6 | |||
| Havering Residents Association gain from Conservative | Swing | ||||
The by-election was called following the resignation of Cllr. David G. Charles.
2010-2014
| Party | Candidate | Votes | % | ±% | |
|---|---|---|---|---|---|
| UKIP | Lawrence James Webb | 831 | 38.95 | +24.6 | |
| Labour | Christine Anne McGeary | 569 | 26.67 | -1.8 | |
| Conservative | Marcus Christian Sebastian Llewellyn-Rothschild | 280 | 13.12 | -12.5 | |
| Havering Residents Association | Darren Christopher Wise | 227 | 10.64 | +1.2 | |
| BNP | Micky Braun | 202 | 9.47 | -12.6 | |
| Residents' Association of London | Malvin Paul Brown | 24 | 1.12 | +1.12 | |
| Majority | 262 | 12.28 | |||
| Turnout | 2,133 | 20.5 | |||
| UKIP gain from Conservative | Swing | ||||
The by-election was called following the death of Cllr. Dennis R. Bull.
2014-2018
| Party | Candidate | Votes | % | ±% | |
|---|---|---|---|---|---|
| Labour | Denis O'Flynn | 1,122 | 30.1 | +0.4 | |
| Conservative | Keith Frank Wells | 951 | 25.5 | +6.8 | |
| UKIP | John Thurtle | 864 | 23.3 | -14.9 | |
| Independent | Christopher John Cooper | 515 | 13.8 | +13.8 | |
| Green | Peter Caton | 107 | 2.9 | +2.9 | |
| Liberal Democrats | Jonathan Coles | 86 | 2.3 | +2.3 | |
| BNP | Denise Underwood | 73 | 2.0 | -11.7 | |
| National Front | Kevin Henry Layzell | 14 | 0.4 | +0.4 | |
| Majority | 171 | ||||
| Turnout | |||||
| Labour gain from UKIP | Swing | ||||
The by-election was triggered by the resignation of Councillor Phillip Hyde (Independent, elected as UK Independence Party) [22]
2022-2026
| Party | Candidate | Votes | % | ±% | |
|---|---|---|---|---|---|
| Residents | Jacqueline Ann Williams | 1,642 | |||
| Conservative | Edward Andrew Green | 421 | |||
| Labour | John Gregory Sullivan | 234 | |||
| Independent | David Warren Durant | 150 | |||
| Green | Melanie Jane Collins | 115 | |||
| Liberal Democrats | Thomas Patrick Clark | 35 | |||
| Turnout | |||||
| Majority | |||||
| Residents hold | Swing | ||||
The by-election was called following the death of Cllr. Linda Hawthorn (Havering Residents Association).
References
- ^ "Councillors". Havering London Borough. Archived from the original on 29 December 2009. Retrieved 20 December 2009.
- ^ a b c d "London Borough Council Elections 4 May 1978" (PDF). London Datastore. Greater London Council. Retrieved 25 February 2015.
- ^ "Havering". BBC News Online. Retrieved 20 December 2009.
- ^ a b c d London Borough Council Elections (2002) Archived 2013-08-22 at the Wayback Machine
- ^ "The London Borough of Havering (Electoral Changes) Order 2021". Legislation.gov.uk. Retrieved 11 February 2024.
- ^ London Borough Council Elections (1964) Archived 2013-08-22 at the Wayback Machine
- ^ Alteration of Status of Local Authorities 1993-1994 Archived 2014-02-21 at the Wayback Machine
- ^ London Borough Council Elections (1994) Archived 2013-08-22 at the Wayback Machine
- ^ "The London Borough of Havering (Electoral Changes) Order 2021". gov.uk. 20 September 2021. Retrieved 13 November 2021.
- ^ "London Borough Council Elections 9 May 1968" (PDF). London Datastore. Greater London Council. Retrieved 24 February 2015.
- ^ a b c d e f "London Borough Council Elections 13 May 1971" (PDF). London Datastore. Greater London Council. Retrieved 3 March 2015.
- ^ a b c d e f g "London Borough Council Elections 2 May 1974" (PDF). London Datastore. Greater London Council. Retrieved 25 February 2015.
- ^ a b c d "London Borough Council By-elections May 1990 to May 1994" (PDF). London Datastore. London Research Centre. Retrieved 8 March 2015.
- ^ "London Borough Council Elections 7 May 1998 including the Greater London Authority Referendum results" (PDF). London Datastore. London Research Centre. Retrieved 8 March 2015.
- ^ a b "London Borough Council Elections 4 May 2006" (PDF). London Datastore. Greater London Authority. Retrieved 7 March 2015.
- ^ "St Andrew's Ward By-election June 2007". Havering London Borough. Archived from the original on 8 June 2011. Retrieved 20 December 2009.
- ^ "London Borough Council Elections 6 May 2010" (PDF). London Datastore. Greater London Authority. Retrieved 7 March 2015.
- ^ "Gooshays Ward By-election 2008 results". Havering London Borough. Archived from the original on 8 June 2011. Retrieved 20 December 2009.
- ^ "Result of the South Hornchurch Ward By-election, Thursday 3 July 2008". Havering London Borough. Archived from the original on 23 July 2008. Retrieved 20 December 2009.
- ^ "St Andrew's Ward by-election result". Havering London Borough. Archived from the original on 8 June 2011. Retrieved 20 December 2009.
- ^ "Benefit information for landlords".
- ^ "Labour candidate Denis O'Flynn wins Heaton by-election". 6 May 2016.