
Graph paper, coordinate paper, grid paper, or squared paper is writing paper that is printed with fine lines making up a regular grid. The lines are often used as guides for plotting graphs of functions or experimental data and drawing curves. It is commonly found in mathematics and engineering education settings and in laboratory notebooks. Graph paper is available either as loose leaf paper or bound in notebooks.
History
The Metropolitan Museum of Art owns a pattern book dated to around 1596 in which each page bears a grid printed with a woodblock. The owner has used these grids to create block pictures in black and white and in colour. [1]
The first commercially published "coordinate paper" is usually attributed to a Dr. Buxton of England, who patented paper, printed with a rectangular coordinate grid, in 1794. [2] A century later, E. H. Moore, a distinguished mathematician at the University of Chicago, advocated usage of paper with "squared lines" by students of high schools and universities. [3] The 1906 edition of Algebra for Beginners by H. S. Hall and S. R. Knight included a strong statement that "the squared paper should be of good quality and accurately ruled to inches and tenths of an inch. Experience shows that anything on a smaller scale (such as 'millimeter' paper) is practically worthless in the hands of beginners." [4]
The term "graph paper" did not catch on quickly in American usage. A School Arithmetic (1919) by H. S. Hall and F. H. Stevens had a chapter on graphing with "squared paper". Analytic Geometry (1937) by W. A. Wilson and J. A. Tracey used the phrase "coordinate paper". The term "squared paper" remained in British usage for longer; for example it was used in Public School Arithmetic (2023) by W. M. Baker and A. A. Bourne published in London. [4]
Formats
- Quad paper, sometimes referred to as quadrille paper from French quadrillé, 'large square', [5] is a common form of graph paper with a sparse grid printed in light blue or gray and right to the edge of the paper. In the U.S. and Canada, it often has two, four or five squares per inch for work not needing too much detail. In Europe, it usually has 5 mm by 5 mm squares.
- Dot grid paper uses dots at intersections instead of gridlines. It is often used for bullet journalling.
- Engineering paper, or an Engineer's Pad, [6] is traditionally printed on light green or tan translucent paper. It may have four, five or ten squares per inch. The grid lines are printed on the back side of each page and show through faintly to the front side. Each page has an unprinted margin. When photocopied or scanned, the grid lines typically do not show up in the resulting copy, which often gives the work a neat, uncluttered appearance. In the U.S. and Canada, some engineering professors require student homework to be completed on engineering paper. [6] [7]
- Millimeter paper has ten squares per centimeter and is used for technical drawings.
- Hexagonal paper shows regular hexagons instead of squares. These can be used to map geometric tiled or tesselated designs among other uses.
- Isometric graph paper or 3D graph paper is a triangular graph paper which uses a series of three guidelines forming a 60° grid of small triangles. The triangles are arranged in groups of six to make hexagons. The name suggests the use for isometric views or pseudo-three-dimensional views. Among other functions, they can be used in the design of trianglepoint embroidery. It can be used to draw angles accurately.
- Logarithmic paper has rectangles drawn in varying widths corresponding to logarithmic scales for semi-log plots or log-log plots.
- Normal probability paper is another graph paper with rectangles of variable widths. It is designed so that "the graph of the normal distribution function is represented on it by a straight line", i.e. it can be used for a normal probability plot. [8]
- Polar coordinate paper has concentric circles divided into small arcs or 'pie wedges' to allow plotting in polar coordinates.
- Ternary (Triangular) graph paper has an equilateral triangle, divided into smaller equilateral triangles with usually 10 or more divisions per edge. It is used to plot compositional percentages of in systems that have three constituents or three dimensions. (see ternary plot)
In general, graphs showing grids are sometimes called Cartesian graphs because the square can be used to map measurements onto a Cartesian (x vs. y) coordinate system.
Examples
-
 Regular graphing paper
 -
 Log-log graphing paper
 -
 Semi-log graphing paper
 -
 Normal Probability paper


-
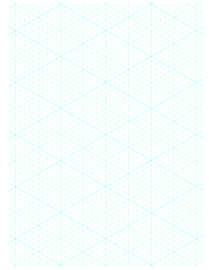 Isometric graphing paper
 -
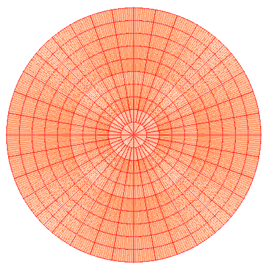 Polar coordinate paper
 -
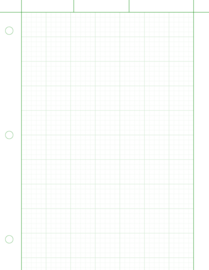 Engineering paper
 -
 Ternary graph paper


-
 Squared exercise book used in Russian schools (12 and 18 sheets)
 -
 Graph composition book used in the United States (80 sheets)
 -
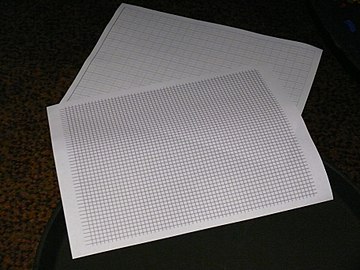 Two styles of loose leaf graph paper


.jpg)
See also
References
- ^ John Boardley, 'The first fashion books, Renaissance pixel fonts & the invention of graph paper', I Love Typography, 27 July 2019.
- ^ Friendly, Michael; Denis, Daniel J. (5 July 2006). "Milestones in the history of thematic cartography, statistical graphics, and data visualization" (PDF). York University. p. 13.
- ^ Borovik, Alexandre (7 August 2008). "Graphed Paper". Mathematics under the Microscope. Retrieved 25 March 2017.
- ^ a b Ballew, Pat (January 2011). "Notes on the History of Graph Paper". www.academia.edu. academia.edu. Retrieved 8 June 2020.
- ^ "quadrille". Oxford Living Dictionaries. Oxford University Press. 2017. Archived from the original on 24 September 2016.
- ^ a b "The Preparation of Engineering Problem Sets" (PDF). Massachusetts Institute of Technology. Technical Communications in Mechanical Engineering. Retrieved 25 March 2017.
- ^ "Required Homework Format" (PDF). Auburn University. Department of Chemical Engineering. Retrieved 25 March 2017.
- ^ Prokhorov, A. V. (2011). "Probability graph paper". Encyclopedia of Mathematics. Retrieved 18 January 2014.
External links
- Graph paper downloads at Print-graph-paper.com
| History |
| ||||||
|---|---|---|---|---|---|---|---|
| Types |
| ||||||
| Materials | |||||||
| Specifications | |||||||
| Manufacture and process | |||||||
| Industry | |||||||
| Uses | |||||||