This article needs additional citations for
verification. (June 2013) |
The Canadian territory of Nunavut covers about 1.9 million square kilometres (733,594 sq. miles) of land and water including part of the mainland, most of the Arctic islands, and all of the islands in Hudson Bay, James Bay, and Ungava Bay (including the Belcher Islands) which belonged to the Northwest Territories. This makes it the fifth largest country subdivision in the world. If Nunavut were a country, it would rank 13th in area, after the Democratic Republic of the Congo. Nunavut has land borders with Manitoba, the Northwest Territories on several islands as well as the mainland, and a tiny land border with Newfoundland and Labrador on Killiniq Island. Additionally, Nunavut has a land border with Greenland on Hans Island.
Physical geography

The mountains on the easternmost coasts of Nunavut are part of the Arctic Cordillera which stretches from northernmost Ellesmere Island to the northernmost tip of Labrador. The highest point is Barbeau Peak which offers some of the world's most spectacular scenery.
Geologically, Nunavut lies on the Canadian Shield, with very thin soil lying on top of the bedrock, and many bare outcrops. The multitude of rivers and lakes in the entire region is caused by the watersheds of the area being so young and in a state of sorting themselves out with the added effect of post-glacial rebound. Virtually all of Nunavut's rivers drain into the Hudson Bay or the Arctic Ocean.
Arctic tundra ( Köppen climate classification ET) covers virtually all of Nunavut, the only exceptions being the area roughly between the Four Corners and Ennadai and Nueltin Lakes, where a marginal taiga forest exists, and small zones of permanent ice caps, found on some of the larger Arctic Islands (especially Baffin, Devon and Ellesmere) at sites having a relatively high elevation. Nunavut's vegetation is partially composed of rare berries, lichens, Arctic Willows, moss, tough grass, and small willow shrubs.
Climate and climate data

Nunavut experiences a polar climate in most regions, owing to its high latitude and lower continental summertime influence than areas to the west. In more southerly continental areas, very cold subarctic climates can be found, due to July being slightly milder than the required 10 °C (50 °F).
| City | July (°C) | July (°F) | January (°C) | January (°F) | ||||
|---|---|---|---|---|---|---|---|---|
| High | Low | High | Low | High | Low | High | Low | |
| Alert [1] | 6 | 1 | 43 | 33 | −29 | −36 | −20 | −33 |
| Baker Lake [2] | 17 | 6 | 63 | 43 | −28 | −35 | −18 | −31 |
| Cambridge Bay [3] | 13 | 5 | 55 | 41 | −29 | −35 | −19 | −32 |
| Eureka [4] | 9 | 3 | 49 | 37 | −33 | −40 | −27 | −40 |
| Iqaluit [5] | 12 | 4 | 54 | 39 | −23 | −31 | −9 | −24 |
| Kugluktuk [6] | 16 | 6 | 60 | 43 | −23 | −31 | −10 | −25 |
| Rankin Inlet [7] | 15 | 6 | 59 | 43 | −27 | −34 | −17 | −30 |
| Climate data for Alert (
Alert Airport) Climate ID: 2400300; coordinates 82°31′04″N 62°16′50″W / 82.51778°N 62.28056°W; elevation: 30.5 m (100 ft); 1981–2010 normals, extremes 1950–present | |||||||||||||
|---|---|---|---|---|---|---|---|---|---|---|---|---|---|
| Month | Jan | Feb | Mar | Apr | May | Jun | Jul | Aug | Sep | Oct | Nov | Dec | Year |
| Record high humidex | 0.0 | 0.0 | −2.4 | −1.1 | 6.6 | 18.1 | 19.4 | 23.8 | 8.4 | 3.9 | −1.1 | 1.4 | 23.8 |
| Record high °C (°F) | 0.0 (32.0) |
1.1 (34.0) |
−2.2 (28.0) |
−0.2 (31.6) |
10.0 (50.0) |
18.8 (65.8) |
21.0 (69.8) |
19.5 (67.1) |
11.2 (52.2) |
5.3 (41.5) |
0.6 (33.1) |
3.2 (37.8) |
21.0 (69.8) |
| Mean daily maximum °C (°F) | −28.6 (−19.5) |
−29.4 (−20.9) |
−28.4 (−19.1) |
−20.4 (−4.7) |
−8.4 (16.9) |
2.0 (35.6) |
6.1 (43.0) |
3.3 (37.9) |
−5.3 (22.5) |
−15.3 (4.5) |
−22.3 (−8.1) |
−25.6 (−14.1) |
−14.4 (6.1) |
| Daily mean °C (°F) | −32.2 (−26.0) |
−33.2 (−27.8) |
−32.4 (−26.3) |
−24.3 (−11.7) |
−11.5 (11.3) |
−0.4 (31.3) |
3.4 (38.1) |
0.8 (33.4) |
−8.4 (16.9) |
−18.9 (−2.0) |
−26.0 (−14.8) |
−29.4 (−20.9) |
−17.7 (0.1) |
| Mean daily minimum °C (°F) | −35.8 (−32.4) |
−37.0 (−34.6) |
−36.3 (−33.3) |
−28.1 (−18.6) |
−14.5 (5.9) |
−2.7 (27.1) |
0.7 (33.3) |
−1.8 (28.8) |
−11.5 (11.3) |
−22.4 (−8.3) |
−29.6 (−21.3) |
−33.1 (−27.6) |
−21.0 (−5.8) |
| Record low °C (°F) | −48.9 (−56.0) |
−50.0 (−58.0) |
−49.4 (−56.9) |
−45.6 (−50.1) |
−29.0 (−20.2) |
−14.3 (6.3) |
−6.3 (20.7) |
−15.0 (5.0) |
−28.2 (−18.8) |
−39.4 (−38.9) |
−43.5 (−46.3) |
−46.1 (−51.0) |
−50.0 (−58.0) |
| Record low wind chill | −64.7 | −60.5 | −59.5 | −56.8 | −40.8 | −21.1 | −10.3 | −19.2 | −36.9 | −49.4 | −53.7 | −57.3 | −64.7 |
| Average precipitation mm (inches) | 7.2 (0.28) |
7.0 (0.28) |
7.5 (0.30) |
10.6 (0.42) |
11.6 (0.46) |
12.0 (0.47) |
31.8 (1.25) |
17.9 (0.70) |
22.3 (0.88) |
13.4 (0.53) |
10.4 (0.41) |
6.8 (0.27) |
158.3 (6.23) |
| Average rainfall mm (inches) | 0.0 (0.0) |
0.0 (0.0) |
0.0 (0.0) |
0.0 (0.0) |
0.0 (0.0) |
0.8 (0.03) |
13.0 (0.51) |
3.5 (0.14) |
0.1 (0.00) |
0.0 (0.0) |
0.0 (0.0) |
0.0 (0.0) |
17.4 (0.69) |
| Average snowfall cm (inches) | 9.0 (3.5) |
8.1 (3.2) |
8.7 (3.4) |
12.6 (5.0) |
18.0 (7.1) |
13.5 (5.3) |
20.0 (7.9) |
16.9 (6.7) |
33.1 (13.0) |
20.2 (8.0) |
15.2 (6.0) |
9.3 (3.7) |
184.6 (72.7) |
| Average precipitation days (≥ 0.2 mm) | 9.0 | 7.7 | 7.3 | 8.5 | 7.5 | 7.4 | 10.9 | 9.2 | 10.1 | 10.5 | 8.7 | 9.2 | 106.1 |
| Average rainy days (≥ 0.2 mm) | 0.0 | 0.0 | 0.0 | 0.0 | 0.1 | 1.0 | 6.9 | 2.5 | 0.2 | 0.0 | 0.0 | 0.0 | 10.6 |
| Average snowy days (≥ 0.2 cm) | 9.1 | 8.6 | 8.3 | 9.1 | 9.4 | 6.9 | 6.3 | 7.4 | 11.3 | 12.2 | 9.7 | 9.9 | 108.0 |
| Average relative humidity (%) | 66.8 | 66.6 | 66.9 | 71.1 | 81.5 | 87.1 | 85.1 | 86.1 | 84.6 | 75.7 | 70.3 | 67.2 | 75.8 |
| Mean monthly sunshine hours | 0.0 | 0.0 | 110.4 | 323.6 | 428.6 | 333.0 | 321.6 | 269.1 | 111.4 | 3.9 | 0.0 | 0.0 | 1,901.6 |
| Percent possible sunshine | — | — | 33.1 | 46.8 | 57.6 | 46.3 | 43.2 | 36.2 | 21.9 | 4.1 | — | — | 36.1 |
| Source: Environment and Climate Change Canada [1] [8] [9] [10] [11] [12] | |||||||||||||
| Climate data for Iqaluit (
Iqaluit Airport) WMO ID: 71909; coordinates 63°45′N 68°33′W / 63.750°N 68.550°W; elevation: 33.5 m (110 ft); 1991–2020 normals, extremes 1946–present | |||||||||||||
|---|---|---|---|---|---|---|---|---|---|---|---|---|---|
| Month | Jan | Feb | Mar | Apr | May | Jun | Jul | Aug | Sep | Oct | Nov | Dec | Year |
| Record high humidex | 3.3 | 5.2 | 4.3 | 6.8 | 13.3 | 21.7 | 27.8 | 27.6 | 18.8 | 8.6 | 4.8 | 3.4 | 27.8 |
| Record high °C (°F) | 3.9 (39.0) |
5.7 (42.3) |
4.2 (39.6) |
7.2 (45.0) |
13.3 (55.9) |
22.7 (72.9) |
26.8 (80.2) |
25.5 (77.9) |
18.4 (65.1) |
9.1 (48.4) |
5.6 (42.1) |
3.8 (38.8) |
26.8 (80.2) |
| Mean daily maximum °C (°F) | −22.0 (−7.6) |
−22.9 (−9.2) |
−17.6 (0.3) |
−8.9 (16.0) |
−0.3 (31.5) |
7.0 (44.6) |
12.0 (53.6) |
11.1 (52.0) |
5.6 (42.1) |
−0.5 (31.1) |
−7.5 (18.5) |
−14.7 (5.5) |
−4.9 (23.2) |
| Daily mean °C (°F) | −26.0 (−14.8) |
−27.0 (−16.6) |
−22.4 (−8.3) |
−13.5 (7.7) |
−3.2 (26.2) |
3.9 (39.0) |
8.1 (46.6) |
7.5 (45.5) |
2.9 (37.2) |
−3.2 (26.2) |
−11.1 (12.0) |
−18.9 (−2.0) |
−8.6 (16.5) |
| Mean daily minimum °C (°F) | −29.9 (−21.8) |
−31.0 (−23.8) |
−27.2 (−17.0) |
−18.1 (−0.6) |
−6.1 (21.0) |
0.7 (33.3) |
4.2 (39.6) |
3.8 (38.8) |
0.2 (32.4) |
−5.8 (21.6) |
−14.7 (5.5) |
−23.0 (−9.4) |
−12.2 (10.0) |
| Record low °C (°F) | −45.0 (−49.0) |
−45.6 (−50.1) |
−44.7 (−48.5) |
−34.2 (−29.6) |
−26.1 (−15.0) |
−10.2 (13.6) |
−2.8 (27.0) |
−2.5 (27.5) |
−12.8 (9.0) |
−27.1 (−16.8) |
−36.2 (−33.2) |
−43.4 (−46.1) |
−45.6 (−50.1) |
| Record low wind chill | −65.4 | −65.6 | −62.1 | −53.1 | −36.0 | −18.8 | −7.2 | −8.6 | −18.6 | −42.9 | −56.8 | −60.1 | −65.6 |
| Average precipitation mm (inches) | 16.3 (0.64) |
14.0 (0.55) |
21.4 (0.84) |
22.7 (0.89) |
21.0 (0.83) |
48.7 (1.92) |
39.8 (1.57) |
61.7 (2.43) |
50.8 (2.00) |
30.2 (1.19) |
18.5 (0.73) |
16.2 (0.64) |
361.2 (14.22) |
| Average rainfall mm (inches) | 0.4 (0.02) |
0.1 (0.00) |
0.0 (0.0) |
0.0 (0.0) |
3.3 (0.13) |
46.1 (1.81) |
44.4 (1.75) |
65.5 (2.58) |
43.9 (1.73) |
12.3 (0.48) |
0.7 (0.03) |
0.0 (0.0) |
216.6 (8.53) |
| Average snowfall cm (inches) | 19.4 (7.6) |
15.1 (5.9) |
20.6 (8.1) |
23.8 (9.4) |
23.0 (9.1) |
3.8 (1.5) |
0.0 (0.0) |
0.1 (0.0) |
8.5 (3.3) |
21.1 (8.3) |
25.9 (10.2) |
28.8 (11.3) |
190.0 (74.8) |
| Average precipitation days (≥ 0.2 mm) | 12.1 | 10.7 | 12.4 | 12.8 | 10.6 | 12.3 | 12.4 | 14.3 | 15.7 | 13.2 | 12.5 | 12.8 | 151.5 |
| Average rainy days (≥ 0.2 mm) | 0.06 | 0.06 | 0.06 | 0.06 | 1.7 | 10.7 | 13.1 | 14.8 | 13.2 | 3.8 | 0.24 | 0.0 | 57.7 |
| Average snowy days (≥ 0.2 cm) | 10.1 | 8.8 | 8.7 | 9.6 | 8.7 | 2.1 | 0.06 | 0.12 | 3.7 | 9.8 | 11.9 | 12.7 | 86.3 |
| Average relative humidity (%) (at 3pm) | 68.1 | 67.6 | 68.9 | 74.6 | 77.3 | 74.6 | 72.9 | 73.5 | 75.2 | 78.7 | 78.4 | 74.3 | 73.7 |
| Mean monthly sunshine hours | 32.4 | 94.0 | 172.2 | 216.5 | 180.5 | 200.2 | 236.8 | 156.8 | 87.9 | 51.4 | 35.6 | 12.6 | 1,476.8 |
| Percent possible sunshine | 18.5 | 39.0 | 47.4 | 48.2 | 31.9 | 32.5 | 39.3 | 31.0 | 22.4 | 16.8 | 17.7 | 8.9 | 29.5 |
| Average ultraviolet index | 0 | 0 | 1 | 2 | 4 | 4 | 4 | 3 | 2 | 1 | 0 | 0 | 2 |
| Source 1: Environment and Climate Change Canada [13] (Bright Sunshine 1981–2010) [5] | |||||||||||||
| Source 2: Weather Atlas [14] | |||||||||||||
| Climate data for Cambridge Bay (
Cambridge Bay Airport) WMO ID: 71925; coordinates 69°06′29″N 105°08′18″W / 69.10806°N 105.13833°W; elevation: 31.1 m (102 ft); 1991–2020 normals | |||||||||||||
|---|---|---|---|---|---|---|---|---|---|---|---|---|---|
| Month | Jan | Feb | Mar | Apr | May | Jun | Jul | Aug | Sep | Oct | Nov | Dec | Year |
| Record high humidex | −5.0 | −9.7 | −4.1 | 3.9 | 10.5 | 25.3 | 30.8 | 28.6 | 16.3 | 5.8 | −1.4 | −3.5 | 30.8 |
| Record high °C (°F) | −4.9 (23.2) |
−9.4 (15.1) |
−4.0 (24.8) |
6.1 (43.0) |
11.5 (52.7) |
23.3 (73.9) |
28.9 (84.0) |
26.1 (79.0) |
16.4 (61.5) |
6.9 (44.4) |
0.0 (32.0) |
−3.4 (25.9) |
28.9 (84.0) |
| Mean daily maximum °C (°F) | −27.7 (−17.9) |
−28.6 (−19.5) |
−24.9 (−12.8) |
−16.2 (2.8) |
−5.2 (22.6) |
6.0 (42.8) |
13.3 (55.9) |
10.3 (50.5) |
2.6 (36.7) |
−6.6 (20.1) |
−17.5 (0.5) |
−24.3 (−11.7) |
−9.9 (14.2) |
| Daily mean °C (°F) | −31.2 (−24.2) |
−32.1 (−25.8) |
−28.8 (−19.8) |
−20.7 (−5.3) |
−8.9 (16.0) |
3.0 (37.4) |
9.4 (48.9) |
7.4 (45.3) |
0.5 (32.9) |
−9.5 (14.9) |
−21.1 (−6.0) |
−27.8 (−18.0) |
−13.3 (8.1) |
| Mean daily minimum °C (°F) | −34.6 (−30.3) |
−35.6 (−32.1) |
−32.7 (−26.9) |
−25.1 (−13.2) |
−12.6 (9.3) |
0.0 (32.0) |
5.4 (41.7) |
4.3 (39.7) |
−1.7 (28.9) |
−12.3 (9.9) |
−24.7 (−12.5) |
−31.3 (−24.3) |
−16.7 (1.9) |
| Record low °C (°F) | −52.8 (−63.0) |
−50.6 (−59.1) |
−48.3 (−54.9) |
−42.8 (−45.0) |
−35.0 (−31.0) |
−17.8 (0.0) |
−8.2 (17.2) |
−8.9 (16.0) |
−17.2 (1.0) |
−33.0 (−27.4) |
−43.9 (−47.0) |
−49.4 (−56.9) |
−52.8 (−63.0) |
| Record low wind chill | −73.4 | −72.6 | −69.8 | −60.1 | −43.2 | −29.2 | −7.9 | −13.1 | −28.6 | −49.4 | −60.7 | −66.3 | −73.4 |
| Average precipitation mm (inches) | 5.6 (0.22) |
5.9 (0.23) |
9.2 (0.36) |
6.9 (0.27) |
6.7 (0.26) |
16.4 (0.65) |
28.0 (1.10) |
23.5 (0.93) |
18.4 (0.72) |
14.8 (0.58) |
8.9 (0.35) |
6.2 (0.24) |
150.4 (5.92) |
| Average rainfall mm (inches) | 0.0 (0.0) |
0.0 (0.0) |
0.0 (0.0) |
0.0 (0.0) |
1.0 (0.04) |
10.0 (0.39) |
23.9 (0.94) |
23.9 (0.94) |
12.7 (0.50) |
0.6 (0.02) |
0.0 (0.0) |
0.0 (0.0) |
72.1 (2.84) |
| Average snowfall cm (inches) | 6.7 (2.6) |
5.9 (2.3) |
8.4 (3.3) |
6.9 (2.7) |
7.2 (2.8) |
3.8 (1.5) |
0.1 (0.0) |
1.8 (0.7) |
6.8 (2.7) |
15.9 (6.3) |
9.8 (3.9) |
6.8 (2.7) |
80.2 (31.6) |
| Average precipitation days (≥ 0.2 mm) | 8.4 | 7.5 | 11.7 | 7.9 | 6.9 | 9.4 | 11.1 | 12.3 | 12.0 | 13.8 | 10.8 | 8.6 | 120.5 |
| Average rainy days (≥ 0.2 mm) | 0.0 | 0.0 | 0.0 | 0.0 | 0.9 | 5.9 | 10.7 | 12.5 | 7.1 | 0.6 | 0.0 | 0.0 | 37.8 |
| Average snowy days (≥ 0.2 cm) | 7.4 | 6.9 | 9.8 | 7.1 | 7.3 | 3.4 | 0.1 | 1.2 | 6.3 | 12.5 | 9.5 | 8.3 | 79.8 |
| Average relative humidity (%) | 65.3 | 66.4 | 70.5 | 76.2 | 83.8 | 77.2 | 68.2 | 73.6 | 82.3 | 86.2 | 76.5 | 70.0 | 74.7 |
| Mean monthly sunshine hours | 7.3 | 73.7 | 169.6 | 275.9 | 245.1 | 291.6 | 333.8 | 186.6 | 71.7 | 56.8 | 17.6 | 0.0 | 1,729.7 |
| Percent possible sunshine | 11.7 | 35.4 | 47.1 | 57.7 | 36.6 | 40.5 | 45.9 | 33.6 | 17.8 | 20.0 | 13.5 | 0.0 | 30.0 |
| Source: Environment and Climate Change Canada [15] (rain/rain days, snow/snow days, humidex, wind chill, humidity 1981–2010) [3] | |||||||||||||
| Climate data for Eureka (
Eureka Aerodrome) WMO ID: 71917; coordinates 79°59′N 85°56′W / 79.983°N 85.933°W; elevation: 10.4 m (34 ft); 1991–2020 normals, extremes 1947–present | |||||||||||||
|---|---|---|---|---|---|---|---|---|---|---|---|---|---|
| Month | Jan | Feb | Mar | Apr | May | Jun | Jul | Aug | Sep | Oct | Nov | Dec | Year |
| Record high °C (°F) | −1.1 (30.0) |
−1.1 (30.0) |
−8.0 (17.6) |
−2.8 (27.0) |
7.5 (45.5) |
18.5 (65.3) |
20.9 (69.6) |
17.6 (63.7) |
9.3 (48.7) |
5.0 (41.0) |
−1.7 (28.9) |
−2.1 (28.2) |
20.9 (69.6) |
| Mean daily maximum °C (°F) | −32.3 (−26.1) |
−33.0 (−27.4) |
−32.3 (−26.1) |
−21.9 (−7.4) |
−6.7 (19.9) |
5.8 (42.4) |
10.1 (50.2) |
5.7 (42.3) |
−3.3 (26.1) |
−15.9 (3.4) |
−24.3 (−11.7) |
−29.2 (−20.6) |
−14.8 (5.4) |
| Daily mean °C (°F) | −35.9 (−32.6) |
−36.8 (−34.2) |
−35.9 (−32.6) |
−25.9 (−14.6) |
−9.9 (14.2) |
3.1 (37.6) |
6.8 (44.2) |
3.4 (38.1) |
−5.8 (21.6) |
−19.5 (−3.1) |
−28.0 (−18.4) |
−32.8 (−27.0) |
−18.1 (−0.6) |
| Mean daily minimum °C (°F) | −39.5 (−39.1) |
−40.5 (−40.9) |
−39.4 (−38.9) |
−29.8 (−21.6) |
−13.1 (8.4) |
0.5 (32.9) |
3.5 (38.3) |
1.2 (34.2) |
−8.2 (17.2) |
−23.1 (−9.6) |
−31.6 (−24.9) |
−36.3 (−33.3) |
−21.4 (−6.5) |
| Record low °C (°F) | −53.3 (−63.9) |
−55.3 (−67.5) |
−52.8 (−63.0) |
−48.9 (−56.0) |
−31.1 (−24.0) |
−13.9 (7.0) |
−2.2 (28.0) |
−12.9 (8.8) |
−31.7 (−25.1) |
−41.7 (−43.1) |
−48.2 (−54.8) |
−51.7 (−61.1) |
−55.3 (−67.5) |
| Average precipitation mm (inches) | 2.6 (0.10) |
2.6 (0.10) |
2.6 (0.10) |
3.6 (0.14) |
3.3 (0.13) |
8.6 (0.34) |
14.4 (0.57) |
17.9 (0.70) |
8.2 (0.32) |
6.6 (0.26) |
3.7 (0.15) |
3.5 (0.14) |
77.6 (3.06) |
| Average rainfall mm (inches) | 0.0 (0.0) |
0.0 (0.0) |
0.0 (0.0) |
0.0 (0.0) |
0.0 (0.0) |
5.3 (0.21) |
14.5 (0.57) |
11.7 (0.46) |
1.0 (0.04) |
0.0 (0.0) |
0.0 (0.0) |
0.0 (0.0) |
32.5 (1.28) |
| Average snowfall cm (inches) | 3.1 (1.2) |
3.9 (1.5) |
2.8 (1.1) |
4.6 (1.8) |
4.2 (1.7) |
3.0 (1.2) |
0.7 (0.3) |
4.8 (1.9) |
11.3 (4.4) |
10.9 (4.3) |
5.7 (2.2) |
5.4 (2.1) |
60.3 (23.7) |
| Average precipitation days (≥ 0.2 mm) | 4.4 | 4.4 | 5.3 | 4.9 | 3.9 | 5.2 | 7.8 | 7.9 | 6.8 | 8.6 | 5.9 | 5.4 | 70.6 |
| Average rainy days (≥ 0.2 mm) | 0.0 | 0.0 | 0.0 | 0.0 | 0.0 | 3.1 | 7.7 | 5.9 | 0.6 | 0.0 | 0.0 | 0.0 | 17.3 |
| Average snowy days (≥ 0.2 cm) | 4.7 | 4.7 | 4.2 | 5.2 | 4.0 | 2.4 | 0.7 | 2.9 | 7.9 | 9.6 | 6.0 | 5.0 | 57.4 |
| Average relative humidity (%) | 63.4 | 66.3 | 65.8 | 67.2 | 75.0 | 71.1 | 69.3 | 76.2 | 82.0 | 74.3 | 65.8 | 64.6 | 70.1 |
| Mean monthly sunshine hours | 0.0 | 0.0 | 120.2 | 353.8 | 486.3 | 386.4 | 360.5 | 238.9 | 98.4 | 12.5 | 0.0 | 0.0 | 2,057 |
| Percent possible sunshine | 0.0 | 0.0 | 34.9 | 54.5 | 65.4 | 53.7 | 48.5 | 32.2 | 21.4 | 8.4 | 0.0 | 0.0 | 39.9 |
| Source: Environment and Climate Change Canada [4] [16] [17] [18] [19] | |||||||||||||
| Climate data for Kugluktuk (
Kugluktuk Airport) WMO ID: 71938; coordinates 67°49′00″N 115°08′38″W / 67.81667°N 115.14389°W; elevation: 22.6 m (74 ft); 1991–2020 normals, extremes 1930–present [a] | |||||||||||||
|---|---|---|---|---|---|---|---|---|---|---|---|---|---|
| Month | Jan | Feb | Mar | Apr | May | Jun | Jul | Aug | Sep | Oct | Nov | Dec | Year |
| Record high humidex | 0.3 | −1.7 | −0.3 | 8.9 | 19.8 | 30.3 | 36.8 | 36.8 | 25.8 | 13.1 | 2.2 | −1.5 | 36.8 |
| Record high °C (°F) | 0.8 (33.4) |
1.1 (34.0) |
−0.1 (31.8) |
9.8 (49.6) |
23.3 (73.9) |
32.5 (90.5) |
34.9 (94.8) |
30.3 (86.5) |
26.1 (79.0) |
13.9 (57.0) |
4.4 (39.9) |
4.4 (39.9) |
34.9 (94.8) |
| Mean daily maximum °C (°F) | −22.5 (−8.5) |
−22.8 (−9.0) |
−20.1 (−4.2) |
−11.6 (11.1) |
−0.6 (30.9) |
10.4 (50.7) |
15.8 (60.4) |
13.7 (56.7) |
6.8 (44.2) |
−2.9 (26.8) |
−13.2 (8.2) |
−20.1 (−4.2) |
−5.6 (21.9) |
| Daily mean °C (°F) | −26.6 (−15.9) |
−27.0 (−16.6) |
−24.6 (−12.3) |
−16.4 (2.5) |
−4.5 (23.9) |
5.9 (42.6) |
11.2 (52.2) |
9.6 (49.3) |
3.6 (38.5) |
−5.9 (21.4) |
−17.1 (1.2) |
−24.1 (−11.4) |
−9.7 (14.5) |
| Mean daily minimum °C (°F) | −30.7 (−23.3) |
−31.3 (−24.3) |
−29.1 (−20.4) |
−21.2 (−6.2) |
−8.5 (16.7) |
1.4 (34.5) |
6.5 (43.7) |
5.4 (41.7) |
0.3 (32.5) |
−9.0 (15.8) |
−21.0 (−5.8) |
−28.1 (−18.6) |
−13.8 (7.2) |
| Record low °C (°F) | −47.8 (−54.0) |
−50.0 (−58.0) |
−48.9 (−56.0) |
−43.9 (−47.0) |
−31.1 (−24.0) |
−15.0 (5.0) |
−0.8 (30.6) |
−4.4 (24.1) |
−20.0 (−4.0) |
−35.4 (−31.7) |
−41.1 (−42.0) |
−45.0 (−49.0) |
−50.0 (−58.0) |
| Record low wind chill | −64.3 | −64.4 | −65.0 | −54.4 | −39.7 | −15.6 | −5.9 | −11.8 | −22.9 | −46.5 | −54.1 | −61.5 | −65.0 |
| Average precipitation mm (inches) | 9.2 (0.36) |
7.0 (0.28) |
9.3 (0.37) |
7.9 (0.31) |
14.5 (0.57) |
17.4 (0.69) |
45.2 (1.78) |
42.3 (1.67) |
35.5 (1.40) |
23.3 (0.92) |
10.9 (0.43) |
10.6 (0.42) |
233.1 (9.18) |
| Average rainfall mm (inches) | 0.1 (0.00) |
0.0 (0.0) |
0.0 (0.0) |
0.1 (0.00) |
4.3 (0.17) |
14.6 (0.57) |
44.4 (1.75) |
44.9 (1.77) |
31.4 (1.24) |
4.7 (0.19) |
0.0 (0.0) |
0.0 (0.0) |
144.5 (5.69) |
| Average snowfall cm (inches) | 19.6 (7.7) |
16.3 (6.4) |
19.4 (7.6) |
18.2 (7.2) |
16.2 (6.4) |
2.1 (0.8) |
0.0 (0.0) |
0.2 (0.1) |
7.7 (3.0) |
35.0 (13.8) |
25.5 (10.0) |
21.9 (8.6) |
182.1 (71.7) |
| Average precipitation days (≥ 0.2 mm) | 9.7 | 8.7 | 10.1 | 7.7 | 8.5 | 8.3 | 11.8 | 13.0 | 13.0 | 14.5 | 10.6 | 10.3 | 126.2 |
| Average rainy days (≥ 0.2 mm) | 0.0 | 0.0 | 0.0 | 0.2 | 1.9 | 6.8 | 11.5 | 13.1 | 10.5 | 2.3 | 0.0 | 0.0 | 46.4 |
| Average snowy days (≥ 0.2 cm) | 10.5 | 10.1 | 11.6 | 9.5 | 7.2 | 1.3 | 0.1 | 0.2 | 3.7 | 14.5 | 13.4 | 11.6 | 93.6 |
| Average relative humidity (%) (at 1500 LST) | 76.7 | 75.1 | 77.5 | 82.3 | 83.1 | 70.2 | 64.8 | 69.8 | 75.5 | 84.7 | 80.9 | 77.8 | 76.5 |
| Average dew point °C (°F) | −30.6 (−23.1) |
−31.3 (−24.3) |
−30.2 (−22.4) |
−20.8 (−5.4) |
−7.5 (18.5) |
0.8 (33.4) |
5.5 (41.9) |
4.6 (40.3) |
−0.3 (31.5) |
−8.3 (17.1) |
−21.5 (−6.7) |
−29.7 (−21.5) |
−14.1 (6.6) |
| Mean monthly sunshine hours | 17.8 | 77.3 | 160.3 | 233.3 | 246.7 | 375.0 | 341.6 | 207.7 | 91.1 | 51.2 | 19.6 | 0.2 | 1,821.7 |
| Percent possible sunshine | 17.7 | 35.5 | 44.4 | 49.6 | 38.7 | 52.1 | 48.5 | 38.5 | 22.8 | 17.6 | 12.7 | 0.7 | 31.6 |
| Source: Environment and Climate Change Canada [20] (rain/rain days, snow/snow days, humidex, wind chill, humidity 1981–2010) Canadian Climate Normals 1981–2010 [6] [21] [22] (dew point 1951–1980) | |||||||||||||
| Climate data for Rankin Inlet (
Rankin Inlet Airport) WMO ID: 71083; coordinates 62°49′N 92°07′W / 62.817°N 92.117°W; elevation: 32.3 m (106 ft); 1981–2010 normals | |||||||||||||
|---|---|---|---|---|---|---|---|---|---|---|---|---|---|
| Month | Jan | Feb | Mar | Apr | May | Jun | Jul | Aug | Sep | Oct | Nov | Dec | Year |
| Record high humidex | −3.0 | −4.4 | 1.1 | 2.5 | 13.4 | 26.3 | 32.2 | 31.8 | 21.8 | 11.7 | 1.4 | 0.8 | 32.2 |
| Record high °C (°F) | −2.5 (27.5) |
−4.4 (24.1) |
1.3 (34.3) |
3.4 (38.1) |
14.1 (57.4) |
26.1 (79.0) |
28.9 (84.0) |
30.5 (86.9) |
20.6 (69.1) |
11.8 (53.2) |
1.5 (34.7) |
0.9 (33.6) |
30.5 (86.9) |
| Mean daily maximum °C (°F) | −27.3 (−17.1) |
−26.1 (−15.0) |
−20.6 (−5.1) |
−11.1 (12.0) |
−2.4 (27.7) |
7.9 (46.2) |
14.9 (58.8) |
13.1 (55.6) |
6.3 (43.3) |
−1.9 (28.6) |
−13.0 (8.6) |
−21.9 (−7.4) |
−6.9 (19.6) |
| Daily mean °C (°F) | −30.8 (−23.4) |
−29.9 (−21.8) |
−25.0 (−13.0) |
−15.6 (3.9) |
−5.8 (21.6) |
4.2 (39.6) |
10.5 (50.9) |
9.7 (49.5) |
3.8 (38.8) |
−4.6 (23.7) |
−17.0 (1.4) |
−25.7 (−14.3) |
−10.5 (13.1) |
| Mean daily minimum °C (°F) | −34.4 (−29.9) |
−33.6 (−28.5) |
−29.2 (−20.6) |
−20.1 (−4.2) |
−9.0 (15.8) |
0.5 (32.9) |
6.1 (43.0) |
6.2 (43.2) |
1.3 (34.3) |
−7.3 (18.9) |
−20.9 (−5.6) |
−29.4 (−20.9) |
−14.2 (6.4) |
| Record low °C (°F) | −46.1 (−51.0) |
−49.8 (−57.6) |
−43.4 (−46.1) |
−35.7 (−32.3) |
−23.8 (−10.8) |
−9.4 (15.1) |
−1.9 (28.6) |
−1.4 (29.5) |
−9.0 (15.8) |
−27.4 (−17.3) |
−36.5 (−33.7) |
−43.6 (−46.5) |
−49.8 (−57.6) |
| Record low wind chill | −66.8 | −70.5 | −64.4 | −53.6 | −35.9 | −17.6 | −5.3 | −8.8 | −18.1 | −42.7 | −55.3 | −62.4 | −70.5 |
| Average precipitation mm (inches) | 8.7 (0.34) |
8.2 (0.32) |
12.3 (0.48) |
19.9 (0.78) |
19.5 (0.77) |
26.6 (1.05) |
42.0 (1.65) |
57.4 (2.26) |
42.9 (1.69) |
38.0 (1.50) |
21.7 (0.85) |
12.8 (0.50) |
310.1 (12.21) |
| Average rainfall mm (inches) | 0.0 (0.0) |
0.0 (0.0) |
0.0 (0.0) |
1.1 (0.04) |
7.0 (0.28) |
22.1 (0.87) |
41.9 (1.65) |
57.2 (2.25) |
39.1 (1.54) |
12.9 (0.51) |
0.3 (0.01) |
0.1 (0.00) |
181.8 (7.16) |
| Average snowfall cm (inches) | 8.9 (3.5) |
8.5 (3.3) |
12.5 (4.9) |
19.2 (7.6) |
13.0 (5.1) |
4.6 (1.8) |
0.1 (0.0) |
0.2 (0.1) |
3.8 (1.5) |
25.5 (10.0) |
22.4 (8.8) |
13.3 (5.2) |
131.9 (51.9) |
| Average precipitation days (≥ 0.2 mm) | 7.8 | 6.6 | 9.0 | 8.5 | 8.7 | 7.7 | 10.4 | 13.2 | 12.7 | 14.9 | 12.6 | 10.0 | 122.1 |
| Average rainy days (≥ 0.2 mm) | 0.0 | 0.0 | 0.0 | 0.7 | 2.3 | 6.3 | 10.4 | 13.2 | 10.5 | 4.2 | 0.4 | 0.1 | 48.4 |
| Average snowy days (≥ 0.2 cm) | 7.8 | 6.7 | 9.0 | 8.2 | 7.1 | 2.0 | 0.1 | 0.1 | 3.3 | 12.4 | 12.5 | 10.0 | 79.3 |
| Average relative humidity (%) | 66.2 | 67.3 | 71.3 | 79.0 | 82.3 | 72.3 | 66.6 | 70.6 | 76.3 | 84.5 | 78.4 | 70.2 | 73.7 |
| Source: Environment and Climate Change Canada Canadian Climate Normals 1981–2010 [7] | |||||||||||||
- Notes:
- ^ Climate data was recorded at Coppermine from October 1930 to November 1977 and at Kugluktuk Airport from December 1977 to present.
Demographics
As of 2012 [update], Nunavut has a population of approximately 34,000. [23] In 2006 around 84% of the population were native peoples, primarily Inuit. [24] Nunavut's small and sparse population makes it unlikely the territory will be granted provincial status in the foreseeable future, although this may change if the Yukon, which is only marginally more populous, becomes a province.
| Municipality | 2001 | 1999 |
|---|---|---|
| Iqaluit | 5,236 | 4,220 |
| Rankin Inlet | 2,177 | 2,058 |
| Arviat | 1,899 | 1,559 |
| Baker Lake | 1,507 | 1,385 |
| Cambridge Bay | 1,309 | 1,351 |
| Igloolik | 1,286 | 1,174 |
| Pangnirtung | 1,276 | 1,243 |
| Pond Inlet | 1,220 | 1,154 |
| Kugluktuk | 1,212 | 1,201 |
| Cape Dorset | 1,148 | 1,118 |
Gallery
-
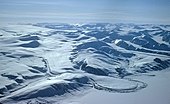 A glacier on southern
Axel Heiberg Island -
 Flora near Grise Fiord
 -
 Beechey Island harbour
 -
 Rapids above Bloody Falls, Kugluk Territorial Park
 -

-


_-1.jpg)


_on_MS_Ocean_Endeavour,_September_2019_04.jpg)
References
- ^ a b "Alert". Canadian Climate Normals 1981-2010 Station Data. Environment and Climate Change Canada. 31 October 2011. Climate ID: 2400300. Retrieved 13 January 2016.
- ^ "Baker Lake A". Canadian Climate Normals 1981–2010. Environment Canada. 25 September 2013. Climate ID: 2300500. Retrieved 19 October 2020.
- ^ a b "Cambridge Bay A *". Canadian Climate Normals 1981–2010. Environment and Climate Change Canada. Climate ID: 2400600. Archived from the original on 30 September 2023. Retrieved 30 April 2014.
- ^ a b "Eureka A". Canadian Climate Normals 1981–2010. Environment and Climate Change Canada. Retrieved 12 May 2016.
- ^ a b "Iqaluit A". Canadian Climate Normals 1981–2010. Environment and Climate Change Canada. 31 October 2011. Climate ID: 2402590. Archived from the original on 16 May 2017. Retrieved 24 February 2014.
- ^ a b "Kugluktuk A *". Canadian Climate Normals 1981–2010. Environment and Climate Change Canada. Climate ID: 2300902. Retrieved 30 April 2014.
- ^ a b "Rankin Inlet A". Canadian Climate Normals 1981–2010. Environment and Climate Change Canada. Climate ID: 2303401. Retrieved 19 October 2020.
- ^ "Daily Data Report for October 2006". Canadian Climate Data. Environment and Climate Change Canada. 31 October 2011. Retrieved 12 May 2016.
- ^ "Daily Data Report for June 2009". Canadian Climate Data. Environment and Climate Change Canada. 31 October 2011. Retrieved 12 May 2016.
- ^ "Daily Data Report for May 2012". Canadian Climate Data. Environment and Climate Change Canada. 31 October 2011. Retrieved 12 May 2016.
- ^ "Daily Data Report for July 2019". Canadian Climate Data. Environment and Climate Change Canada. 31 October 2011. Retrieved 17 July 2019.
- ^ "Daily Data Report for June 2020 - Climate - Environment and Climate Change Canada". climate.weather.gc.ca. Environment and Climate Change Canada. 31 October 2011. Retrieved 11 July 2020.
- ^ "Iqaluit (composite station threads)". Canadian Climate Normals 1991-2020 Data. Environment and Climate Change Canada. Archived from the original on 12 April 2024. Retrieved 29 September 2023.
- ^ "Iqaluit, Canada - Detailed climate information and monthly weather forecast". Weather Atlas. Yu Media Group. Retrieved 6 July 2019.
- ^ "Cambridge Bay (Composite Station Threads)". Canadian Climate Normals 1991-2020 Data. Environment and Climate Change Canada. Archived from the original on 30 September 2023. Retrieved 30 September 2023.
- ^ "Daily Data Report for August 2011". Canadian Climate Data. Environment and Climate Change Canada. Retrieved 12 May 2016.
- ^ "Daily Data Report for August 2013". Canadian Climate Data. Environment and Climate Change Canada. Retrieved 12 May 2016.
- ^ "Hourly Data Report for February 04, 2022". Canadian Climate Data. Environment and Climate Change Canada. Retrieved 11 February 2022.
- ^ "Canadian Climate Normals 1991-2020 Data". Canadian Climate Normals. Environment and Climate Change Canada. Retrieved 1 October 2023.
- ^ "Kugluktuk (Composite Station Threads)". Canadian Climate Normals 1991-2020 Data. Environment and Climate Change Canada. Archived from the original on 21 December 2023. Retrieved 21 December 2023.
- ^ "Canadian Climate Normals 1951–1980 Volume 2: Temperature" (PDF). Environment Canada. Archived from the original (PDF) on 9 August 2023. Retrieved 24 October 2020.
- ^ "Canadian Climate Normals 1951–1980 Volume 8: Atmospheric, Pressure, Temperature and Humidity" (PDF). Environment Canada. Archived from the original (PDF) on 9 August 2023. Retrieved 11 August 2023.
- ^ "EIA". Archived from the original on 7 May 2013. Retrieved 4 May 2013.
- ^ "Aboriginal peoples in Canada: Focus on Inuit in Nunavut" (PDF). Statistics Canada. 15 January 2008. Archived from the original (PDF) on 5 March 2016. Retrieved 4 May 2013.
Geography of the
provinces and territories of
Canada | |
|---|---|
| National | |
| Provinces | |
| Territories | |
| See also | |