| Freel Peak | |
|---|---|
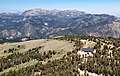
 Freel Peak from the
Tahoe Rim Trail | |
| Highest point | |
| Elevation | 10,886 ft (3,318 m) NAVD 88 [1] |
| Prominence | 3,146 ft (959 m) [2] |
| Isolation | 22.95 mi (36.93 km) [2] |
| Listing |
|
| Coordinates | 38°51′27″N 119°54′01″W / 38.857537042°N 119.900142906°W [1] |
| Geography | |
 Freel Peak  Freel Peak | |
| Location | El Dorado and Alpine counties, California, U.S. |
| Parent range | Carson Range |
| Topo map | USGS Freel Peak |
| Climbing | |
| Easiest route | Scramble, class 2 [3] |
Freel Peak is a mountain located in the Carson Range, a spur of the Sierra Nevada, near Lake Tahoe in California. [4]
The peak is on the boundary between El Dorado County and Alpine County; and the boundary between the Eldorado National Forest and the Humboldt-Toiyabe National Forest. [5] At 10,886 feet (3,318 m), it is the tallest summit in the Carson Range, El Dorado County, and the Tahoe Basin. [2] Due to its elevation, most of the precipitation that falls on the mountain is snow. [6]
In 1893, the U.S. Geological Survey assigned the name Freel Peak to what was then known as Jobs Peak. James Freel was an early settler in the area. [7] [8]
-
 Freel Peak and Lake Tahoe
 -
 Freel Peak seen from Jobs Sister
 -
 Freel Peak, Jobs Sister, and Jobs Peak seen from Hawkins Peak.


Climate
According to the Köppen climate classification system, Freel Peak is located in an alpine climate zone. [9] Most weather fronts originate in the Pacific Ocean, and travel east toward the Sierra Nevada mountains. As fronts approach, they are forced upward by the peaks ( orographic lift), causing them to drop their moisture in the form of rain or snowfall onto the range.
| Climate data for Freel Peak 38.8613 N, 119.9011 W, Elevation: 10,404 ft (3,171 m) (1991–2020 normals) | |||||||||||||
|---|---|---|---|---|---|---|---|---|---|---|---|---|---|
| Month | Jan | Feb | Mar | Apr | May | Jun | Jul | Aug | Sep | Oct | Nov | Dec | Year |
| Mean daily maximum °F (°C) | 33.2 (0.7) |
31.8 (−0.1) |
34.1 (1.2) |
38.4 (3.6) |
46.5 (8.1) |
56.6 (13.7) |
65.8 (18.8) |
65.1 (18.4) |
59.0 (15.0) |
49.2 (9.6) |
38.7 (3.7) |
32.8 (0.4) |
45.9 (7.8) |
| Daily mean °F (°C) | 24.3 (−4.3) |
22.3 (−5.4) |
24.3 (−4.3) |
27.4 (−2.6) |
34.8 (1.6) |
43.9 (6.6) |
52.2 (11.2) |
51.4 (10.8) |
46.1 (7.8) |
37.4 (3.0) |
29.3 (−1.5) |
24.2 (−4.3) |
34.8 (1.5) |
| Mean daily minimum °F (°C) | 15.4 (−9.2) |
12.8 (−10.7) |
14.4 (−9.8) |
16.3 (−8.7) |
23.1 (−4.9) |
31.2 (−0.4) |
38.7 (3.7) |
37.8 (3.2) |
33.1 (0.6) |
25.5 (−3.6) |
20.0 (−6.7) |
15.5 (−9.2) |
23.6 (−4.6) |
| Average precipitation inches (mm) | 6.57 (167) |
5.85 (149) |
5.51 (140) |
2.94 (75) |
2.43 (62) |
0.94 (24) |
0.49 (12) |
0.49 (12) |
0.74 (19) |
2.18 (55) |
3.79 (96) |
6.57 (167) |
38.5 (978) |
| Source: PRISM Climate Group [10] | |||||||||||||
References
- ^ a b "Freel Peak". NGS Data Sheet. National Geodetic Survey, National Oceanic and Atmospheric Administration, United States Department of Commerce. Retrieved 2009-01-21.
- ^ a b c d "Freel Peak, California". Peakbagger.com. Retrieved 2009-02-25.
- ^ a b "Tahoe OGUL Peaks List". Retrieved 2024-01-06.
- ^ "Freel Peak". SummitPost.org. Retrieved 2021-10-24.
- ^ Freel Peak quadrangle, California (Map). 1:24000. 7.5 Minute Topographic. USGS. Retrieved 2009-12-23.
- ^ "Subsection M261Et - Carson Range". U.S. Forest Service. Archived from the original on 2007-08-13. Retrieved 2014-02-22.
- ^ Gudde, Erwin G. (1949). California Place Names. Berkeley: Univ. of California Press. p. 121.
- ^ "Freel Peak". Geographic Names Information System. United States Geological Survey, United States Department of the Interior. Retrieved 2012-12-17.
- ^ "Climate of the Sierra Nevada". Encyclopædia Britannica.
-
^
"PRISM Climate Group, Oregon State University". PRISM Climate Group, Oregon State University. Retrieved October 2, 2023.
To find the table data on the PRISM website, start by clicking Coordinates (under Location); copy Latitude and Longitude figures from top of table; click Zoom to location; click Precipitation, Minimum temp, Mean temp, Maximum temp; click 30-year normals, 1991-2020; click 800m; click Retrieve Time Series button.
| Mountains |
| |||||||||||
|---|---|---|---|---|---|---|---|---|---|---|---|---|
| Passes | ||||||||||||
| Rivers | ||||||||||||
| Lakes | ||||||||||||
|
Protected areas |
| |||||||||||
| Communities | ||||||||||||
| Ski areas | ||||||||||||
| Trails | ||||||||||||

|
| This Alpine County, California-related article is a stub. You can help Wikipedia by expanding it. |
|
| This El Dorado County, California–related article is a stub. You can help Wikipedia by expanding it. |
- Mountains of the Sierra Nevada (United States)
- Mountains of El Dorado County, California
- Mountains of Alpine County, California
- Eldorado National Forest
- Humboldt–Toiyabe National Forest
- Mountains of Northern California
- North American 3000 m summits
- Sierra Nevada geography stubs
- El Dorado County, California geography stubs