Follett, Texas | |
|---|---|
 Location of Follett, Texas | |
 | |
| Coordinates: 36°26′02″N 100°08′27″W / 36.43389°N 100.14083°W | |
| Country | United States |
| State | Texas |
| County | Lipscomb |
| Area | |
| • Total | 0.97 sq mi (2.52 km2) |
| • Land | 0.97 sq mi (2.52 km2) |
| • Water | 0.00 sq mi (0.00 km2) |
| Elevation | 2,608 ft (795 m) |
| Population (
2010) | |
| • Total | 459 |
| • Estimate (2019)
[3] | 441 |
| • Density | 454.17/sq mi (175.32/km2) |
| Time zone | UTC-6 ( Central (CST)) |
| • Summer ( DST) | UTC-5 (CDT) |
| ZIP code | 79034 |
| Area code | 806 |
| FIPS code | 48-26328 [4] |
| GNIS feature ID | 2410515 [2] |
Follett is a town in Lipscomb County, Texas, United States, which was established in 1917 by Santa Fe railroad official Thomas C. Spearman as a townsite on the North Texas and Santa Fe Railway. It was named for Horace Follett, a locating engineer for the line. The population was 459 at the 2010 census.
Geography
According to the United States Census Bureau, the town has a total area of 1.0 square mile (2.6 km2), all land.
Climate
According to the Köppen Climate Classification system, Follett has a semi-arid climate, abbreviated "BSk" on climate maps. [5] The hottest temperature recorded in Follett was 112 °F (44.4 °C) on July 20, 2022, while the coldest temperature recorded was −18 °F (−27.8 °C) on December 22, 1989. [6]
| Climate data for Follett, Texas, 1991–2020 normals, extremes 1934–present | |||||||||||||
|---|---|---|---|---|---|---|---|---|---|---|---|---|---|
| Month | Jan | Feb | Mar | Apr | May | Jun | Jul | Aug | Sep | Oct | Nov | Dec | Year |
| Record high °F (°C) | 82 (28) |
93 (34) |
97 (36) |
98 (37) |
104 (40) |
111 (44) |
112 (44) |
110 (43) |
107 (42) |
102 (39) |
90 (32) |
84 (29) |
112 (44) |
| Mean maximum °F (°C) | 71.4 (21.9) |
77.2 (25.1) |
84.8 (29.3) |
89.7 (32.1) |
93.8 (34.3) |
99.1 (37.3) |
101.7 (38.7) |
101.3 (38.5) |
96.4 (35.8) |
90.6 (32.6) |
78.5 (25.8) |
70.4 (21.3) |
103.7 (39.8) |
| Mean daily maximum °F (°C) | 48.6 (9.2) |
52.6 (11.4) |
62.2 (16.8) |
70.9 (21.6) |
79.8 (26.6) |
88.7 (31.5) |
93.3 (34.1) |
92.2 (33.4) |
84.6 (29.2) |
72.5 (22.5) |
60.2 (15.7) |
49.4 (9.7) |
71.3 (21.8) |
| Daily mean °F (°C) | 35.7 (2.1) |
38.8 (3.8) |
47.5 (8.6) |
56.0 (13.3) |
66.0 (18.9) |
75.5 (24.2) |
80.1 (26.7) |
78.9 (26.1) |
71.2 (21.8) |
58.8 (14.9) |
46.6 (8.1) |
37.0 (2.8) |
57.7 (14.3) |
| Mean daily minimum °F (°C) | 22.8 (−5.1) |
25.0 (−3.9) |
32.9 (0.5) |
41.0 (5.0) |
52.2 (11.2) |
62.3 (16.8) |
66.9 (19.4) |
65.6 (18.7) |
57.8 (14.3) |
45.0 (7.2) |
32.9 (0.5) |
24.7 (−4.1) |
44.1 (6.7) |
| Mean minimum °F (°C) | 6.0 (−14.4) |
8.7 (−12.9) |
15.8 (−9.0) |
26.6 (−3.0) |
37.1 (2.8) |
51.0 (10.6) |
58.2 (14.6) |
56.7 (13.7) |
43.3 (6.3) |
27.5 (−2.5) |
16.9 (−8.4) |
7.8 (−13.4) |
1.1 (−17.2) |
| Record low °F (°C) | −12 (−24) |
−15 (−26) |
−4 (−20) |
12 (−11) |
28 (−2) |
42 (6) |
46 (8) |
47 (8) |
29 (−2) |
7 (−14) |
3 (−16) |
−18 (−28) |
−18 (−28) |
| Average precipitation inches (mm) | 0.80 (20) |
0.74 (19) |
1.74 (44) |
2.08 (53) |
3.12 (79) |
3.45 (88) |
2.74 (70) |
2.54 (65) |
2.12 (54) |
2.15 (55) |
0.94 (24) |
0.82 (21) |
23.24 (592) |
| Average snowfall inches (cm) | 2.8 (7.1) |
1.1 (2.8) |
3.5 (8.9) |
0.1 (0.25) |
0.0 (0.0) |
0.0 (0.0) |
0.0 (0.0) |
0.0 (0.0) |
0.0 (0.0) |
0.7 (1.8) |
2.2 (5.6) |
2.7 (6.9) |
13.1 (33.35) |
| Average extreme snow depth inches (cm) | 0.9 (2.3) |
0.9 (2.3) |
0.4 (1.0) |
0.1 (0.25) |
0.0 (0.0) |
0.0 (0.0) |
0.0 (0.0) |
0.0 (0.0) |
0.0 (0.0) |
0.0 (0.0) |
0.4 (1.0) |
0.7 (1.8) |
1.8 (4.6) |
| Average precipitation days (≥ 0.01 in) | 2.5 | 3.3 | 4.7 | 5.1 | 6.7 | 6.5 | 6.5 | 6.5 | 4.2 | 4.4 | 3.2 | 3.4 | 57.0 |
| Average snowy days (≥ 0.1 in) | 0.9 | 0.7 | 0.8 | 0.0 | 0.0 | 0.0 | 0.0 | 0.0 | 0.0 | 0.2 | 0.5 | 0.9 | 4.0 |
| Source 1: NOAA [7] | |||||||||||||
| Source 2: National Weather Service [6] | |||||||||||||
Demographics
| Census | Pop. | Note | %± |
|---|---|---|---|
| 1930 | 658 | — | |
| 1940 | 431 | −34.5% | |
| 1950 | 540 | 25.3% | |
| 1960 | 466 | −13.7% | |
| 1970 | 522 | 12.0% | |
| 1980 | 547 | 4.8% | |
| 1990 | 441 | −19.4% | |
| 2000 | 412 | −6.6% | |
| 2010 | 459 | 11.4% | |
| 2019 (est.) | 441 | [3] | −3.9% |
| U.S. Decennial Census [8] | |||
As of the census [4] of 2000, there were 412 people, 174 households, and 112 families residing in the town. The population density was 425.1 inhabitants per square mile (164.1/km2). There were 242 housing units at an average density of 249.7 per square mile (96.4/km2). The racial makeup of the town was 91.75% White, 1.46% Native American, 6.07% from other races, and 0.73% from two or more races. Hispanic or Latino of any race were 7.28% of the population.
There were 174 households, out of which 28.2% had children under the age of 18 living with them, 56.9% were married couples living together, 6.9% had a female householder with no husband present, and 35.1% were non-families. 33.3% of all households were made up of individuals, and 21.8% had someone living alone who was 65 years of age or older. The average household size was 2.37 and the average family size was 3.04.
In the town the population was spread out, with 26.5% under the age of 18, 5.6% from 18 to 24, 21.8% from 25 to 44, 26.5% from 45 to 64, and 19.7% who were 65 years of age or older. The median age was 42 years. For every 100 females, there were 89.9 males. For every 100 females age 18 and over, there were 83.6 males.
The median income for a household in the town was $29,583, and the median income for a family was $36,000. Males had a median income of $33,750 versus $15,781 for females. The per capita income for the town was $16,315. About 12.3% of families and 17.3% of the population were below the poverty line, including 21.0% of those under age 18 and 24.4% of those age 65 or over.
Education
The Town of Follett is served by the Follett Independent School District.
References
- ^ "2019 U.S. Gazetteer Files". United States Census Bureau. Retrieved August 7, 2020.
- ^ a b U.S. Geological Survey Geographic Names Information System: Follett, Texas
- ^ a b "Population and Housing Unit Estimates". United States Census Bureau. May 24, 2020. Retrieved May 27, 2020.
- ^ a b "U.S. Census website". United States Census Bureau. Retrieved January 31, 2008.
- ^ Climate Summary for Follett, Texas
- ^ a b "NOAA Online Weather Data - NWS Amarillo". National Weather Service. Retrieved November 1, 2022.
- ^ "U.S. Climate Normals Quick Access - Station: Follett, TX". National Oceanic and Atmospheric Administration. Retrieved November 1, 2022.
- ^ "Census of Population and Housing". Census.gov. Retrieved June 4, 2015.
Municipalities and communities of
Lipscomb County, Texas, United States | ||
|---|---|---|
| City | 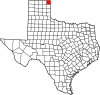 | |
| Towns | ||
| CDP | ||
|
Other community | ||
| Footnotes | ‡This populated place also has portions in an adjacent county or counties | |