
Size of this PNG preview of this SVG file:
600 × 450 pixels. Other resolutions:
320 × 240 pixels |
640 × 480 pixels |
1,024 × 768 pixels |
1,280 × 960 pixels |
2,560 × 1,920 pixels.
Original file (SVG file, nominally 600 × 450 pixels, file size: 101 KB)
| This is a file from the
Wikimedia Commons. Information from its
description page there is shown below. Commons is a freely licensed media file repository. You can help. |
Summary
| Description |
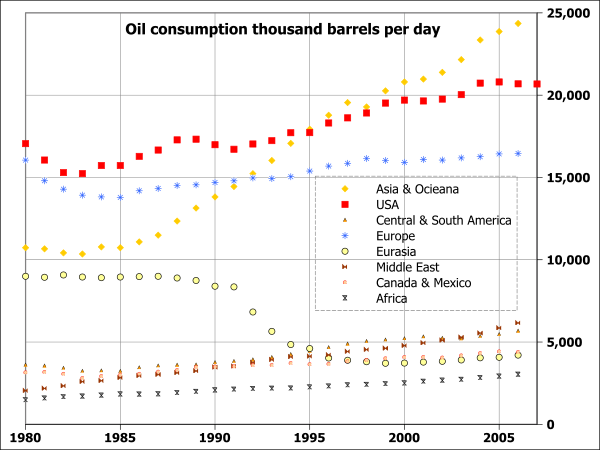
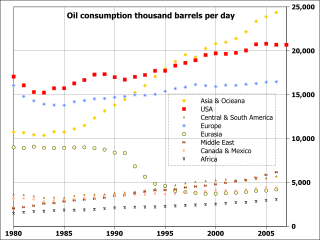
English: Daily oil consumption by region from 1980 to 2006; vertical scale shows thousands of barrels per day, and the horizontal scale shows years from 1980 to 2007. |
| Date | |
| Source | I, 84user, created this work using the excel file RecentPetroleumConsumptionBarrelsperDay.xls from the U.S. Energy Information Administration's web page http://tonto.eia.doe.gov/dnav/pet/pet_pri_wco_k_w.htm (direct link: http://www.eia.doe.gov/emeu/international/RecentPetroleumConsumptionBarrelsperDay.xls) and using Open Source Gnumeric 1.9.1 to produce the chart |
| Author | 84user ( talk) |
Licensing
| This work has been released into the
public domain by its author,
84user at
English Wikipedia. This applies worldwide. In some countries this may not be legally possible; if so: 84user grants anyone the right to use this work for any purpose, without any conditions, unless such conditions are required by law. |
Original upload log
Transferred from en.wikipedia to Commons by Skiff using CommonsHelper.
The original description page was
here. All following user names refer to en.wikipedia.
- 2008-10-24 20:32 84user 600×450× (103638 bytes) {{Information |Description=Daily oil consumption by region from 1980 to 2006; vertical scale shows thousands of barrels per day, and the horizontal scale shows years from 1980 to 2007. Related charts: [[Image:World oil price in dollars from 1978 to 2008-1
File history
Click on a date/time to view the file as it appeared at that time.
| Date/Time | Thumbnail | Dimensions | User | Comment | |
|---|---|---|---|---|---|
| current | 18:54, 12 March 2011 |
| 600 × 450 (101 KB) | File Upload Bot (Magnus Manske) | {{BotMoveToCommons|en.wikipedia|year={{subst:CURRENTYEAR}}|month={{subst:CURRENTMONTHNAME}}|day={{subst:CURRENTDAY}}}} {{Information |Description={{en|Daily oil consumption by region from 1980 to 2006; vertical scale shows thousands of barrels per day, a |
File usage
The following pages on the English Wikipedia use this file (pages on other projects are not listed):
Global file usage
The following other wikis use this file:
- Usage on ar.wikipedia.org
- Usage on fr.wikipedia.org
- Usage on simple.wikipedia.org
- Usage on ta.wikipedia.org
- Usage on th.wikipedia.org
- Usage on uk.wikipedia.org
- Usage on ur.wikipedia.org