
Size of this PNG preview of this SVG file:
555 × 352 pixels. Other resolutions:
320 × 203 pixels |
640 × 406 pixels |
1,024 × 649 pixels |
1,280 × 812 pixels |
2,560 × 1,624 pixels.
Original file (SVG file, nominally 555 × 352 pixels, file size: 1.27 MB)
| This is a file from the
Wikimedia Commons. Information from its
description page there is shown below. Commons is a freely licensed media file repository. You can help. |
Summary
| Description |
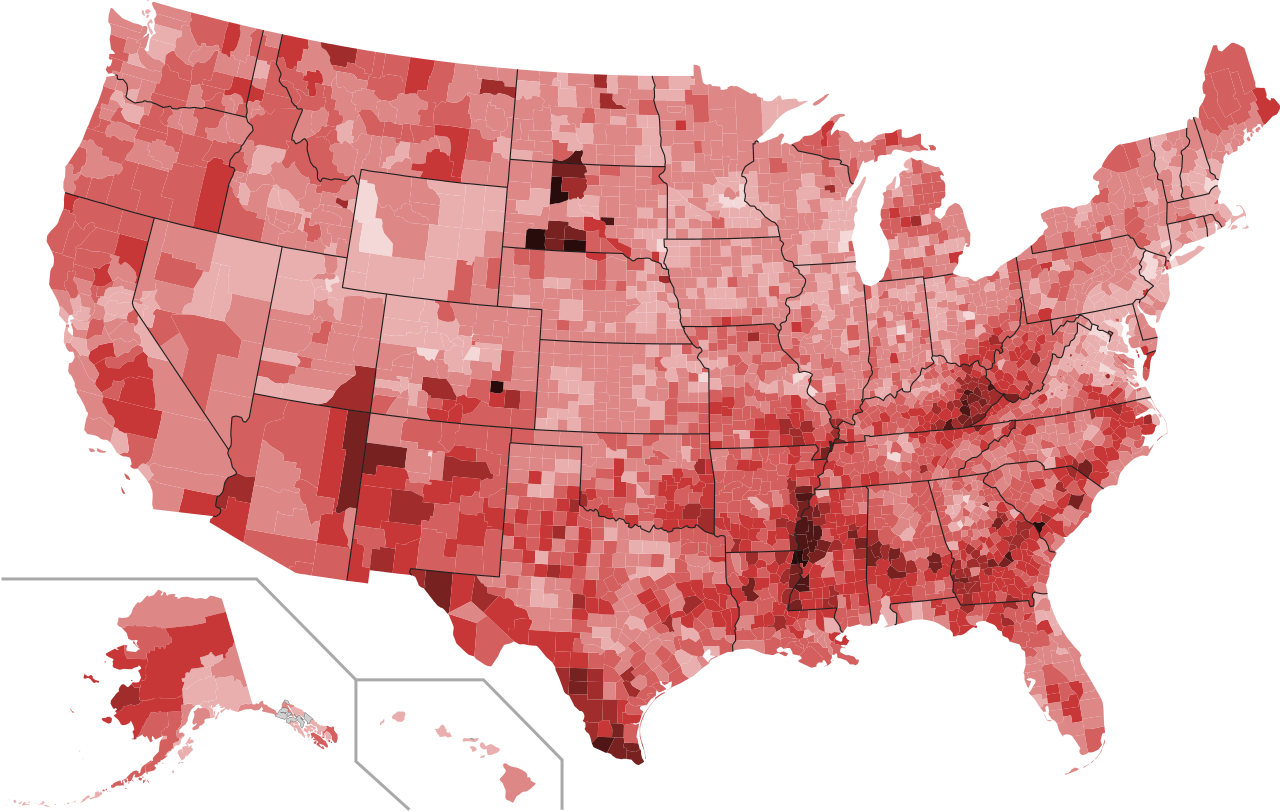
English: US poverty rate estimate for all ages in 2008. Data comes from US census bureau data
here. I used
this python script to colour in each county along with a CSV derived from the census data.
Legend: <5%
<10%
<15%
<20%
<25%
<30%
<35%
<40%
>40% |
| Date | |
| Source | Own work |
| Author | TastyCakes |
| Other versions | Derivative works of this file: US Poverty Rates-legend.svg |
Licensing
I, the copyright holder of this work, hereby publish it under the following license:
This file is licensed under the
Creative Commons
Attribution 3.0 Unported license.
- You are free:
- to share – to copy, distribute and transmit the work
- to remix – to adapt the work
- Under the following conditions:
- attribution – You must give appropriate credit, provide a link to the license, and indicate if changes were made. You may do so in any reasonable manner, but not in any way that suggests the licensor endorses you or your use.
File history
Click on a date/time to view the file as it appeared at that time.
| Date/Time | Thumbnail | Dimensions | User | Comment | |
|---|---|---|---|---|---|
| current | 23:45, 25 November 2009 |
| 555 × 352 (1.27 MB) | TastyCakes | Fixed a couple of missing counties |
| 23:04, 25 November 2009 |
 | 555 × 352 (1.27 MB) | TastyCakes | hopefully fixed | |
| 21:53, 25 November 2009 | No thumbnail | (1.27 MB) | TastyCakes | {{Information |Description={{en|1=US poverty rate estimate for all ages in 2008. Data comes from US census bureau data [http://www.census.gov/did/www/saipe/data/statecounty/data/2008.html here]. I used a python script to colour in each county, but somet |
File usage
The following pages on the English Wikipedia use this file (pages on other projects are not listed):
Global file usage
The following other wikis use this file:
- Usage on ar.wikipedia.org
- Usage on pt.wikipedia.org
- Usage on ur.wikipedia.org