Size of this preview:
800 × 547 pixels. Other resolutions:
320 × 219 pixels |
640 × 438 pixels |
911 × 623 pixels.
Original file (911 × 623 pixels, file size: 50 KB, MIME type: image/jpeg)
|
| This image was
uploaded in the
JPEG format even though it consists of non-photographic data. The information it contains could be stored more efficiently or more accurately in the
PNG or
SVG format. If possible, please upload a PNG or SVG version of this image, derived from a non-JPEG source so that it doesn't contain any compression artifacts (or with existing artifacts removed) and with transparency where appropriate. After doing so, please replace all instances of the JPEG version throughout Wikipedia (noted under the " File links" header), tag the JPEG version with {{
obsolete|NewImage.ext}}, and remove this tag. For more information, see
Wikipedia:Preparing images for upload.( Search for similar images) This image has been added to Category:Images with inappropriate JPEG compression. |
Summary
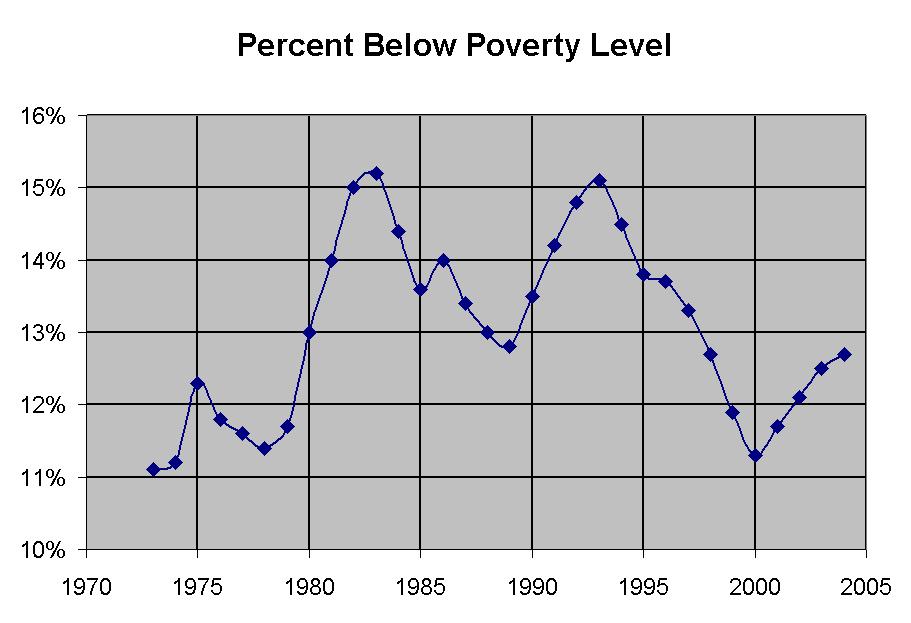
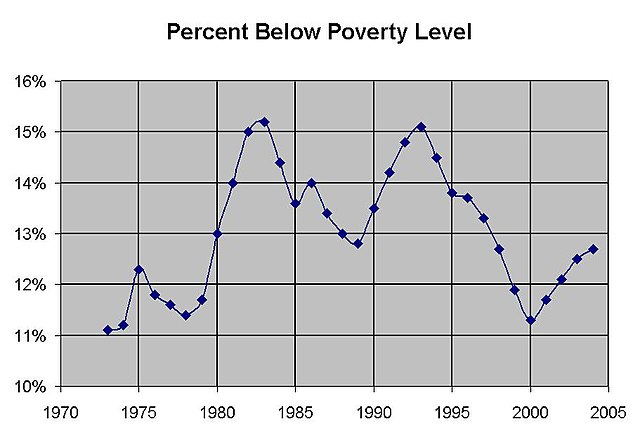
Graph of the U.S. Poverty Rate from 1973 to present. Graph created from Census Bureau tables.
| I, the copyright holder of this work, hereby release it into the
public domain. This applies worldwide. If this is not legally possible: |
Licensing
| I, the copyright holder of this work, hereby release it into the
public domain. This applies worldwide. If this is not legally possible: |
 | This file is a candidate to be copied to
Wikimedia Commons.
Any user may perform this transfer; refer to Wikipedia:Moving files to Commons for details. If this file has problems with attribution, copyright, or is otherwise ineligible for Commons, then remove this tag and DO NOT transfer it; repeat violators may be blocked from editing. Other Instructions
| ||
| |||
File history
Click on a date/time to view the file as it appeared at that time.
| Date/Time | Thumbnail | Dimensions | User | Comment | |
|---|---|---|---|---|---|
| current | 20:06, 30 August 2005 |
| 911 × 623 (50 KB) | RichardMathews ( talk | contribs) | Graph of the U.S. Poverty Rate from 1973 to present. Graph created from Census Bureau tables.{{PD-user|RichardMathews}} |
You cannot overwrite this file.
File usage
The following pages on the English Wikipedia use this file (pages on other projects are not listed):