
Size of this preview:
800 × 555 pixels. Other resolutions:
320 × 222 pixels |
640 × 444 pixels |
1,024 × 710 pixels |
1,236 × 857 pixels.
Original file (1,236 × 857 pixels, file size: 158 KB, MIME type: image/png)
| This is a file from the
Wikimedia Commons. Information from its
description page there is shown below. Commons is a freely licensed media file repository. You can help. |
Summary
| Description |
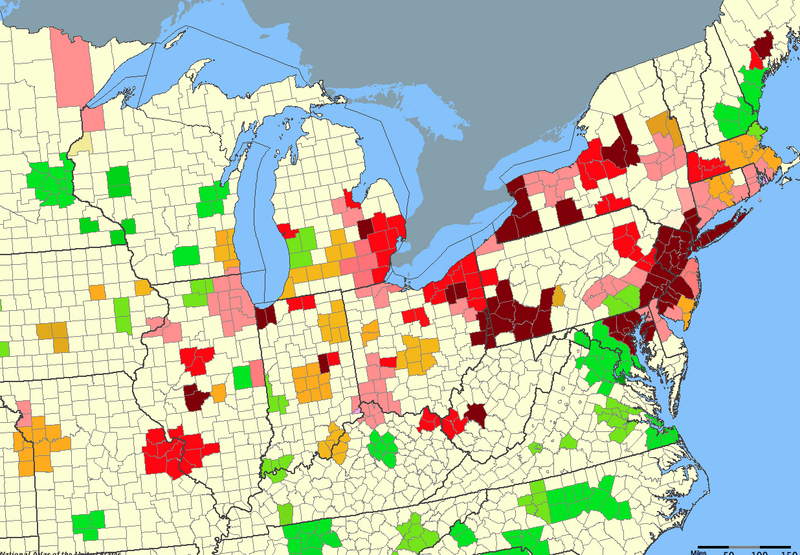
English: Change in total number of manufacturing jobs in metropolitan areas, 1954/1958-2002. Data from the 1958 Census of Manufactures had to be used for New England, due to changes in counting methods. (All other figures are from 1954.) Boundaries reflect 2002 metropolitan areas; numbers have been adjusted accordingly, and new metropolitan areas left out. The national average over this period was —8.65%.
KEY: Green=greater than 60% growth in manufacturing jobs Light green=54.4% growth to 7.5% decrease Yellow=8.7% to 29.1% decrease Pink=31.2% to 43.2% decrease Red=43.6% to 56.2% decrease Maroon=58% to 88.6% decrease Sources: 1958 Census of Manufactures and 2002 Economic Census. |
| Date | |
| Source | Own work |
| Author | Veillantif |
Licensing
I, the copyright holder of this work, hereby publish it under the following license:
This file is licensed under the
Creative Commons
Attribution-Share Alike 3.0 Unported license.
- You are free:
- to share – to copy, distribute and transmit the work
- to remix – to adapt the work
- Under the following conditions:
- attribution – You must give appropriate credit, provide a link to the license, and indicate if changes were made. You may do so in any reasonable manner, but not in any way that suggests the licensor endorses you or your use.
- share alike – If you remix, transform, or build upon the material, you must distribute your contributions under the same or compatible license as the original.
File history
Click on a date/time to view the file as it appeared at that time.
| Date/Time | Thumbnail | Dimensions | User | Comment | |
|---|---|---|---|---|---|
| current | 21:18, 25 September 2011 |
| 1,236 × 857 (158 KB) | Veillantif |
File usage
The following pages on the English Wikipedia use this file (pages on other projects are not listed):
Global file usage
The following other wikis use this file:
- Usage on ar.wikipedia.org
- Usage on bg.wikipedia.org
- Usage on fa.wikipedia.org
- Usage on id.wikipedia.org
- Usage on it.wikipedia.org
- Usage on vi.wikipedia.org
- Usage on zh.wikipedia.org