
Size of this PNG preview of this SVG file:
266 × 600 pixels. Other resolutions:
106 × 240 pixels |
213 × 480 pixels |
340 × 768 pixels |
454 × 1,024 pixels |
908 × 2,048 pixels |
290 × 654 pixels.
Original file (SVG file, nominally 290 × 654 pixels, file size: 277 KB)
| This is a file from the
Wikimedia Commons. Information from its
description page there is shown below. Commons is a freely licensed media file repository. You can help. |
Summary
| Description |
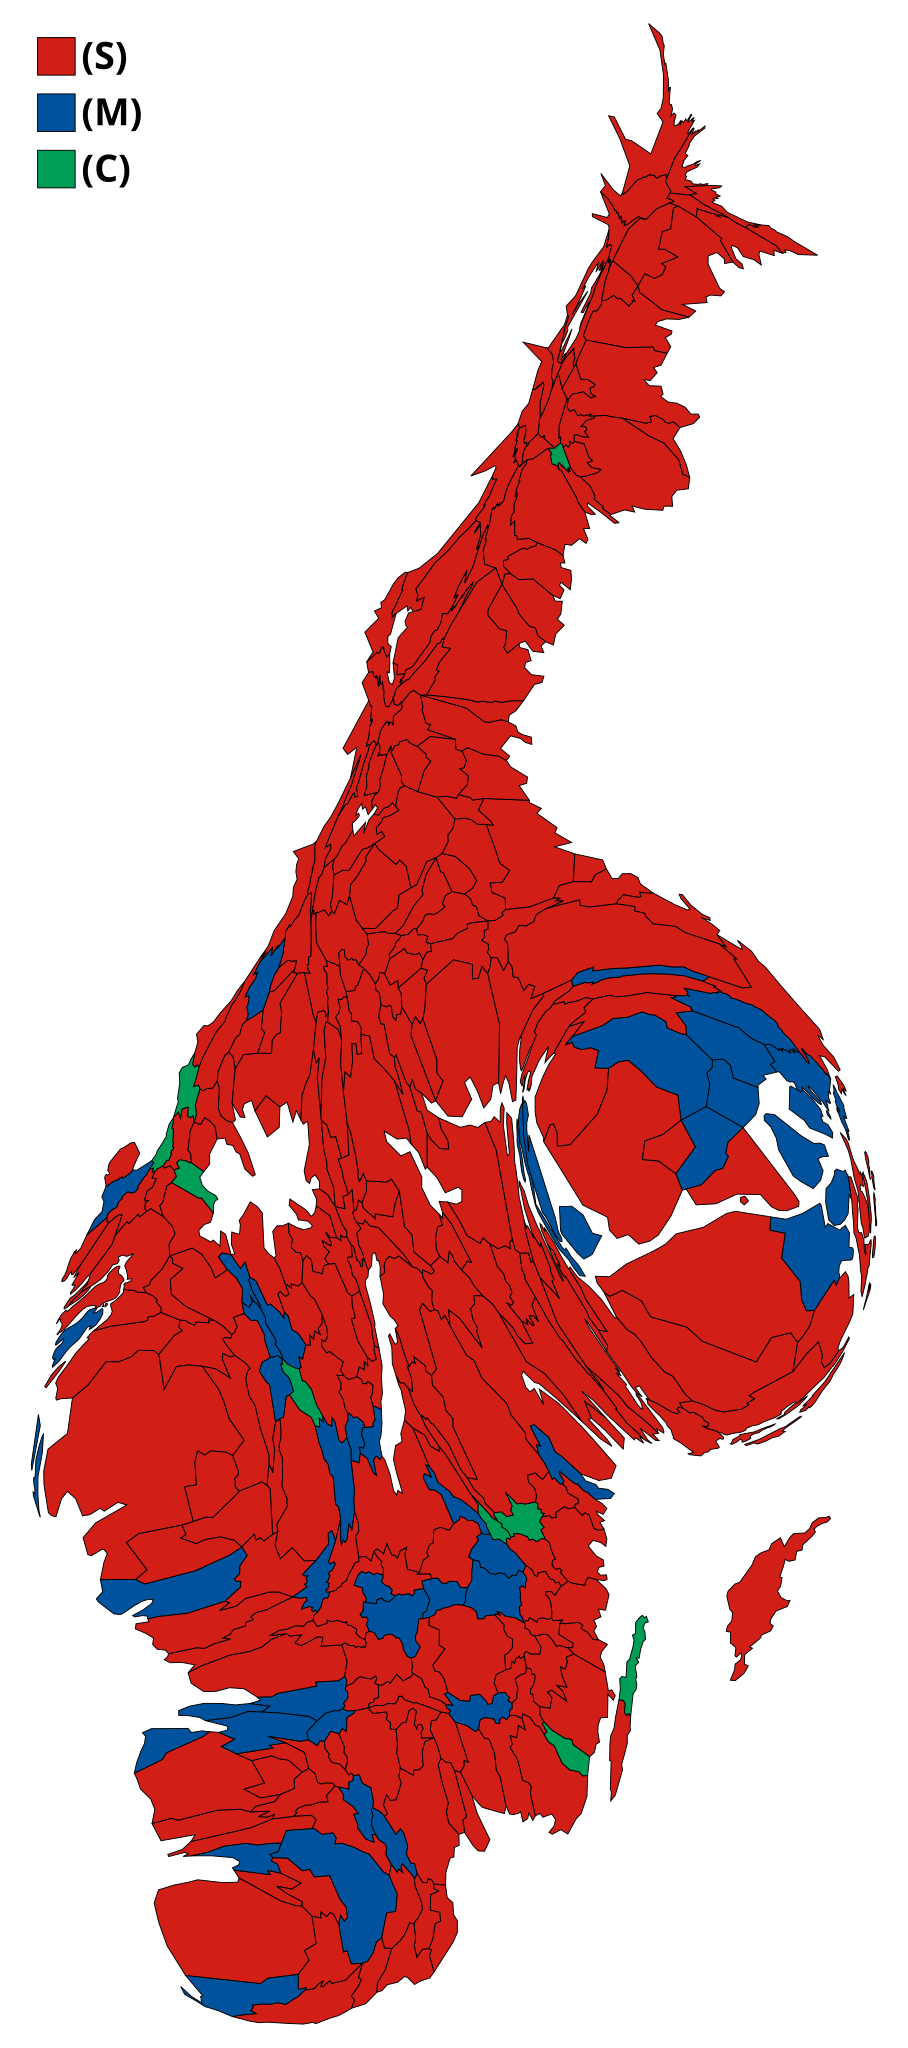
English:
Cartogram of Sweden with the area of municipalities (borders of 2006) scaled to number of valid votes in the Swedish general election of 1994. Each municipality has the color of the party that got the most votes within the coalition that won relative majority. |
| Date | |
| Source | Original borders of the map come from Statistics Sweden (SCB). SVG-file 'skeleton' by Lokal_Profil. Election results from Statistics Sweden (SCB). |
| Author | Skogssvinet |
The code used to generate this cartogram was first published in "Generating population density-equalizing maps", Michael T. Gastner and M. E. J. Newman, Proceedings of the National Academy of Sciences of the United States of America, vol. 101, pp. 7499-7504, 2004.
Licensing
I, the copyright holder of this work, hereby publish it under the following license:
This file is licensed under the
Creative Commons
Attribution-Share Alike 3.0 Unported license.
- You are free:
- to share – to copy, distribute and transmit the work
- to remix – to adapt the work
- Under the following conditions:
- attribution – You must give appropriate credit, provide a link to the license, and indicate if changes were made. You may do so in any reasonable manner, but not in any way that suggests the licensor endorses you or your use.
- share alike – If you remix, transform, or build upon the material, you must distribute your contributions under the same or compatible license as the original.
File history
Click on a date/time to view the file as it appeared at that time.
| Date/Time | Thumbnail | Dimensions | User | Comment | |
|---|---|---|---|---|---|
| current | 05:24, 7 February 2009 |
| 290 × 654 (277 KB) | Skogssvinet | |
| 06:31, 28 January 2009 |
 | 290 × 654 (277 KB) | Skogssvinet | ||
| 17:19, 27 January 2009 |
 | 290 × 654 (276 KB) | Skogssvinet | {{Information |Description={{en|1=artogram of Sweden with the area of municipalities (borders of 2006) scaled to number of valid votes in the Swedish general election of 1994. Each municipality is colored either red or blue depending on which coalition wo |
File usage
The following pages on the English Wikipedia use this file (pages on other projects are not listed):
Global file usage
The following other wikis use this file:
- Usage on ro.wikipedia.org