
Size of this preview:
800 × 404 pixels. Other resolutions:
320 × 162 pixels |
640 × 323 pixels |
1,024 × 517 pixels |
1,648 × 832 pixels.
Original file (1,648 × 832 pixels, file size: 85 KB, MIME type: image/jpeg)
| This is a file from the
Wikimedia Commons. Information from its
description page there is shown below. Commons is a freely licensed media file repository. You can help. |
Summary
| Description |
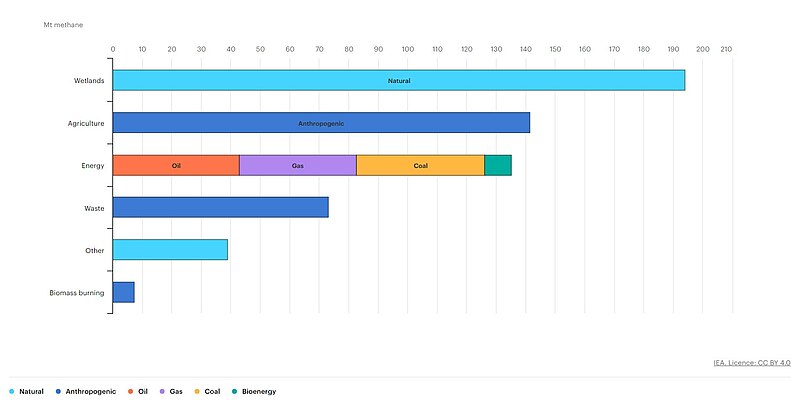
English: Bar graph of sources global of methane emissions. Energy sector emissions are from the Global Methane Tracker for 2021; non-energy sector emissions are the average of estimates available from UNFCCC, CAIT, EDGAR and CEDS for 2018 or 2019. Natural sources and biomass burning are top-down median estimates and bottom-up median estimates respectively from the Global Methane Budget for 2017. |
| Date | |
| Source | https://www.iea.org/data-and-statistics/charts/sources-of-methane-emissions-2021 |
| Author | International Energy Agency |
Licensing
This file is licensed under the
Creative Commons
Attribution-Share Alike 4.0 International license.
- You are free:
- to share – to copy, distribute and transmit the work
- to remix – to adapt the work
- Under the following conditions:
- attribution – You must give appropriate credit, provide a link to the license, and indicate if changes were made. You may do so in any reasonable manner, but not in any way that suggests the licensor endorses you or your use.
- share alike – If you remix, transform, or build upon the material, you must distribute your contributions under the same or compatible license as the original.
File history
Click on a date/time to view the file as it appeared at that time.
| Date/Time | Thumbnail | Dimensions | User | Comment | |
|---|---|---|---|---|---|
| current | 14:19, 18 September 2023 |
| 1,648 × 832 (85 KB) | TatjanaClimate | Uploaded a work by International Energy Agency from https://www.iea.org/data-and-statistics/charts/sources-of-methane-emissions-2021 with UploadWizard |
File usage
The following pages on the English Wikipedia use this file (pages on other projects are not listed):