
Size of this preview:
800 × 355 pixels. Other resolutions:
320 × 142 pixels |
640 × 284 pixels |
1,024 × 455 pixels |
1,739 × 772 pixels.
Original file (1,739 × 772 pixels, file size: 780 KB, MIME type: image/png)
| This is a file from the
Wikimedia Commons. Information from its
description page there is shown below. Commons is a freely licensed media file repository. You can help. |
Summary
| Description |
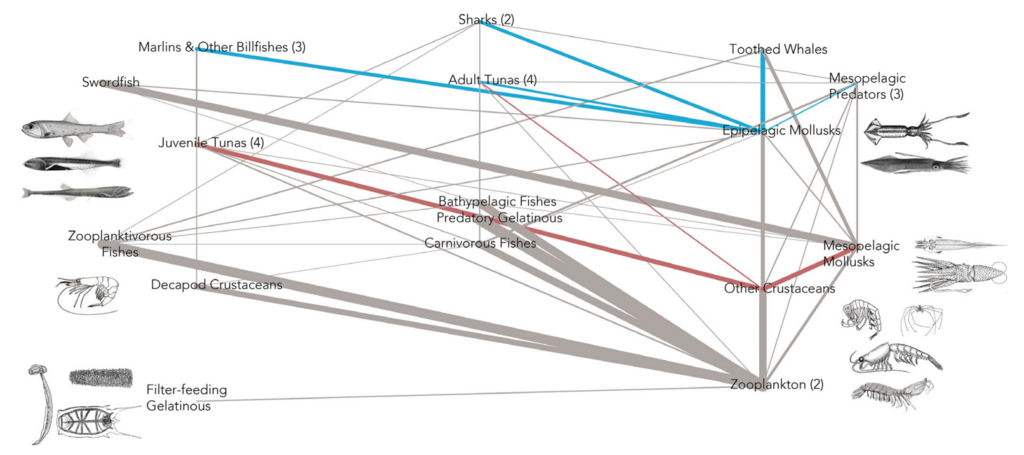
English: Role of micronekton in pelagic food webs.
Simplified food web diagram showing the energy flow through key micronekton and top predator functional groups. Diet proportions 5% or greater (from the balanced diet matrix) are shown between groups, where the thickness of the lines is scaled to parameterized diet proportions. Numbers in parentheses next to group names indicate the number of pooled functional groups within that group, and diet fractions are averaged for included groups. Colored lines highlight the energy pathways of "other crustaceans" (red) and "epipelagic mollusks" (blue) through the food web |
| Date | |
| Source | [1] |
| Author | C. Anela Choy, Colette C. C. Wabnitz, Mariska Weijerman, Phoebe A. Woodworth-Jefcoats and Jeffrey J. Polovina |
Licensing
This file is licensed under the
Creative Commons
Attribution 4.0 International license.
- You are free:
- to share – to copy, distribute and transmit the work
- to remix – to adapt the work
- Under the following conditions:
- attribution – You must give appropriate credit, provide a link to the license, and indicate if changes were made. You may do so in any reasonable manner, but not in any way that suggests the licensor endorses you or your use.
File history
Click on a date/time to view the file as it appeared at that time.
| Date/Time | Thumbnail | Dimensions | User | Comment | |
|---|---|---|---|---|---|
| current | 21:07, 2 March 2020 |
| 1,739 × 772 (780 KB) | Epipelagic | User created page with UploadWizard |
File usage
The following pages on the English Wikipedia use this file (pages on other projects are not listed):