Size of this PNG preview of this SVG file:
800 × 372 pixels. Other resolutions:
320 × 149 pixels |
640 × 298 pixels |
1,024 × 476 pixels |
1,280 × 595 pixels |
2,560 × 1,191 pixels |
933 × 434 pixels.
Original file (SVG file, nominally 933 × 434 pixels, file size: 50 KB)
File history
Click on a date/time to view the file as it appeared at that time.
| Date/Time | Thumbnail | Dimensions | User | Comment | |
|---|---|---|---|---|---|
| current | 20:01, 23 August 2017 |
 | 933 × 434 (50 KB) | Krishnavedala | much reduced vector version |
| 22:28, 24 September 2009 |
 | 800 × 600 (122 KB) | Geek3 | linewidth=1px | |
| 19:33, 20 November 2008 |
 | 800 × 600 (122 KB) | Slonzor | Man i've messed this up a lot of times. | |
| 19:27, 20 November 2008 |
 | 800 × 600 (3.36 MB) | Slonzor | ||
| 19:23, 20 November 2008 |
 | 800 × 600 (3.36 MB) | Slonzor | ||
| 19:18, 20 November 2008 |
 | 800 × 600 (3.36 MB) | Slonzor | ||
| 19:13, 20 November 2008 |
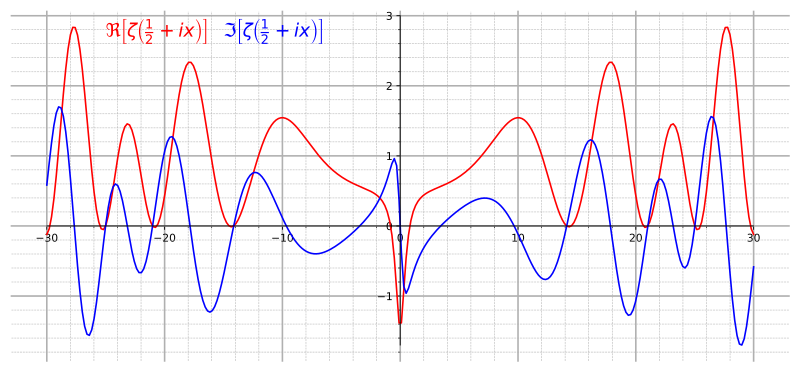
 | 800 × 600 (79 KB) | Slonzor | {{Information |Description={{en|1=Graph of real (red) and imaginary (blue) parts of the critical line Re(z)=1/2 of the Riemann zeta function.}} |Source=Own work. Made with Mathematica using the following code: <code><nowiki>Show[Plot[{Re[Zeta[1/2+I x]], |
File usage
The following pages on the English Wikipedia use this file (pages on other projects are not listed):
Global file usage
The following other wikis use this file:
- Usage on ar.wikipedia.org
- Usage on ba.wikipedia.org
- Usage on be.wikipedia.org
- Usage on ca.wikipedia.org
- Usage on ckb.wikipedia.org
- Usage on da.wikipedia.org
- Usage on el.wikipedia.org
- Usage on eo.wikipedia.org
- Usage on eu.wikipedia.org
- Usage on fa.wikipedia.org
- Usage on fi.wikipedia.org
- Usage on he.wikipedia.org
- Usage on hi.wikipedia.org
- Usage on hy.wikipedia.org
- Usage on id.wikipedia.org
- Usage on it.wikipedia.org
- Usage on it.wikiquote.org
- Usage on ja.wikipedia.org
- Usage on ko.wikipedia.org
- Usage on la.wikipedia.org
- Usage on mn.wikipedia.org
- Usage on nn.wikipedia.org
- Usage on no.wikipedia.org
- Usage on pa.wikipedia.org
- Usage on pt.wikipedia.org
- Usage on ru.wikipedia.org
- Usage on sl.wikipedia.org
- Usage on sq.wikipedia.org
- Usage on sr.wikipedia.org
- Usage on uk.wikipedia.org
- Usage on vi.wikipedia.org
- Usage on zh-yue.wikipedia.org
- Usage on zh.wikipedia.org