
Original file (SVG file, nominally 960 × 893 pixels, file size: 33 KB)
| This is a file from the
Wikimedia Commons. Information from its
description page there is shown below. Commons is a freely licensed media file repository. You can help. |
This file is translated using SVG <switch> elements. All translations are stored in the same file!
Learn more.
For most Wikipedia projects, you can embed the file normally (without a To translate the text into your language, you can use the SVG Translate tool. Alternatively, you can download the file to your computer, add your translations using whatever software you're familiar with, and re-upload it with the same name. You will find help in Graphics Lab if you're not sure how to do this. |
Summary
| Description |
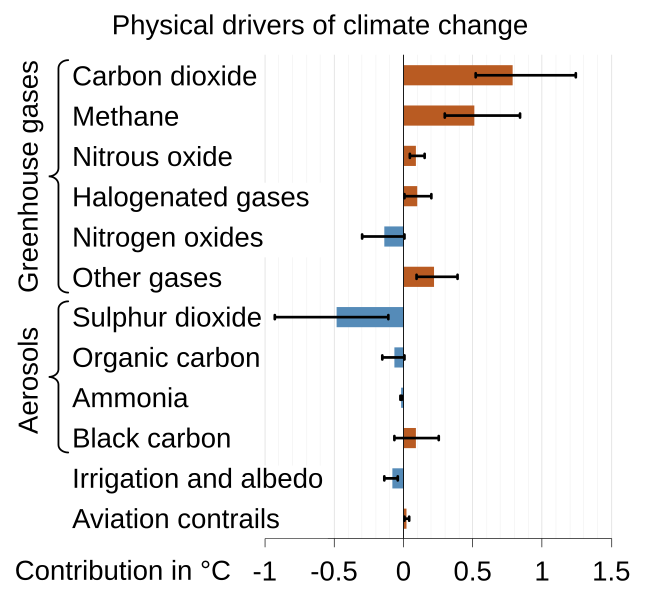
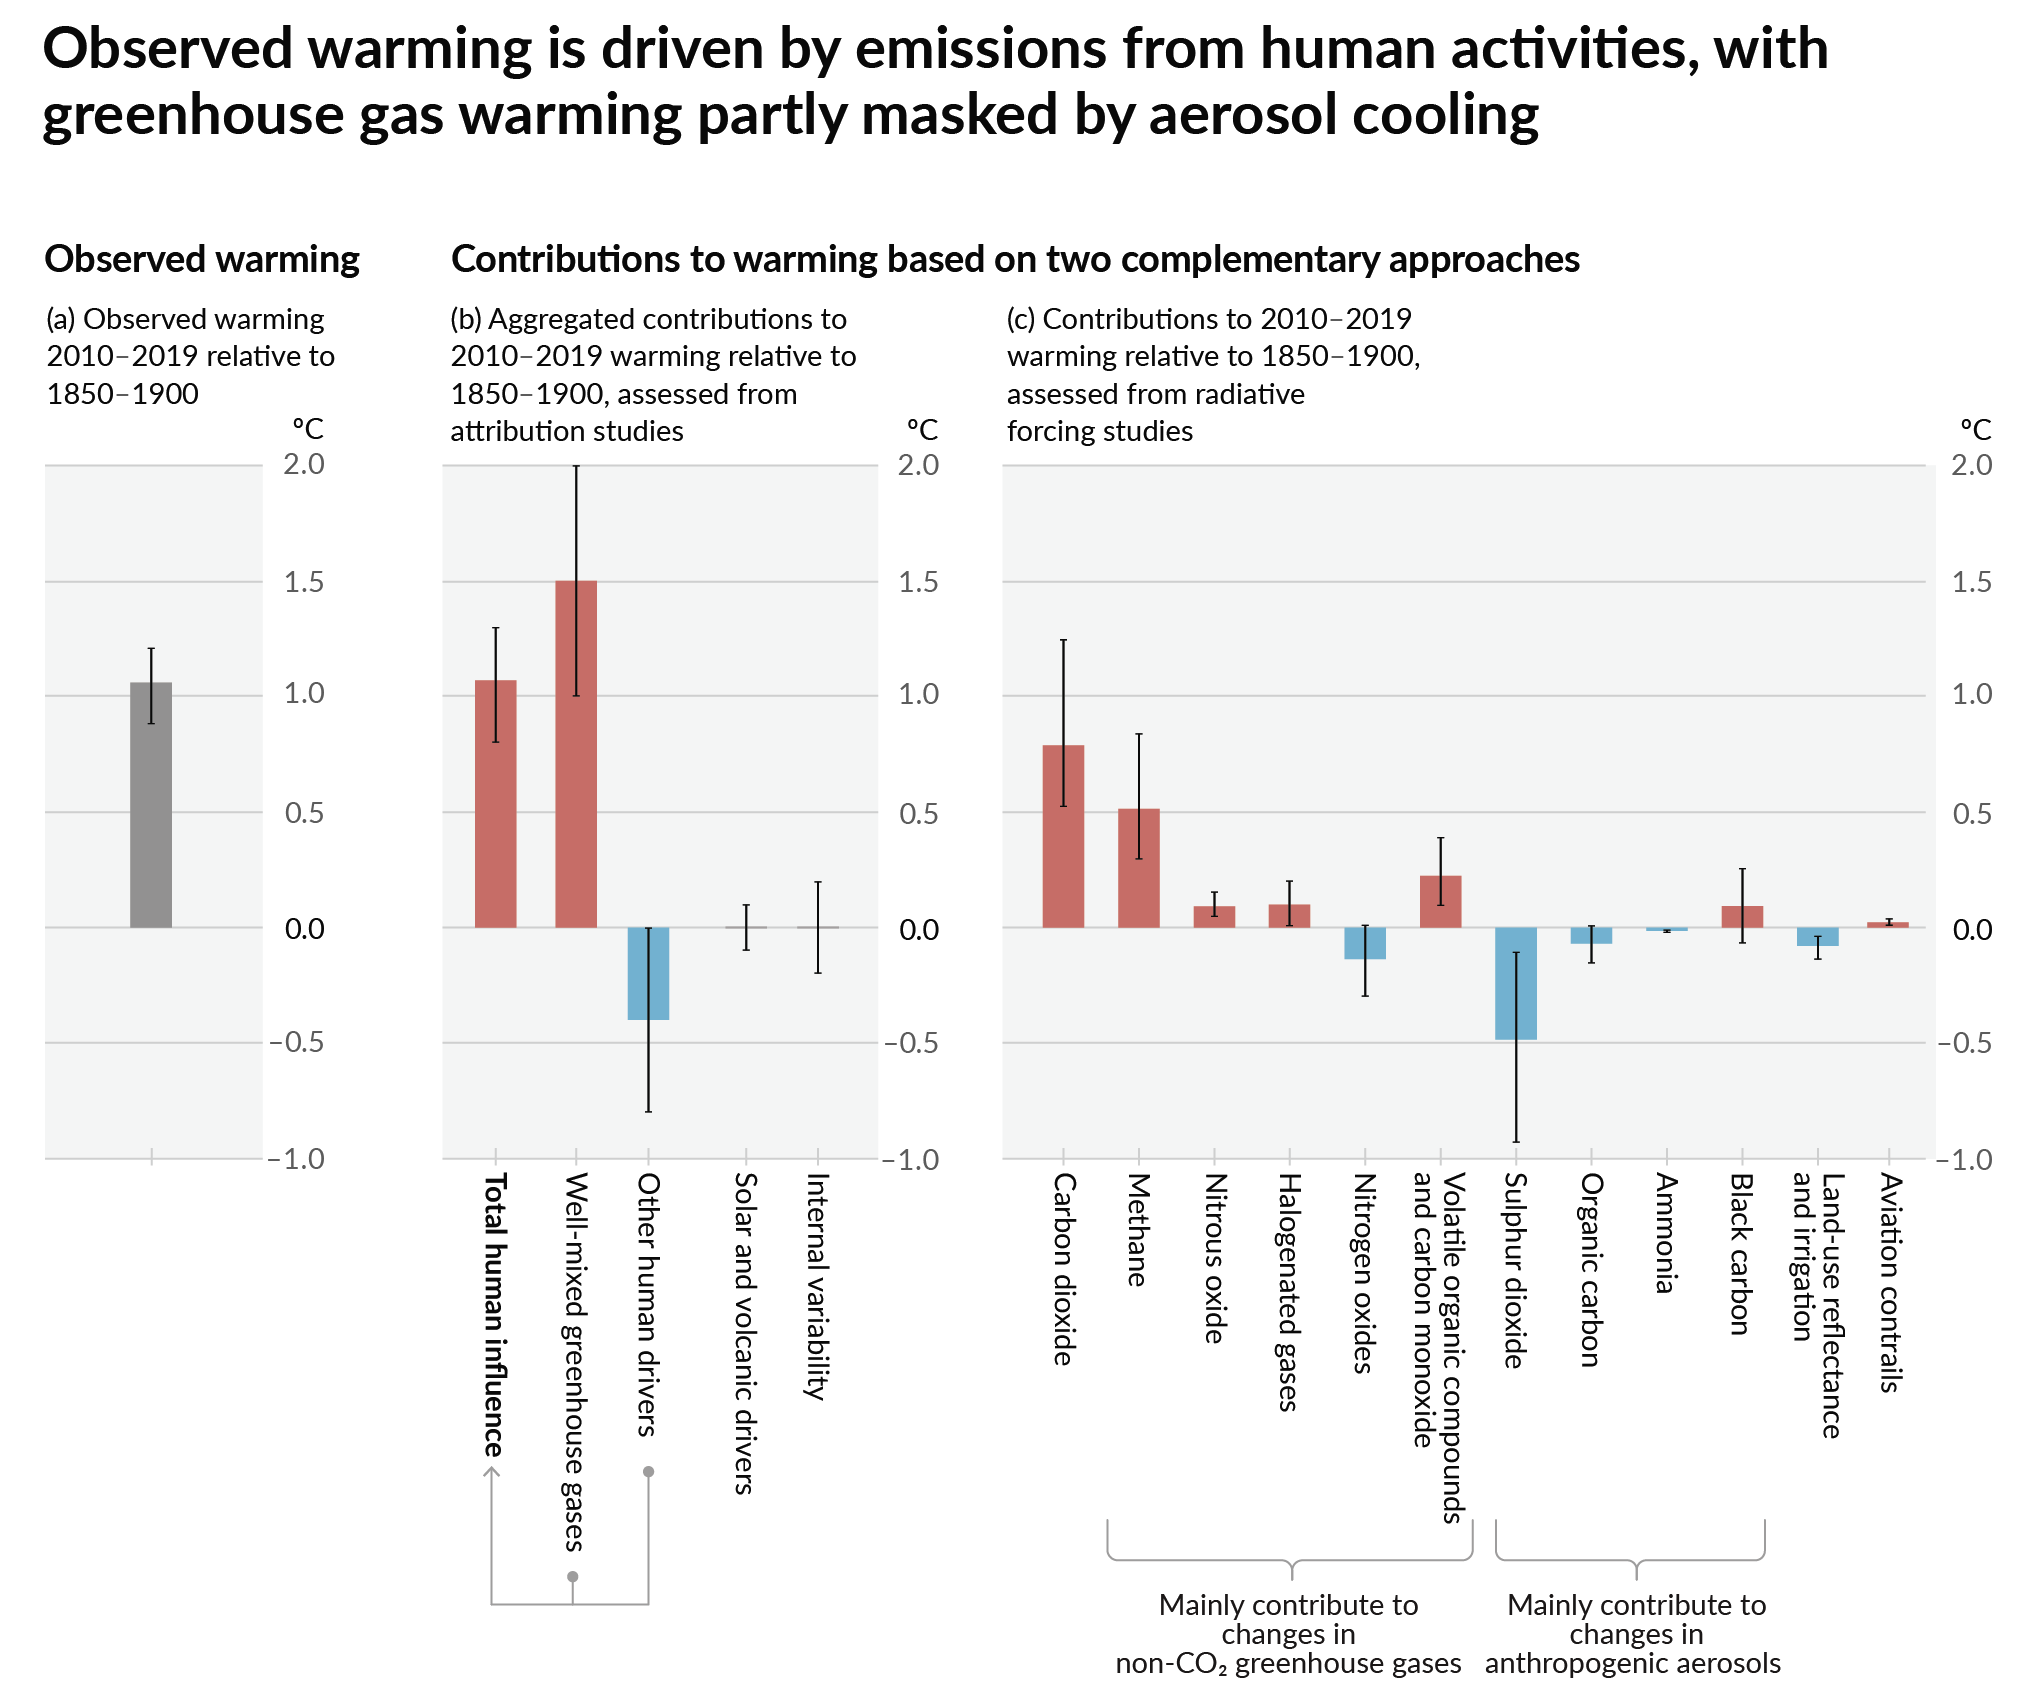
English: Contribution to observed climate change from 12 different drivers, as taken from the Summary for Policymakers of the sixth IPCC assessment report, adapted from figure SPM.2c.
|
| Date | |
| Source | Own work |
| Author | Eric Fisk |
| Other versions |
File:
Physical Drivers of climate change.svg has
2 embedded translations.
|


Licensing
- You are free:
- to share – to copy, distribute and transmit the work
- to remix – to adapt the work
- Under the following conditions:
- attribution – You must give appropriate credit, provide a link to the license, and indicate if changes were made. You may do so in any reasonable manner, but not in any way that suggests the licensor endorses you or your use.
- share alike – If you remix, transform, or build upon the material, you must distribute your contributions under the same or compatible license as the original.
File history
Click on a date/time to view the file as it appeared at that time.
| Date/Time | Thumbnail | Dimensions | User | Comment | |
|---|---|---|---|---|---|
| current | 09:03, 10 March 2024 |
| 960 × 893 (33 KB) | Hakimi97 | File uploaded using svgtranslate tool (https://svgtranslate.toolforge.org/). Added translation for ms. |
| 21:06, 18 November 2022 |
 | 960 × 893 (30 KB) | Efbrazil | Renamed "Land-use changes" to "Irrigation and albedo", as land use changes contributing to CO2 emissions are not included in the bar (they are in the CO2 bar) | |
| 06:36, 30 September 2022 |
 | 960 × 893 (30 KB) | আজিজ | File uploaded using svgtranslate tool (https://svgtranslate.toolforge.org/). Added translation for bn. | |
| 10:53, 10 September 2022 |
 | 960 × 893 (24 KB) | Theklan | File uploaded using svgtranslate tool (https://svgtranslate.toolforge.org/). Added translation for eu. | |
| 14:29, 19 April 2022 |
 | 960 × 893 (21 KB) | Jiaminglimjm | File uploaded using svgtranslate tool (https://svgtranslate.toolforge.org/). Added translation for id. | |
| 04:37, 10 January 2022 |
 | 960 × 893 (17 KB) | TAKAHASHI Shuuji | File uploaded using svgtranslate tool (https://svgtranslate.toolforge.org/). Added translation for ja. | |
| 21:33, 15 August 2021 |
 | 960 × 893 (13 KB) | Efbrazil | Source updated to AR6 / WG1 | |
| 15:56, 13 May 2020 |
 | 960 × 807 (11 KB) | Nyq | Decapitalized common nouns | |
| 18:47, 26 March 2020 |
 | 960 × 807 (11 KB) | Efbrazil | Tweaked positive color to match other chart color for consistency | |
| 21:55, 3 March 2020 |
 | 960 × 807 (11 KB) | Efbrazil | Rebuilt the graphic from data. Changes: - SVG now has native text for translation and selection - Combined "other gases" into single bar - Label tweaks for easier reading (e.g. CH4 --> Methane) |
File usage
- Atmospheric methane
- Carbon dioxide in Earth's atmosphere
- Causes of climate change
- Climate change
- Cloud feedback
- Gas venting
- Global dimming
- Greenhouse gas
- Radiative forcing
- Sulfur dioxide
- Talk:Climate change/Archive 76
- Talk:Climate change/Archive 93
- Talk:Global dimming
- Talk:Greenhouse gas
- User talk:InformationToKnowledge/sandbox
- Wikipedia:WikiProject Climate change/Figures
- Portal:Climate change
- Portal:Climate change/Selected article
- Portal:Climate change/Selected article/16
Global file usage
The following other wikis use this file:
- Usage on ar.wikipedia.org
- Usage on az.wikipedia.org
- Usage on bcl.wikipedia.org
- Usage on de.wikipedia.org
- Usage on dty.wikipedia.org
- Usage on el.wikipedia.org
- Usage on eu.wikipedia.org
- Usage on fa.wikipedia.org
- Usage on fr.wikipedia.org
- Usage on gl.wikipedia.org
- Usage on ha.wikipedia.org
- Usage on hi.wikipedia.org
- Usage on hi.wikibooks.org
- Usage on id.wikipedia.org
- Usage on ig.wikipedia.org
- Usage on is.wikipedia.org
- Usage on ko.wikipedia.org
- Usage on ms.wikipedia.org
- Usage on nl.wikipedia.org
- Usage on pt.wikipedia.org
- Usage on rw.wikipedia.org
- Usage on so.wikipedia.org
- Usage on sv.wikipedia.org
- Usage on te.wikipedia.org
- Usage on tr.wikipedia.org
- Usage on zh.wikipedia.org