
Original file (SVG file, nominally 1,417 × 1,163 pixels, file size: 5.49 MB)
| This is a file from the
Wikimedia Commons. Information from its
description page there is shown below. Commons is a freely licensed media file repository. You can help. |
Summary
| Description |
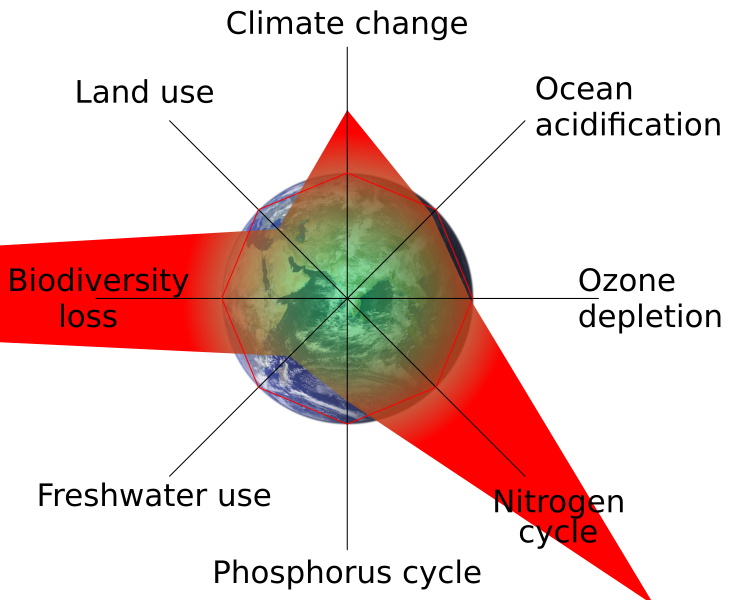
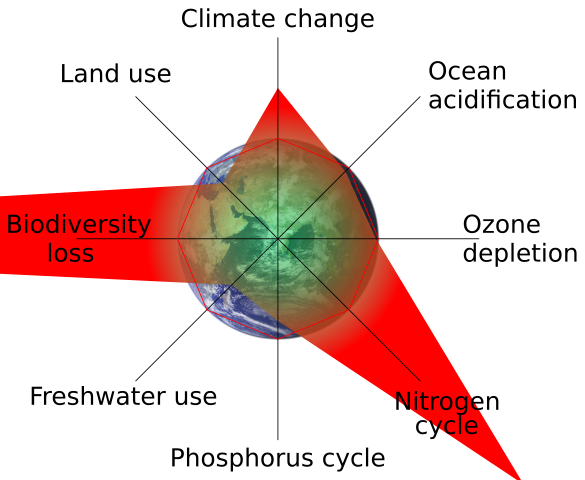
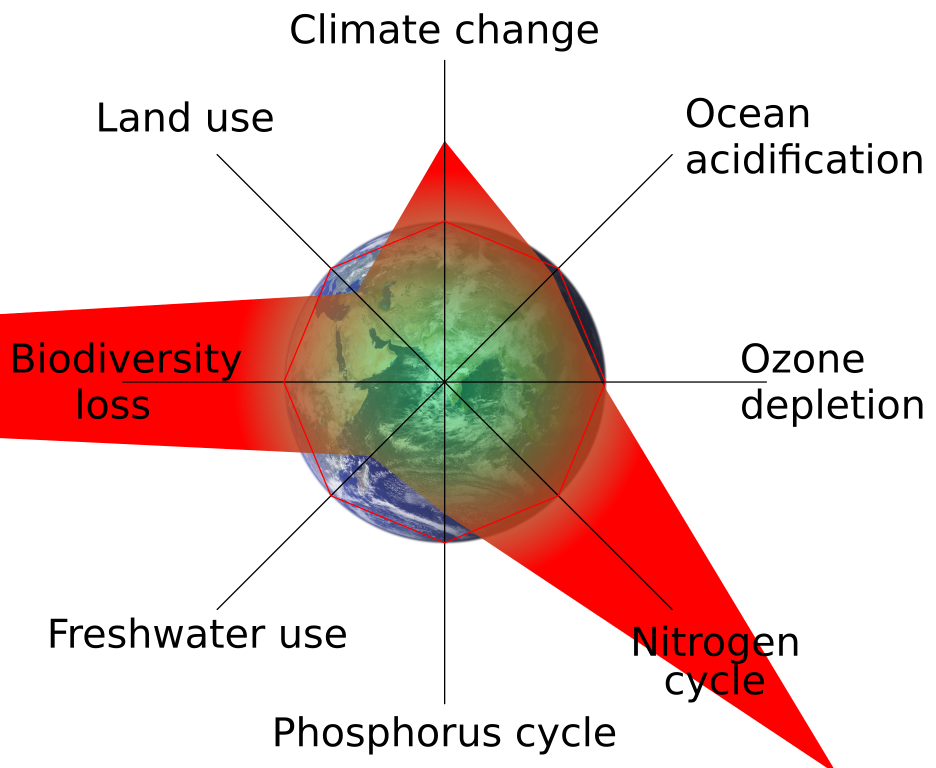
English: Plot of planetary boundaries according to Table 1 from
http://www.nature.com/nature/journal/v461/n7263/full/461472a.html Climate change is represented by the change in radiative forcing. The data plotted is the fraction current value/boundary, except for ocean acidification and ozone depletion where the reciprocal values were used because lower values are bad, not good as for the other axes. For the phosphorus cycle the mean value of 9 was used as 8.5–9.5 was given in the table. The two systems whose boundaries are not yet determined were left out. OTOH, nitrogen and phosphorus cycle are part of the same earth system as defined by the authors but were plotted seperately. Thanks to User:Epipelagic who had some good ideas. I confused two comments so it should be Epipelagic in the change history, too. Sorry for that. Picture of Earth is from NASA. |
| Date | |
| Source | Own work |
| Author | Christian Leichsenring |
| Other versions |
German translation
|

Licensing
- You are free:
- to share – to copy, distribute and transmit the work
- to remix – to adapt the work
- Under the following conditions:
- attribution – You must give appropriate credit, provide a link to the license, and indicate if changes were made. You may do so in any reasonable manner, but not in any way that suggests the licensor endorses you or your use.
- share alike – If you remix, transform, or build upon the material, you must distribute your contributions under the same or compatible license as the original.
File history
Click on a date/time to view the file as it appeared at that time.
| Date/Time | Thumbnail | Dimensions | User | Comment | |
|---|---|---|---|---|---|
| current | 15:40, 19 May 2013 |
| 1,417 × 1,163 (5.49 MB) | Mudd1 | Removed black contour which looked cheap in close-up. |
| 22:22, 10 October 2012 |
 | 1,417 × 1,163 (5.49 MB) | Mudd1 | Reverted to version as of 09:31, 22 June 2012 because black looks stupid in the article | |
| 22:21, 10 October 2012 |
 | 1,417 × 1,163 (5.61 MB) | Mudd1 | black background with stars seemed more fitting for Earth somehow | |
| 09:31, 22 June 2012 |
 | 1,417 × 1,163 (5.49 MB) | Mudd1 | Fixed the wrong axes and incorporated some ideas by [http://en.wikipedia.org/wiki/User:J._Johnson User:J. Johnson (JJ)]. | |
| 18:41, 23 February 2012 |
 | 1,283 × 1,009 (597 KB) | Mudd1 |
File usage
Global file usage
The following other wikis use this file:
- Usage on ar.wikipedia.org
- تصحر
- زراعة عضوية
- التصحر في الجزائر
- تلوث
- الاحتباس الحراري
- هندسة بيئية
- انفجار سكاني
- تغير المناخ
- تصنيع
- إزالة الغابات
- إعادة التحريج
- تقييم الأثر البيئي
- الطيران والبيئة
- قائمة القضايا البيئية
- انحلال التربة
- نضوب الأوزون
- استخدام الأرض
- تلوث وراثي
- تأثيرات تقنية النانو
- تلويث السفن
- تحمض المحيطات
- تدمير البيئة
- تأثير الإنسان على الشعاب المرجانية
- الأثر البيئي للخزانات والسدود
- بيئة الجزائر
- التأثير البيئي للدهان
- تأثير صيد الأسماك على البيئة
- أثر إنتاج اللحوم على البيئة
- أثر صناعة الفحم على البيئة
- انقراض الهولوسيني
- هندسة النظم البيئية
- دورة الفوسفور
- تأثير الإنسان على البيئة
- تدنية النفايات
- الأثر البيئي للتعدين
- جسيمات معلقة
- قالب:تأثير الإنسان على البيئة
- تأثير وسائل النقل على البيئة
- حدود كوكبية
- فرط الاستغلال
- انقراض الإنسان
- بوابة:كوارث/قوالب
- بوابة:كوارث
- تخفيف بيئي
- النحل والمواد الكيميائية السامة
- كارثة مالثوس
- اتفاقية ميناماتا بشأن الزئبق
- التأثير البيئي للطاقة النووية
- حقبة التأثير البشري
- الأثر البيئي للورق
View more global usage of this file.