Original file (1,037 × 739 pixels, file size: 72 KB, MIME type: image/jpeg)
Summary
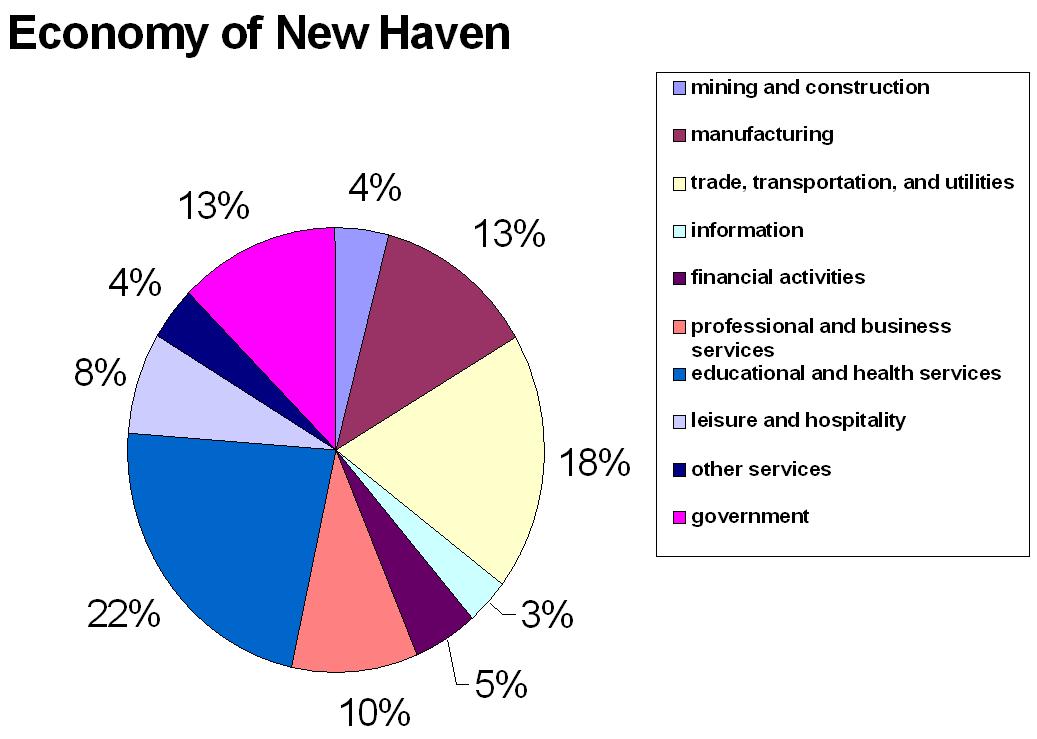
A pie chart made in Excel demonstrating the distribution of the economy of New Haven, Connecticut. Data taken from [1], using the following data:
mining and construction: 11,500
manufacturing: 34,000
trade, transportation, and utilities: 50,300
information: 8,700
financial activities: 14,100
professional and business services: 25,900
educational and health services: 61,700
leisure and hospitality: 20,500
other services: 10,500
government: 34,200
Licensing
 | I, the copyright holder of this work, hereby grant the permission to copy, distribute and/or modify this document under the terms of the GNU Free Documentation License, Version 1.2 or any later version published by the Free Software Foundation; with no Invariant Sections, no Front-Cover Texts, and no Back-Cover Texts. |
|
| This work is licensed under the
Creative Commons
Attribution-ShareAlike 3.0 License. This licensing tag was added to this file as part of the GFDL licensing update. |
 | This file is a candidate to be copied to
Wikimedia Commons.
Any user may perform this transfer; refer to Wikipedia:Moving files to Commons for details. If this file has problems with attribution, copyright, or is otherwise ineligible for Commons, then remove this tag and DO NOT transfer it; repeat violators may be blocked from editing. Other Instructions
| ||
| |||
| This media file is either in the public domain or published under a free license, and contains no inbound file links. If this media file is useful, then it should be transferred to the Wikimedia Commons. If this media is not useful, then please propose it for deletion or list it at files for discussion. |
File history
Click on a date/time to view the file as it appeared at that time.
| Date/Time | Thumbnail | Dimensions | User | Comment | |
|---|---|---|---|---|---|
| current | 01:51, 4 July 2007 |
| 1,037 × 739 (72 KB) | Loodog ( talk | contribs) | == Summary == A pie chart made in Excel demonstrating the distribution of the economy of New Haven, Connecticut. Data taken from [http://www.city-data.com/us-cities/The-Northeast/New-Haven-Economy.html], using the following data: mining and construc |
You cannot overwrite this file.