
Size of this preview:
799 × 599 pixels. Other resolutions:
320 × 240 pixels |
640 × 480 pixels |
1,024 × 768 pixels |
1,280 × 960 pixels |
1,750 × 1,313 pixels.
Original file (1,750 × 1,313 pixels, file size: 1.07 MB, MIME type: image/png)
| This is a file from the
Wikimedia Commons. Information from its
description page there is shown below. Commons is a freely licensed media file repository. You can help. |
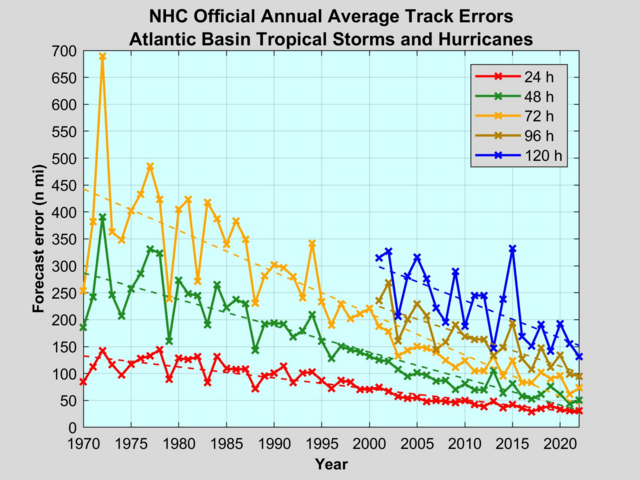
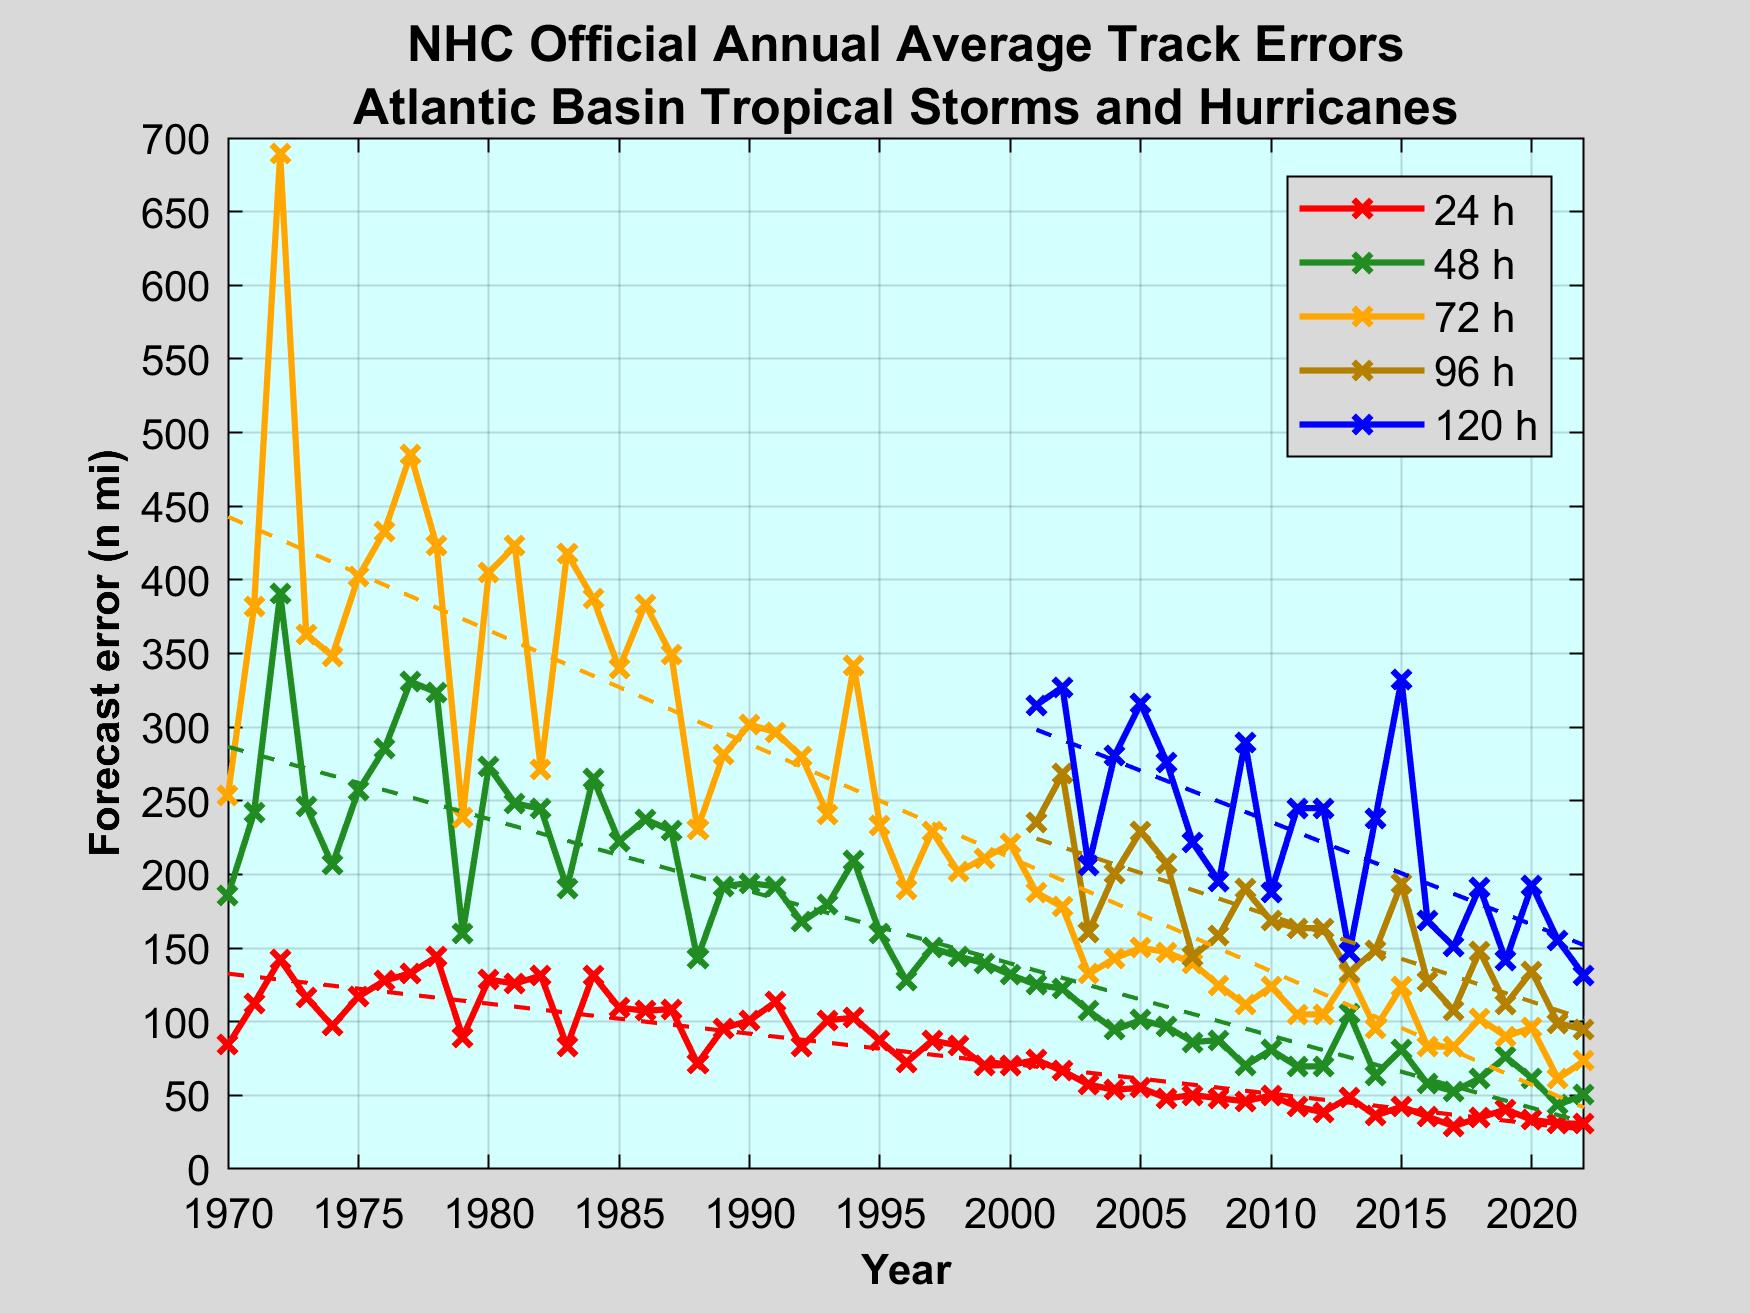
| Description | Error on the track since 1970 in Nautical miles. The different lines represent the forecasted position at different times prior to the verification (ex. 36h means the forecast made 36 h before the verification). |
| Date | (UTC) |
| Source | NOAA from National Hurricane Center Forecast Verification |
| Author | National Hurricane Center |
| Other versions | Image:NHC_Atlantic_Forecast_Error_Trends_FR.png |

|
This graph image could be re-created using
vector graphics as an
SVG file. This has several advantages; see
Commons:Media for cleanup for more information. If an SVG form of this image is available, please upload it and afterwards replace this template with
{{
vector version available|new image name}}
.
It is recommended to name the SVG file “NHC Atlantic Forecast Error Trends.svg”—then the template Vector version available (or Vva) does not need the new image name parameter. |
This image is in the
public domain because it contains materials that originally came from the U.S.
National Oceanic and Atmospheric Administration, taken or made as part of an employee's official duties.
|
File history
Click on a date/time to view the file as it appeared at that time.
| Date/Time | Thumbnail | Dimensions | User | Comment | |
|---|---|---|---|---|---|
| current | 17:37, 17 March 2021 |
| 1,750 × 1,313 (1.07 MB) | Femke | Update to around 2019 |
| 21:35, 24 August 2015 |
 | 2,400 × 1,800 (1.85 MB) | Pierre cb | Updated data up to 2014 | |
| 03:25, 27 May 2009 |
 | 1,210 × 950 (46 KB) | Pierre cb | Updated data from 1970 to 2007 | |
| 13:40, 26 May 2009 |
 | 1,210 × 950 (28 KB) | Mahahahaneapneap | Compressed | |
| 03:21, 28 January 2008 |
 | 1,210 × 950 (57 KB) | Pierre cb | {{Information |Description=Errror on the track since 1970 in Nautical miles. |Source= [http://www.nhc.noaa.gov/verification/figs/Early_model_ATL_trk_error_trend.gif NOAA] |Date=~~~~~ |Author=~~~ |Permission= |other_versions=[[:Image:NHC_Atlantic_Forecast |
File usage
The following pages on the English Wikipedia use this file (pages on other projects are not listed):
Global file usage
The following other wikis use this file:
- Usage on hi.wikipedia.org
- Usage on pt.wikipedia.org
- Usage on ru.wikipedia.org
- Usage on simple.wikipedia.org
- Usage on th.wikipedia.org
- Usage on zh.wikipedia.org