Size of this preview:
582 × 600 pixels. Other resolutions:
233 × 240 pixels |
466 × 480 pixels |
1,005 × 1,036 pixels.
Original file (1,005 × 1,036 pixels, file size: 268 KB, MIME type: image/jpeg)
| This is a file from the
Wikimedia Commons. Information from its
description page there is shown below. Commons is a freely licensed media file repository. You can help. |
Summary
| Description |
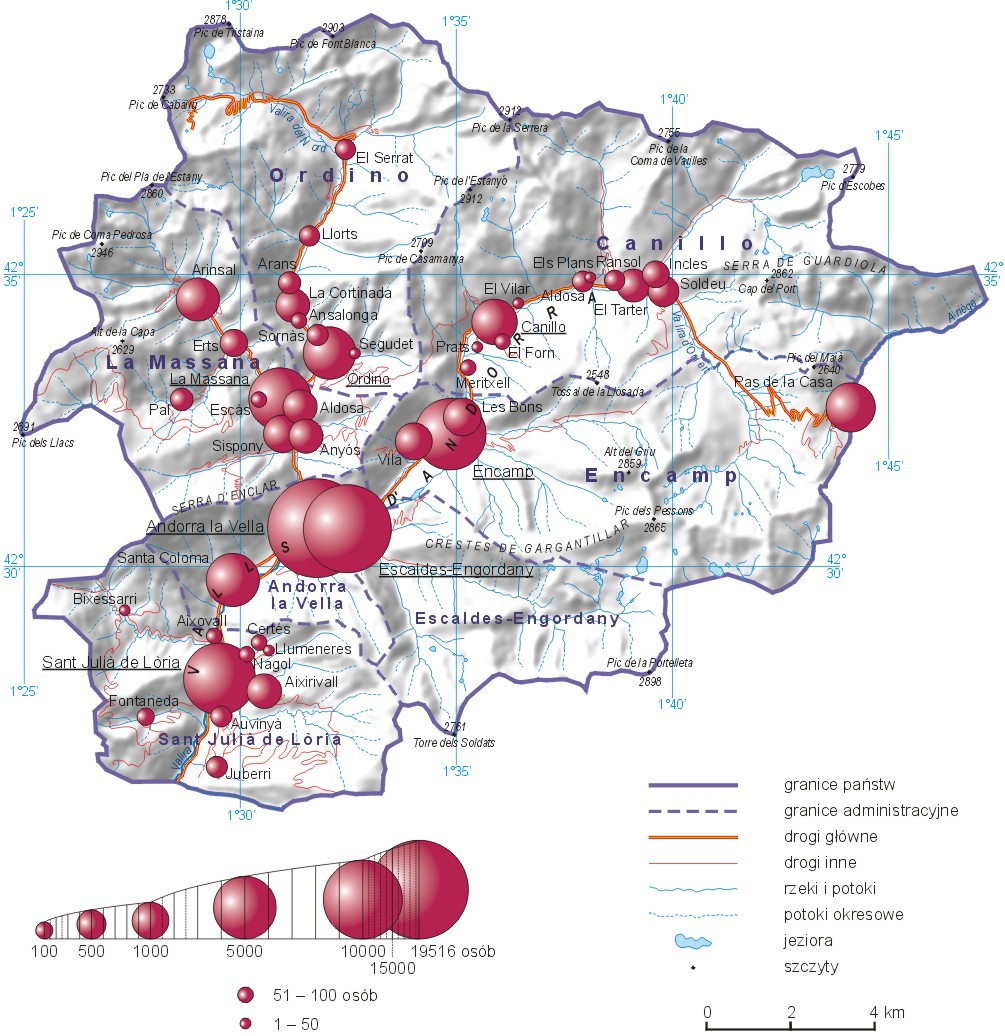
Polski: Liczba ludności w miejscowościach Andory w 2013 roku (przykład mapy, na której połączono metodę kartodiagramu oraz metody jakościowe) |
| Date | |
| Source | Prezentacja danych na mapach. in: Marek Pieniążek, Barbara Szejgiec, Maciej Zych: Graficzna prezentacja danych statystycznych. Wykresy, mapy, GIS. Warszawa: Główny Urząd Statystyczny, 2014 [1] |
| Author | Maciej Zych |
Licensing
This file is licensed under the
Creative Commons
Attribution 3.0 Unported license.
- You are free:
- to share – to copy, distribute and transmit the work
- to remix – to adapt the work
- Under the following conditions:
- attribution – You must give appropriate credit, provide a link to the license, and indicate if changes were made. You may do so in any reasonable manner, but not in any way that suggests the licensor endorses you or your use.
File history
Click on a date/time to view the file as it appeared at that time.
| Date/Time | Thumbnail | Dimensions | User | Comment | |
|---|---|---|---|---|---|
| current | 13:43, 24 January 2015 |
| 1,005 × 1,036 (268 KB) | Aotearoa | =={{int:filedesc}}== {{Information |description={{pl|1=Liczba ludności w miejscowościach Andory w 2013 roku (przykład mapy, na której połączono metodę kartodiagramu oraz metody jakościowe)}} |date=2015-01-24 |source=Prezentacja danych na mapach... |
File usage
The following pages on the English Wikipedia use this file (pages on other projects are not listed):
Global file usage
The following other wikis use this file:
- Usage on fr.wikipedia.org
- Usage on mk.wikipedia.org
- Usage on pl.wikipedia.org
- Usage on tum.wikipedia.org
- Usage on uk.wikipedia.org
- Usage on ur.wikipedia.org
- Usage on www.wikidata.org