No higher resolution available.
Melbourne_City_Heatwave_Min_&_Max_Temps_09_(Concept).png (606 × 567 pixels, file size: 66 KB, MIME type: image/png)
| This is a file from the
Wikimedia Commons. Information from its
description page there is shown below. Commons is a freely licensed media file repository. You can help. |
.png)
Summary
| Description |
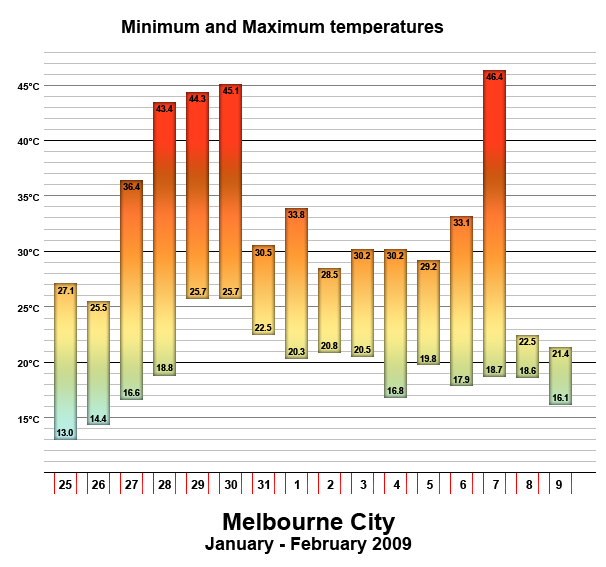
English: A graph of the minimum and maximum temperatures recorded in
Melbourne City,
Victoria during the
2009 Southeastern Australia heat wave. |
| Date | |
| Source | Graph made by Bidgee with data based from the Bureau of Meteorology |
| Author | Made by Bidgee based on the graph made by Nick carson |
Licensing
| I, the copyright holder of this work, release this work into the
public domain. This applies worldwide. In some countries this may not be legally possible; if so: I grant anyone the right to use this work for any purpose, without any conditions, unless such conditions are required by law. |
File history
Click on a date/time to view the file as it appeared at that time.
| Date/Time | Thumbnail | Dimensions | User | Comment | |
|---|---|---|---|---|---|
| current | 07:16, 11 February 2009 |
| 606 × 567 (66 KB) | Bidgee | == Summary == {{Information |Description={{en|1=A graph of the minimum and maximum temperatures recorded in Melbourne City, Victoria during the [[w:2009 Southeastern Australia heat wave|2009 Southeastern Australia heat wave] |
File usage
The following pages on the English Wikipedia use this file (pages on other projects are not listed):
Global file usage
The following other wikis use this file:
- Usage on de.wikipedia.org
- Usage on es.wikipedia.org
- Usage on fr.wikipedia.org
- Usage on pt.wikipedia.org
- Usage on ru.wikipedia.org
- Usage on simple.wikipedia.org
- Usage on uk.wikipedia.org
.png)