
Size of this PNG preview of this SVG file:
800 × 400 pixels. Other resolutions:
320 × 160 pixels |
640 × 320 pixels |
1,024 × 512 pixels |
1,280 × 640 pixels |
2,560 × 1,280 pixels.
Original file (SVG file, nominally 1,024 × 512 pixels, file size: 42 KB)
![]() ✓
The source code of this
SVG is
valid.
✓
The source code of this
SVG is
valid.
Summary
| Description |
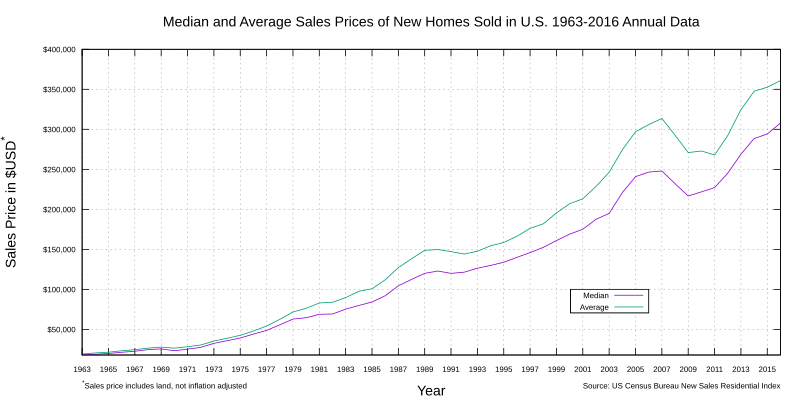
A graph showing the "Median and Average Sales Prices of New Homes Sold in United States". It shows the annual data from 1963 through 2016. It should be noted that the sales price includes the land. This graph is made using the data from https://www.census.gov/construction/nrs/pdf/uspriceann.pdf |
|---|---|
| Source | |
| Date | |
| Author |
US Census Bureau |
| Permission ( Reusing this file) |
See below.
|
Licensing
| This image is a work of a United States Census Bureau employee, taken or made as part of that person's official duties. As a work of the U.S. federal government, the image is in the public domain in the United States. |
 |
File history
Click on a date/time to view the file as it appeared at that time.
| Date/Time | Thumbnail | Dimensions | User | Comment | |
|---|---|---|---|---|---|
| current | 10:37, 25 November 2023 |
| 1,024 × 512 (42 KB) | Minorax ( talk | contribs) | fix // Editing SVG source code using c:User:Rillke/SVGedit.js |
| 22:42, 17 January 2018 |
 | 1,024 × 512 (42 KB) | Ninel ( talk | contribs) | Uploading a public-domain item using File Upload Wizard |
You cannot overwrite this file.
File usage
The following pages on the English Wikipedia use this file (pages on other projects are not listed):