Original file (1,425 × 625 pixels, file size: 29 KB, MIME type: image/png)
| This is a file from the
Wikimedia Commons. Information from its
description page there is shown below. Commons is a freely licensed media file repository. You can help. |
Summary
| Description |
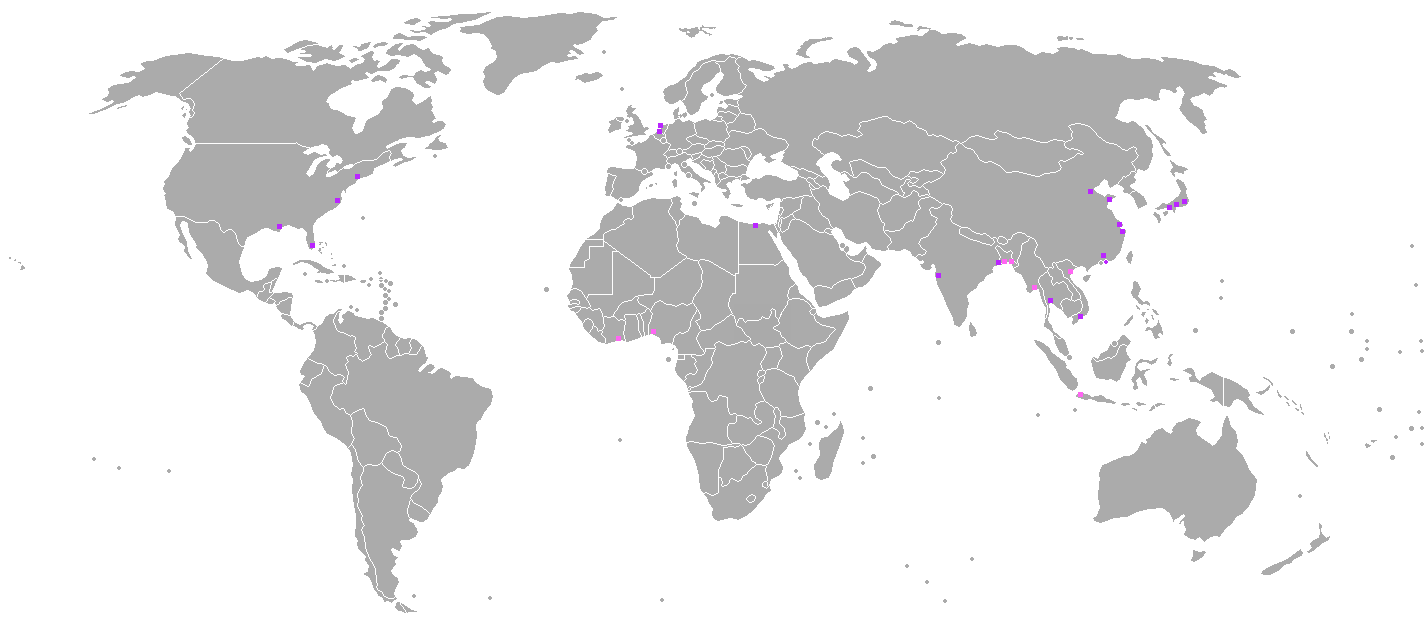
English: Map showing the
major cities (in terms of assets and population) that are under threat by the rising sea level. The cities indicated are under threat of even a small
sea level rise (of 1.6 foot/49 cm) compared to the level in 2010). Even moderate projections indicate that such a rise will have occured by 2060
[1]
[2]
The map was based on data of a 2007 OECD report [3] [4] The report also stated that the total value of the assets exposed in 2005 across all cities is about US$3,000 billion. The top 20 cities in the world in terms of assets exposed to coastal flooding was marked in purple; additional cities that are in the top 20 in terms of population exposed to coastal flooding were marked in pink (there are only 27 cities on the whole map since these cities that have the largest amount of assets exposed to it also have the most people exposed to it). The list of the top 20 cities exposed to coastal flooding is:
The list of 7 additional cities that are in the top 20 most-populous cities exposed to coastal flooding is:
|
| Date | |
| Source | Own work |
| Author | Genetics4good |
Licensing
- You are free:
- to share – to copy, distribute and transmit the work
- to remix – to adapt the work
- Under the following conditions:
- attribution – You must give appropriate credit, provide a link to the license, and indicate if changes were made. You may do so in any reasonable manner, but not in any way that suggests the licensor endorses you or your use.
- share alike – If you remix, transform, or build upon the material, you must distribute your contributions under the same or compatible license as the original.
- ↑ File:Projections of global mean sea level rise by Parris et al. (2012).png
- ↑ Sea level rise chart
- ↑ 2007 OECD report
- ↑ OECD report, shortened version
.png)
File history
Click on a date/time to view the file as it appeared at that time.
| Date/Time | Thumbnail | Dimensions | User | Comment | |
|---|---|---|---|---|---|
| current | 23:31, 10 January 2016 |
| 1,425 × 625 (29 KB) | Magog the Ogre | Reverted to version as of 12:52, 2 November 2013 (UTC) |
| 12:52, 2 November 2013 |
 | 1,425 × 625 (29 KB) | Genetics4good | User created page with UploadWizard |
File usage
Global file usage
The following other wikis use this file:
- Usage on en.wikiquote.org
- Usage on es.wikipedia.org
- Usage on ig.wikipedia.org
- Usage on mk.wikipedia.org
- Usage on zh.wikipedia.org