
Size of this PNG preview of this SVG file:
600 × 480 pixels. Other resolutions:
300 × 240 pixels |
960 × 768 pixels |
1,280 × 1,024 pixels |
2,560 × 2,048 pixels.
Original file (SVG file, nominally 600 × 480 pixels, file size: 40 KB)
| This is a file from the
Wikimedia Commons. Information from its
description page there is shown below. Commons is a freely licensed media file repository. You can help. |
Summary
| Description |
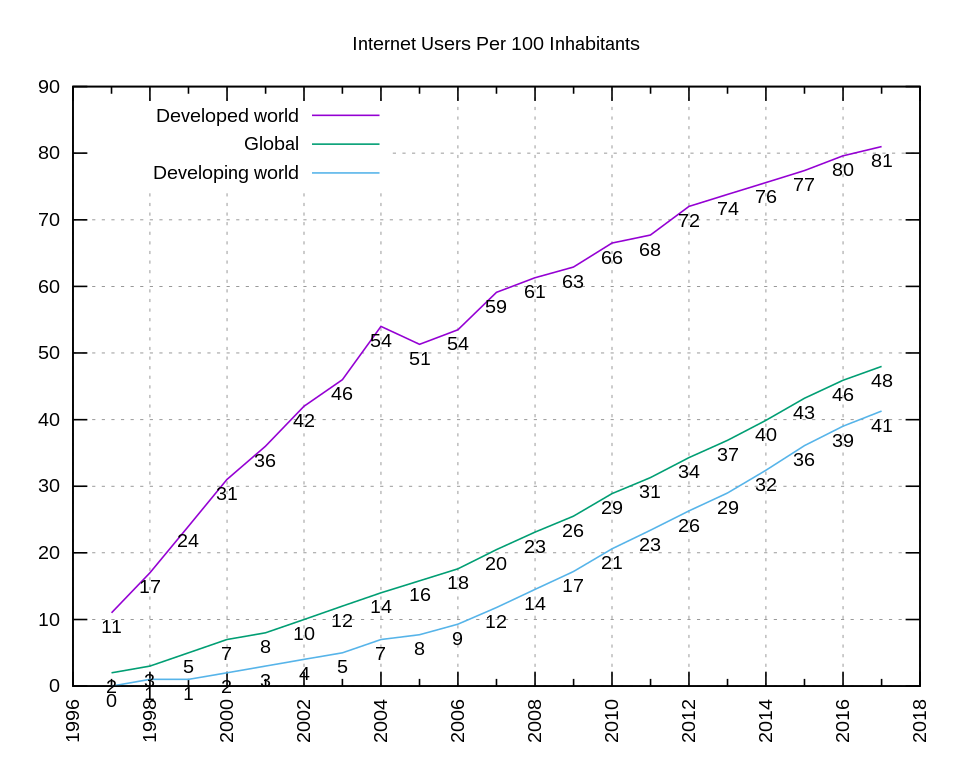
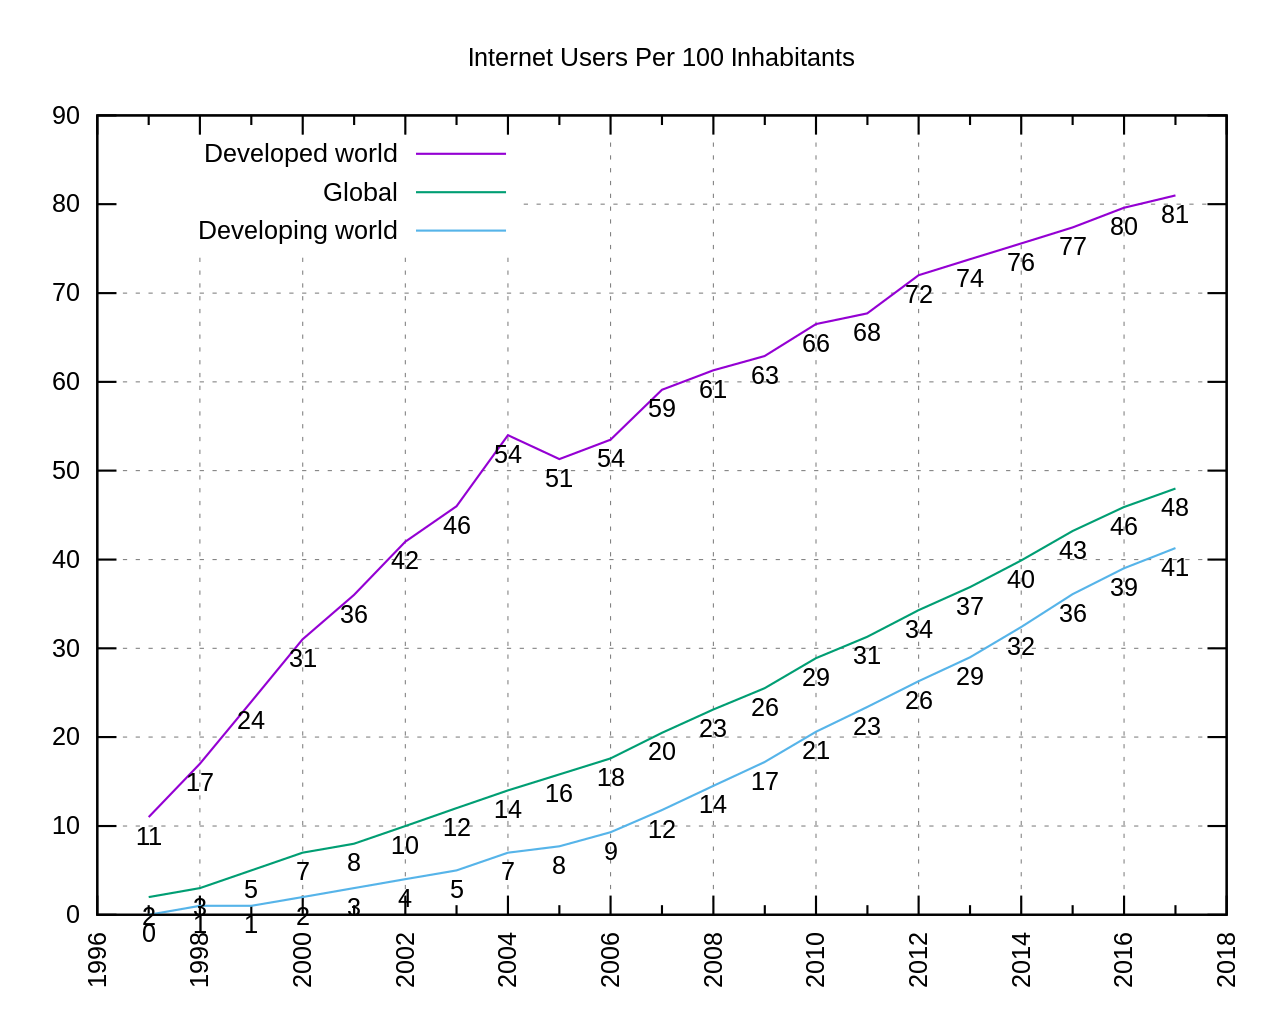
English: Graph of "Internet users per 100 inhabitants 1997 to 2017", years on the x axis, number of users on the y axis, according to the International Telecommunication Union (ITU)
Español: Gráfica que indica "Número de usuarios de Internet cada 100 habitantes", período 1997-2017. |
| Date | |
| Source | Own work |
| Author | Jeff Ogden (W163) and Jim Scarborough (Ke4roh) |
| Other versions | This is an updated version of File:Internet users per 100 inhabitants 1997-2007 ITU.svg |
Data represented in this chart, references for each year's data, and the script to generate the graph are on Github
Licensing
I, the copyright holder of this work, hereby publish it under the following license:
This file is licensed under the
Creative Commons
Attribution-Share Alike 3.0 Unported license.
- You are free:
- to share – to copy, distribute and transmit the work
- to remix – to adapt the work
- Under the following conditions:
- attribution – You must give appropriate credit, provide a link to the license, and indicate if changes were made. You may do so in any reasonable manner, but not in any way that suggests the licensor endorses you or your use.
- share alike – If you remix, transform, or build upon the material, you must distribute your contributions under the same or compatible license as the original.
File history
Click on a date/time to view the file as it appeared at that time.
| Date/Time | Thumbnail | Dimensions | User | Comment | |
|---|---|---|---|---|---|
| current | 18:41, 15 March 2019 |
| 600 × 480 (40 KB) | Ke4roh | data through 2018 |
| 13:14, 2 October 2017 |
 | 600 × 480 (40 KB) | Ke4roh | minor formatting, series label wording | |
| 04:23, 1 October 2017 |
 | 1,267 × 691 (44 KB) | Ke4roh | correct the title | |
| 03:59, 1 October 2017 |
 | 1,267 × 691 (44 KB) | Ke4roh | Update for 2017, data fresh from ITU (there were minor changes) | |
| 01:58, 26 May 2015 |
 | 1,267 × 691 (183 KB) | W163 | Add estimated figures for 2014, replace estimated figures for 2012 and 2013 with final figures. | |
| 00:47, 4 June 2013 |
 | 1,267 × 691 (178 KB) | W163 | Third try. Remove <flowroot> and <flowregion> tags to see if that gets rid of the "black boxes" that appear when RSVG renders the file. | |
| 19:42, 3 June 2013 |
 | 1,267 × 691 (210 KB) | W163 | Fix some font problems from previous version. | |
| 18:31, 3 June 2013 |
 | 1,267 × 691 (272 KB) | W163 | Update to most recent figures from the ITU, include ITU estimates for 2012 and 2013, remove English title and y-axis label to make non-English use easier. | |
| 14:46, 5 April 2012 |
 | 1,136 × 749 (362 KB) | W163 |
File usage
The following pages on the English Wikipedia use this file (pages on other projects are not listed):
Global file usage
The following other wikis use this file:
- Usage on ar.wikipedia.org
- Usage on cs.wikipedia.org
- Usage on de.wikipedia.org
- Usage on es.wikipedia.org
- Usage on fa.wikipedia.org
- Usage on fi.wikipedia.org
- Usage on fr.wikipedia.org
- Usage on hi.wikipedia.org
- Usage on hy.wikipedia.org
- Usage on id.wikipedia.org
- Usage on incubator.wikimedia.org
- Usage on it.wikipedia.org
- Usage on mk.wikipedia.org
- Usage on my.wikipedia.org
- Usage on pnb.wikipedia.org
- Usage on pt.wikipedia.org
- Usage on rm.wikipedia.org
- Usage on tr.wikipedia.org
- Usage on tt.wikipedia.org
- Usage on ur.wikipedia.org
- Usage on uz.wikipedia.org
- Usage on vi.wikipedia.org
- Usage on zh.wikipedia.org