Size of this preview:
800 × 453 pixels. Other resolutions:
320 × 181 pixels |
640 × 362 pixels |
1,024 × 580 pixels |
1,392 × 788 pixels.
Original file (1,392 × 788 pixels, file size: 78 KB, MIME type: image/png)
| This is a file from the
Wikimedia Commons. Information from its
description page there is shown below. Commons is a freely licensed media file repository. You can help. |
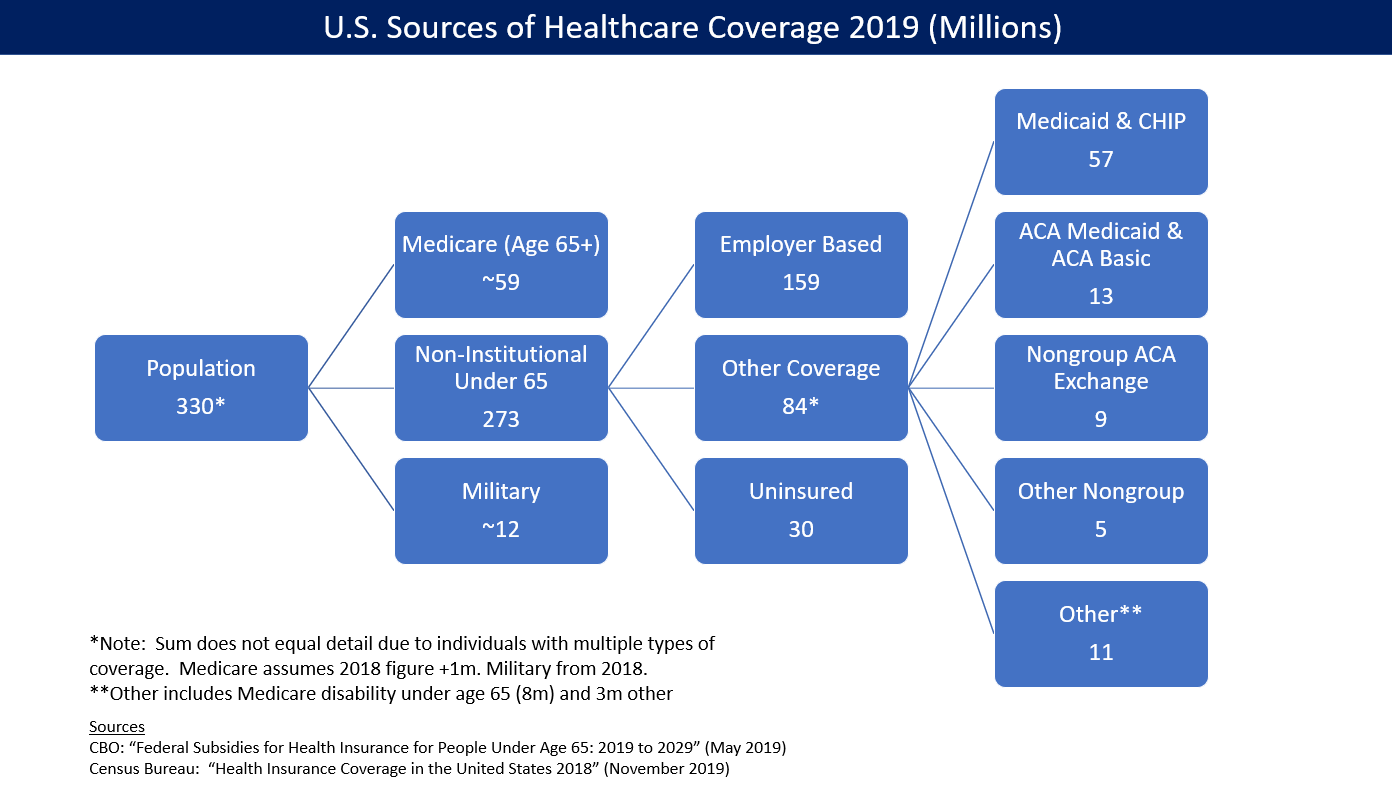
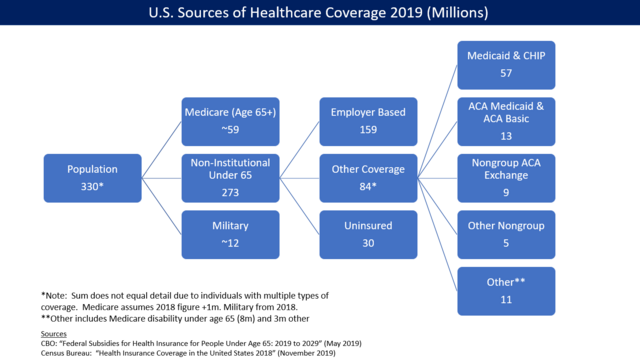
Understanding the chart
The health insurance coverage statistics are made more complex because of persons with multiple forms of coverage (e.g., both employer-provided insurance and Medicaid).
- A primary source for the graphic is from the CBO, which estimated the 2016 amounts for the under 65 group in March 2016. [1]
- The total U.S. population in 2016 was about 324m according to FRED. [2] However, due to the problem with multiple forms of coverage, components in the second layer add up to 340.
- Another source for the Medicare and Military figures is from the Census Bureau. [3]
Neither source presents the complete picture and they are for different time periods, so the diagram should be used as approximations rather than exact portrayal of the figures as of the end of 2016.
Summary
| Description |
English: U.S. health insurance coverage by source in 2016. CBO estimated ACA/Obamacare was responsible for 23 million persons covered via exchanges and Medicaid expansion. |
| Date | |
| Source | Own work |
| Author | Farcaster |
Licensing
I, the copyright holder of this work, hereby publish it under the following license:
This file is licensed under the
Creative Commons
Attribution-Share Alike 4.0 International license.
- You are free:
- to share – to copy, distribute and transmit the work
- to remix – to adapt the work
- Under the following conditions:
- attribution – You must give appropriate credit, provide a link to the license, and indicate if changes were made. You may do so in any reasonable manner, but not in any way that suggests the licensor endorses you or your use.
- share alike – If you remix, transform, or build upon the material, you must distribute your contributions under the same or compatible license as the original.
- ↑ CBO-Federal Subsidies for Health Insurance Coverage for People Under Age 65: 2016 to 2026-March 2016
- ↑ FRED-Total Population
- ↑ Health Insurance Coverage in the United States:2015-Issued September 2016
File history
Click on a date/time to view the file as it appeared at that time.
| Date/Time | Thumbnail | Dimensions | User | Comment | |
|---|---|---|---|---|---|
| current | 19:42, 10 January 2020 |
| 1,392 × 788 (78 KB) | Farcaster | Updated for 2019 |
| 17:21, 25 August 2017 |
 | 1,247 × 704 (119 KB) | Farcaster | Updated information | |
| 15:22, 30 July 2017 |
 | 1,238 × 693 (172 KB) | Farcaster | User created page with UploadWizard |
File usage
The following pages on the English Wikipedia use this file (pages on other projects are not listed):
Global file usage
The following other wikis use this file:
- Usage on tr.wikipedia.org
- Usage on uz.wikipedia.org
- Usage on vi.wikipedia.org
- Usage on zh.wikipedia.org