Size of this preview:
800 × 534 pixels. Other resolutions:
320 × 214 pixels |
640 × 428 pixels |
1,024 × 684 pixels |
1,205 × 805 pixels.
Original file (1,205 × 805 pixels, file size: 52 KB, MIME type: image/png)
| This is a file from the
Wikimedia Commons. Information from its
description page there is shown below. Commons is a freely licensed media file repository. You can help. |

|
This graph image could be re-created using
vector graphics as an
SVG file. This has several advantages; see
Commons:Media for cleanup for more information. If an SVG form of this image is available, please upload it and afterwards replace this template with
{{
vector version available|new image name}}
.
It is recommended to name the SVG file “Global plug-in car sales since 2011.svg”—then the template Vector version available (or Vva) does not need the new image name parameter. |
Summary
Licensing
I, the copyright holder of this work, hereby publish it under the following license:
This file is licensed under the
Creative Commons
Attribution-Share Alike 4.0 International license.
- You are free:
- to share – to copy, distribute and transmit the work
- to remix – to adapt the work
- Under the following conditions:
- attribution – You must give appropriate credit, provide a link to the license, and indicate if changes were made. You may do so in any reasonable manner, but not in any way that suggests the licensor endorses you or your use.
- share alike – If you remix, transform, or build upon the material, you must distribute your contributions under the same or compatible license as the original.
Issues
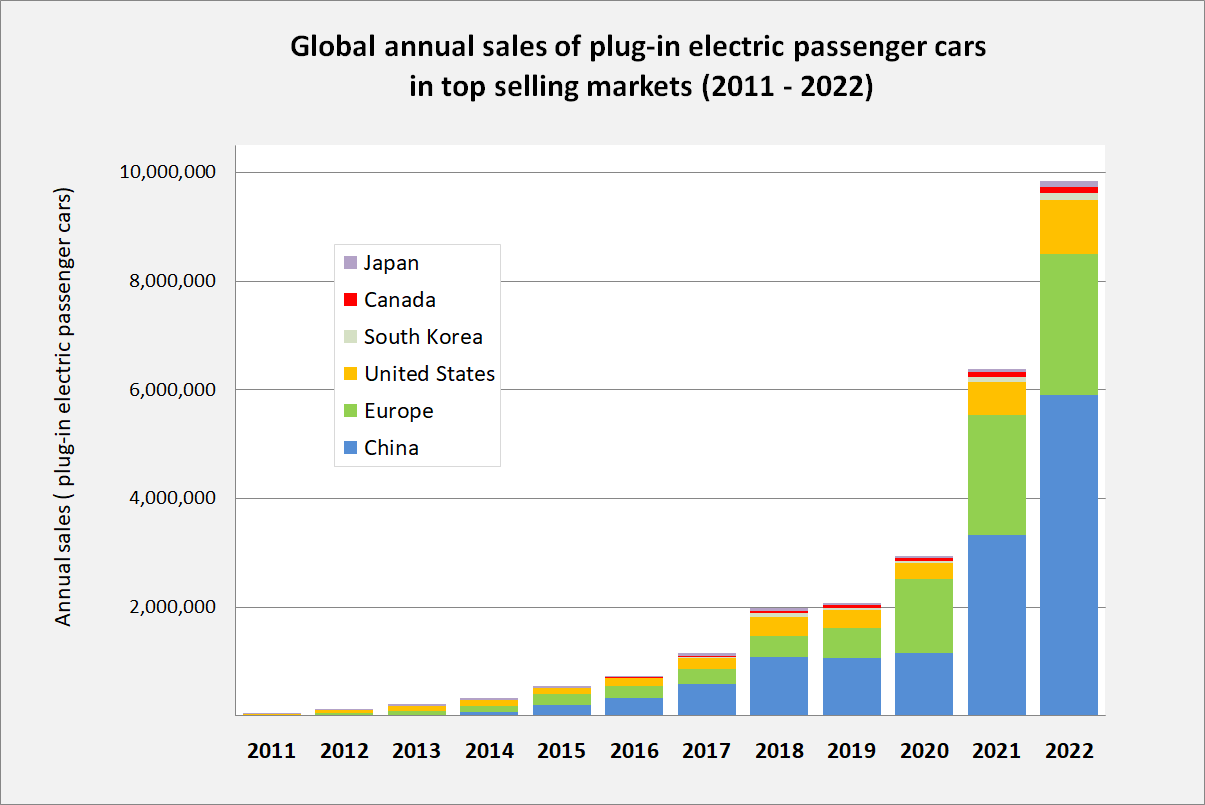
- The line between Japan and Canada is hard to find due to similarity in color.
File history
Click on a date/time to view the file as it appeared at that time.
| Date/Time | Thumbnail | Dimensions | User | Comment | |
|---|---|---|---|---|---|
| current | 04:31, 12 May 2023 |
| 1,205 × 805 (52 KB) | Mariordo | Added sales figures for 2022 from the IEA. South Korea was added to the graph from 2011 |
| 20:20, 22 January 2022 |
 | 1,180 × 784 (51 KB) | Mariordo | Updated with June 2021 figures (same sources) | |
| 04:47, 20 January 2021 |
 | 1,139 × 807 (51 KB) | Mariordo | Updated with preliminary 2020 figures | |
| 02:40, 16 June 2020 |
 | 1,139 × 809 (52 KB) | Mariordo | Previous version had some preliminary figures. This one has the final sales figures from the IEA 2020 EV Outlook | |
| 03:51, 11 May 2020 |
 | 1,145 × 808 (53 KB) | Mariordo | Updated with EIA figures for 2018 and revised for 2017, 2019 Europe from ACEA, and the other 2019 figures from the same sources as before | |
| 05:37, 2 February 2019 |
 | 1,106 × 836 (52 KB) | Mariordo | Updated with 2018 sales figures + minor design changes | |
| 02:08, 24 October 2018 |
 | 1,106 × 817 (50 KB) | Mariordo | Sources consolidated to reduce inconsistencies and adjusted to show only plug-in electric passenger cars (European figures had over 40K light-duty vans included). Now it compares apples to apples. | |
| 22:20, 1 February 2018 |
 | 1,113 × 822 (51 KB) | Mariordo | Graph updated to add 2017 registration figures + introducing revised figures for Japan and China from another reliable source. | |
| 18:07, 18 January 2017 |
 | 1,250 × 757 (49 KB) | Mariordo | Graph was updated with annual sales for 2016 (same countries/regions). Raised issued was attended using darker color for Canada. 2016 sales figures from a different source as note in file description. | |
| 00:22, 30 March 2016 |
 | 1,187 × 731 (46 KB) | Mariordo | User created page with UploadWizard |
File usage
The following pages on the English Wikipedia use this file (pages on other projects are not listed):
Global file usage
The following other wikis use this file:
- Usage on ar.wikipedia.org
- Usage on ast.wikipedia.org
- Usage on el.wikipedia.org
- Usage on es.wikipedia.org
- Usage on gl.wikipedia.org
- Usage on it.wikipedia.org
- Usage on or.wikipedia.org
- Usage on pnb.wikipedia.org
- Usage on pt.wikipedia.org
- Usage on ur.wikipedia.org
- Usage on vi.wikipedia.org