
Size of this PNG preview of this SVG file:
800 × 600 pixels. Other resolutions:
320 × 240 pixels |
640 × 480 pixels |
1,024 × 768 pixels |
1,280 × 960 pixels |
2,560 × 1,920 pixels |
960 × 720 pixels.
Original file (SVG file, nominally 960 × 720 pixels, file size: 22 KB)
| This is a file from the
Wikimedia Commons. Information from its
description page there is shown below. Commons is a freely licensed media file repository. You can help. |
Summary
| Description |
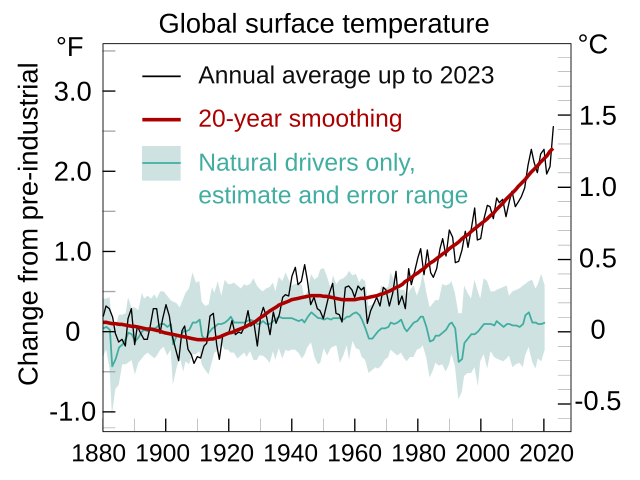
English: Changes in global surface temperature from 1880 to 2023 (black line) relative to 1850–1900 average. Annual data from NASA here:
https://climate.nasa.gov/vital-signs/global-temperature/. IPCC anomaly is 1.09 C average from 2011 to 2020 as per IPCC AR6 WG1 SPM pp5 A.1.2, so NASA data is offset to that number. Data does not go back to 1850 as datasets differ from 1850 to 1880 for NOAA, others (NASA starts in 1880, and all tend to agree from that point forward). 20-year LOWESS smooth matched to 20 year moving average as per IPCC AR6 standard for determining current warming levels. Natural influence based on CMIP6 climate model simulations of the temperature response to natural drivers only (solar and volcanic activity, green). Colored shade shows the "very likely" range of simulations. Source: IPCC AR6 WGI, Figure SPM.1b, p. SPM-7. See
File:Global Temperature And Forces.svg for a version without Fahrenheit. |
| Date | |
| Source | Own work based on SPM.1b in https://www.ipcc.ch/report/ar6/wg1/figures/summary-for-policymakers ( archive) |
| Author | Efbrazil |
Related file
-
 Global Temperature And Forces.svg
(Precursor graphic, without Fahrenheit scale)

Licensing
I, the copyright holder of this work, hereby publish it under the following license:
This file is licensed under the
Creative Commons
Attribution-Share Alike 4.0 International license.
- You are free:
- to share – to copy, distribute and transmit the work
- to remix – to adapt the work
- Under the following conditions:
- attribution – You must give appropriate credit, provide a link to the license, and indicate if changes were made. You may do so in any reasonable manner, but not in any way that suggests the licensor endorses you or your use.
- share alike – If you remix, transform, or build upon the material, you must distribute your contributions under the same or compatible license as the original.
File history
Click on a date/time to view the file as it appeared at that time.
| Date/Time | Thumbnail | Dimensions | User | Comment | |
|---|---|---|---|---|---|
| current | 18:38, 16 February 2024 |
| 960 × 720 (22 KB) | Efbrazil | Going to NASA data set and IPCC temperature offset, as per discussion on climate change talk page |
| 18:59, 13 February 2024 |
 | 960 × 720 (24 KB) | Efbrazil | Visual teaks | |
| 18:50, 13 February 2024 |
 | 960 × 720 (25 KB) | Efbrazil | Visual tweaks | |
| 18:38, 13 February 2024 |
 | 960 × 720 (25 KB) | Efbrazil | Visual tweaks | |
| 21:11, 12 February 2024 |
 | 960 × 720 (30 KB) | Efbrazil | New version with celcius / fahrenheit flipped, error range in key, 20 year smoothing emphasized | |
| 20:43, 29 January 2024 |
 | 960 × 720 (46 KB) | Efbrazil | Updated to include 2023 temperatures and a 20-year lowess smoothing line as per IPCC | |
| 03:30, 13 January 2024 |
 | 960 × 720 (53 KB) | Tofeiku | File uploaded using svgtranslate tool (https://svgtranslate.toolforge.org/). Added translation for ms. | |
| 15:12, 31 March 2023 |
 | 960 × 720 (51 KB) | Efbrazil | Removing "Year" from the x axis, it really isn't necessary | |
| 18:04, 14 December 2021 |
 | 960 × 720 (51 KB) | Efbrazil | Uploaded own work with UploadWizard |
File usage
The following pages on the English Wikipedia use this file (pages on other projects are not listed):
- 2021 in science
- Causes of climate change
- Climate
- Climate change
- Earth
- Sustainable Development Goal 13
- Talk:Causes of climate change
- Talk:Climate change/Archive 89
- Talk:Climate change/Archive 93
- Talk:Climate change/Archive 94
- Talk:List of climate change controversies
- User:FreshYoMama/TWA/Earth
- User:FreshYoMama/TWA/Earth/2
- User talk:InformationToKnowledge/sandbox
- Wikipedia talk:WikiProject Climate change/Archive 5
- Template:Climate change sidebar
- Portal:Climate change
- Portal:World
Global file usage
The following other wikis use this file:
- Usage on bcl.wikipedia.org
- Usage on fa.wikipedia.org
- Usage on ig.wikipedia.org
- Usage on ja.wikipedia.org
- Usage on ms.wikipedia.org
- Usage on pt.wikinews.org
- Usage on ro.wikipedia.org
- Usage on rw.wikipedia.org
- Usage on sr.wikipedia.org
- Usage on tr.wikipedia.org
- Usage on tw.wikipedia.org
- Usage on zh.wikipedia.org
- Usage on zu.wikipedia.org