
Original file (1,889 × 1,122 pixels, file size: 1.37 MB, MIME type: image/png)
| This is a file from the
Wikimedia Commons. Information from its
description page there is shown below. Commons is a freely licensed media file repository. You can help. |
Summary
| Description |
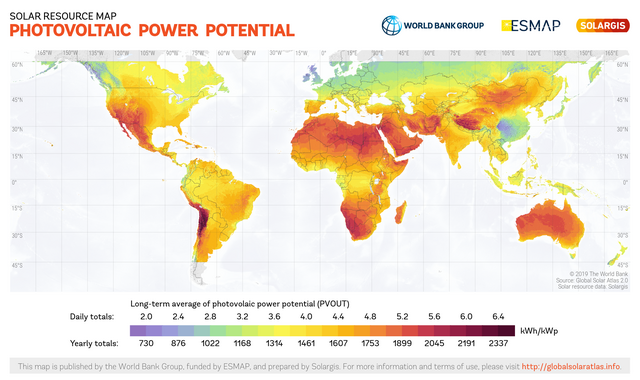
English: This solar resource map provides a summary of the estimated solar energy available for power generation and other energy applications. It represents the average daily/yearly sum of electricity production from a 1 kW-peak grid-connected solar PV power plant covering the period from 1994/1999/2007 (depending on the geographical region) to 2015. The underlying solar resource database is calculated by the Solargis model from atmospheric and satellite data with 15-minute and 30-minute time step respectively, and a spatial resolution of 1 km. Further details available from:
https://globalsolaratlas.info. |
||
| Date | |||
| Source | https://globalsolaratlas.info | ||
| Author | Solargis | ||
| Permission ( Reusing this file) |
https://globalsolaratlas.info/support/terms-of-use
|
||
| Attribution ( required by the license) | © The World Bank / | ||

The World Bank and the International Finance Corporation (IFC), collectively the World Bank Group, have published this solar resource map alongside a Global Solar Atlas consisting of global, regional and country maps, to support the scale-up of solar power in our client countries. This work is funded by the Energy Sector Management Assistance Program (ESMAP), a multi-donor trust fund administered by The World Bank and supported by 13 official bilateral donors. It is part of a global ESMAP initiative on Renewable Energy Resource Mapping that covers biomass, small hydro, solar and wind. The World Bank Group has selected Solargis as its global provider of solar resource data and related services, and this map has been prepared by Solargis, under contract to The World Bank, based on a solar resource database that they own and maintain. To obtain additional maps and information, please visit: http://globalsolaratlas.info.
Licensing
- You are free:
- to share – to copy, distribute and transmit the work
- to remix – to adapt the work
- Under the following conditions:
- attribution – You must give appropriate credit, provide a link to the license, and indicate if changes were made. You may do so in any reasonable manner, but not in any way that suggests the licensor endorses you or your use.
File history
Click on a date/time to view the file as it appeared at that time.
| Date/Time | Thumbnail | Dimensions | User | Comment | |
|---|---|---|---|---|---|
| current | 10:58, 15 July 2020 |
| 1,889 × 1,122 (1.37 MB) | Juraj.betak | Upgraded data on the map (climate period now to 2018, before to 2015; PVOUT data calculated with updated Solargis model) |
| 13:36, 25 September 2018 |
 | 1,889 × 1,122 (1.68 MB) | O-Jay | User created page with UploadWizard |
File usage
Global file usage
The following other wikis use this file:
- Usage on ca.wikipedia.org
- Usage on cs.wikipedia.org
- Usage on de.wikipedia.org
- Usage on es.wikipedia.org
- Usage on fa.wikipedia.org
- Usage on ru.wikipedia.org
- Usage on sr.wikipedia.org
- Usage on uk.wikipedia.org
- Usage on ur.wikipedia.org