
Size of this PNG preview of this SVG file:
600 × 455 pixels. Other resolutions:
317 × 240 pixels |
633 × 480 pixels |
1,013 × 768 pixels |
1,280 × 971 pixels |
2,560 × 1,941 pixels.
Original file (SVG file, nominally 600 × 455 pixels, file size: 15 KB)
| This is a file from the
Wikimedia Commons. Information from its
description page there is shown below. Commons is a freely licensed media file repository. You can help. |
Summary
| Description |
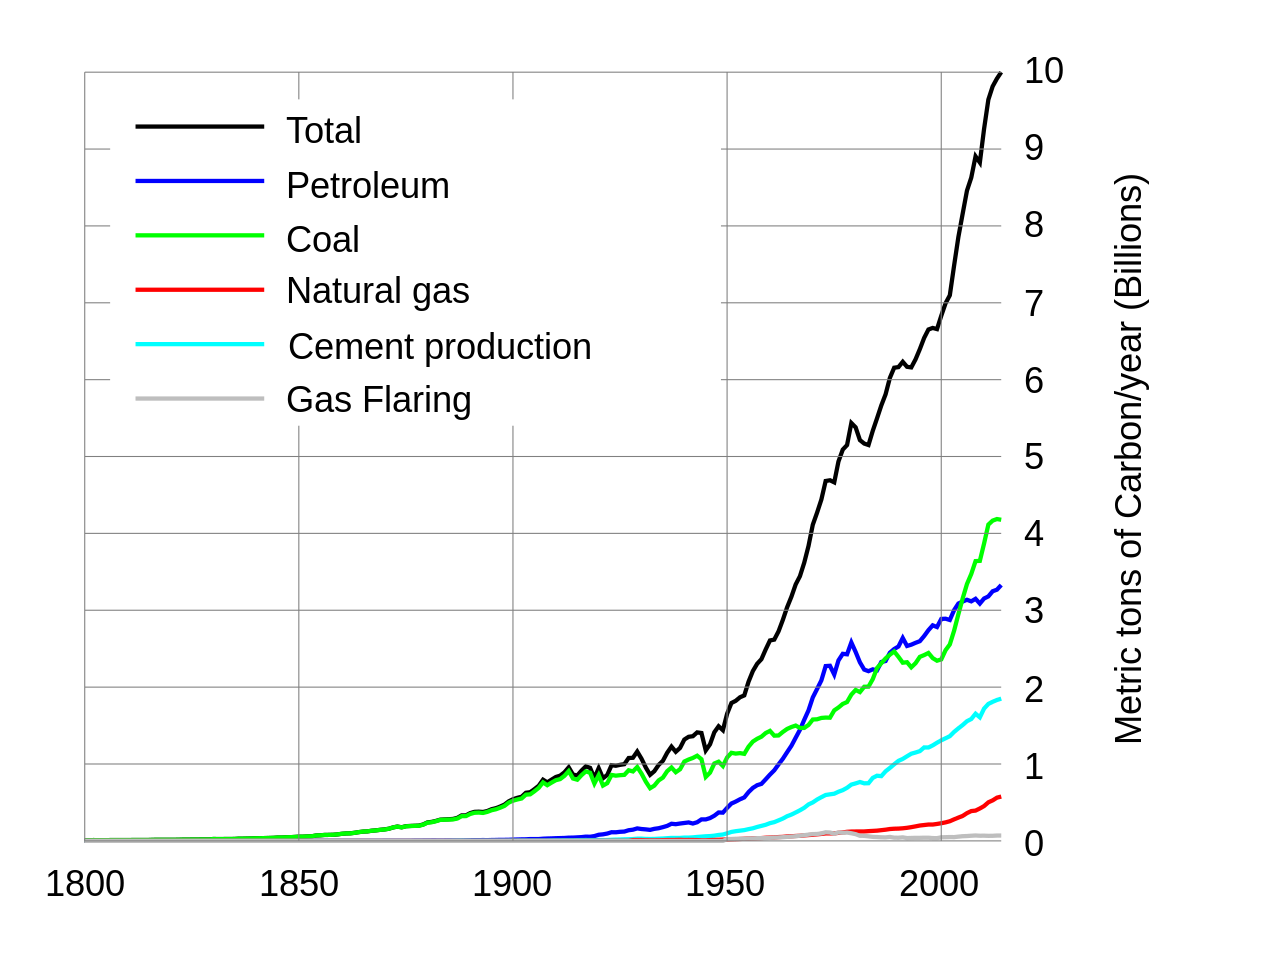
Español: Emisiones globales de
dióxido de carbono discriminadas según su origen. English: Global annual
fossil fuel
carbon dioxide emissions through year 2007, in million
metric tons of
carbon, as reported by the
Carbon Dioxide Information Analysis Center (
http://cdiac.esd.ornl.gov/home.html). |
||
| Date | |||
| Source |
Own work using:
http://cdiac.ornl.gov/ftp/ndp030/CSV-FILES/ and
Global Carbon Emission by Type to Y2004.png Original Data citation: "Marland, G., T.A. Boden, and R. J. Andres. 2007. Global, Regional, and National CO2 Emissions. In Trends: A Compendium of Data on Global Change. Carbon Dioxide Information Analysis Center, Oak Ridge National Laboratory, United States Department of Energy, Oak Ridge, Tenn., U.S.A.". |
||
| Author |
|
||
| Other versions |
File:
Global Carbon Emissions.svg has
3 embedded translations.
|
||
| Used colors | #000 #00F #0F0 #F00 #0FF #BEBEBE |
||
| SVG development | This
chart is
translated using SVG switch elements: all translations are stored in the same file.
| ||
| Source code | Gnuplot codeDon't forget to manually insert the <switch> elements!
set term svg size 2048,1536 fsize 60
set output 'Global Carbon Emissions.svg'
set border 1
set grid x lc rgb '#E0E0E0'
set grid y2 lc rgb '#C0C0C0'
set y2label 'Metric tons of Carbon/year (Billions)'
set xtics nomirror
set y2tics
unset ytics
set xrange 1800:2014
set datafile separator ','
set key top left Left reverse
plot 'global.1751_2014.csv' using 1:($2/1000) title 'Total' lc rgb 'black' lw 10 with lines, \
'' using 1:($4/1000) title 'Petroleum' lc rgb 'blue' lw 8 with lines, \
'' using 1:($5/1000) title 'Coal' lc rgb 'green' lw 8 with lines, \
'' using 1:($3/1000) title 'Natural gas' lc rgb 'red' lw 8 with lines, \
'' using 1:($6/1000) title 'Cement production' lc rgb 'cyan' lw 8 with lines, \
'' using 1:($7/1000) title 'Gas Flaring' lc rgb 'gray' lw 8 with lines
|


I, the copyright holder of this work, hereby publish it under the following licenses:
This file is licensed under the
Creative Commons Attribution-Share Alike
3.0 Unported,
2.5 Generic,
2.0 Generic and
1.0 Generic license.
- You are free:
- to share – to copy, distribute and transmit the work
- to remix – to adapt the work
- Under the following conditions:
- attribution – You must give appropriate credit, provide a link to the license, and indicate if changes were made. You may do so in any reasonable manner, but not in any way that suggests the licensor endorses you or your use.
- share alike – If you remix, transform, or build upon the material, you must distribute your contributions under the same or compatible license as the original.

|
Permission is granted to copy, distribute and/or modify this document under the terms of the GNU Free Documentation License, Version 1.2 or any later version published by the Free Software Foundation; with no Invariant Sections, no Front-Cover Texts, and no Back-Cover Texts. A copy of the license is included in the section entitled GNU Free Documentation License. |
You may select the license of your choice.
Original upload log
This image is a derivative work of the following images:
-
Global Carbon Emission by Type to Y2004.png licensed with Cc-by-sa-3.0,2.5,2.0,1.0, GFDL
- 2008-03-08T15:57:57Z Makthorpe 555x493 (59879 Bytes) {{Information |Description= {{es|Emisiones globales de dióxido de carbono discriminadas según su origen.}} Global annual [[W:fossil fuel|fossil fuel]] [[w:carbon dioxide|carbon dioxide]] emissions through year 2004, in mill
Uploaded with derivativeFX
File history
Click on a date/time to view the file as it appeared at that time.
| Date/Time | Thumbnail | Dimensions | User | Comment | |
|---|---|---|---|---|---|
| current | 19:19, 4 April 2024 |
| 600 × 455 (15 KB) | Mrmw | |
| 16:54, 28 January 2021 |
 | 2,048 × 1,536 (44 KB) | GregorB | File uploaded using svgtranslate tool (https://svgtranslate.toolforge.org/). Added translation for hr. | |
| 11:09, 29 June 2017 |
 | 2,048 × 1,536 (42 KB) | Kopiersperre | update 2014 | |
| 22:43, 31 October 2016 |
 | 2,048 × 1,536 (41 KB) | Kopiersperre | update 2013 | |
| 16:51, 12 June 2015 |
 | 2,048 × 1,536 (58 KB) | Borvan53 | + french translation | |
| 14:23, 11 June 2015 |
 | 2,048 × 1,536 (41 KB) | Kopiersperre | update 2011 | |
| 12:20, 21 November 2014 |
 | 2,048 × 1,536 (32 KB) | Tomruen | unsourced update Reverted to version as of 00:57, 13 July 2010 | |
| 12:30, 29 August 2013 |
 | 2,048 × 1,536 (33 KB) | Kopiersperre | updated | |
| 00:57, 13 July 2010 |
 | 2,048 × 1,536 (32 KB) | Autopilot | Match colors of original chart | |
| 00:03, 13 July 2010 |
 | 2,048 × 1,536 (32 KB) | Autopilot | Rescaled to billions and changed line weight |
File usage
The following pages on the English Wikipedia use this file (pages on other projects are not listed):
- Avoiding Dangerous Climate Change (2005 conference)
- Climate Change Act 2008
- Environmental impact of the energy industry
- Petroleum
- Talk:Climate change in the United States/Archive 1
- Talk:Climate change mitigation/Archive 3
- Talk:Environmental impact of the energy industry
- Talk:Sustainability/Archive 23
- Talk:Sustainability/Archive 26
- Talk:Watts Up With That?/Archive 8
- User:Debnigo
- User:Loadmaster/Articles of interest
Global file usage
The following other wikis use this file:
- Usage on ar.wikipedia.org
- Usage on bn.wikipedia.org
- Usage on ca.wikipedia.org
- Usage on da.wikipedia.org
- Usage on de.wikipedia.org
- Usage on en.wikibooks.org
- Usage on en.wikiquote.org
- Usage on es.wikipedia.org
- Usage on fa.wikipedia.org
- Usage on fr.wikipedia.org
- Usage on fr.wikiversity.org
- Usage on gl.wikipedia.org
- Usage on gu.wikipedia.org
- Usage on ha.wikipedia.org
- Usage on hi.wikipedia.org
- Usage on hr.wikipedia.org
- Usage on hu.wikipedia.org
- Usage on id.wikipedia.org
- Usage on it.wikipedia.org
- Usage on ja.wikipedia.org
- Usage on kn.wikipedia.org
- Usage on ko.wikipedia.org
- Usage on ln.wikipedia.org
View more global usage of this file.